. 2024 Aug:46:102009.
doi: 10.1016/j.tranon.2024.102009. Epub 2024 Jun 4.

GJA4 expressed on cancer associated fibroblasts (CAFs)-A 'promoter' of the mesenchymal phenotype

Affiliations

GJA4 expressed on cancer associated fibroblasts (CAFs)-A 'promoter' of the mesenchymal phenotype

Qian-Wen Ye et al. Transl Oncol. 2024 Aug.

Abstract

Background: Colorectal cancer (CRC) is the third most common cancer worldwide. Connexin is a transmembrane protein involved in gap junctions (GJs) formation. Our previous study found that connexin 37 (Cx37), encoded by gap junction protein alpha 4 (GJA4), expressed on fibroblasts acts as a promoter of CRC and is closely related to epithelial-mesenchymal transition (EMT) and tumor immune microenvironment. However, to date, the mechanism concerning the malignancy of GJA4 in tumor stroma has not been studied.

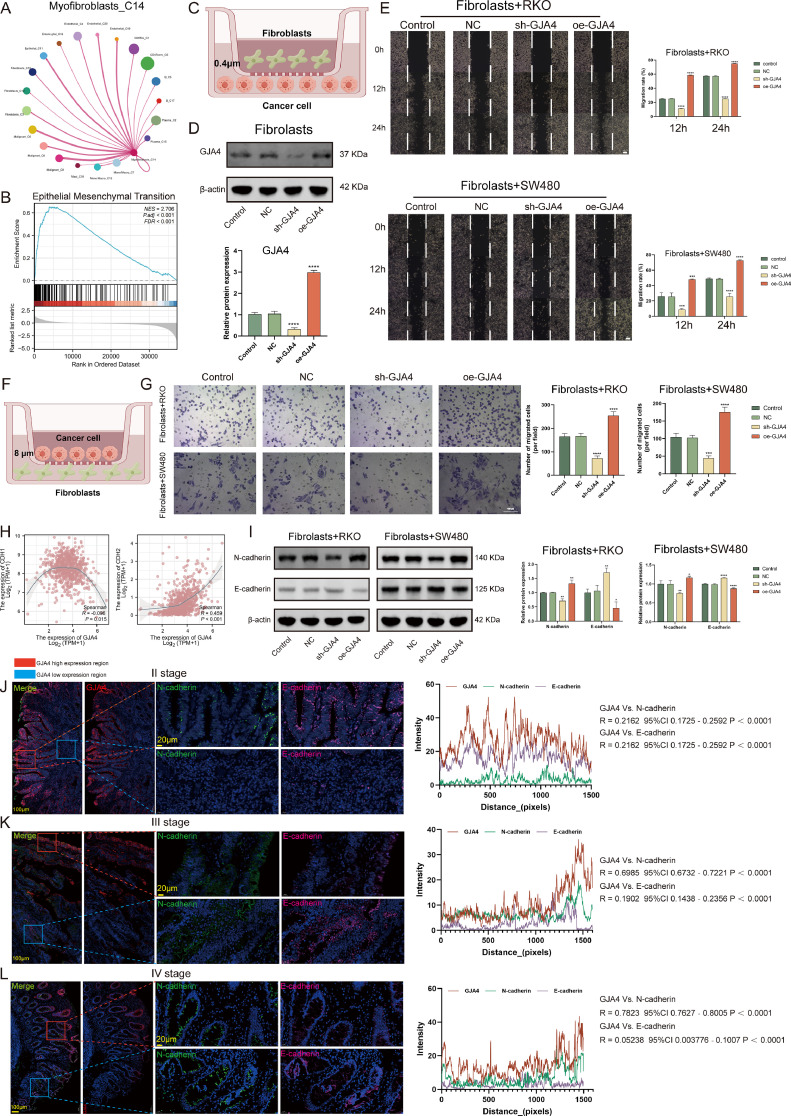
Methods: Hematoxylin-eosin (HE) and immunohistochemical (IHC) staining were used to validate the expression and localization of GJA4. Using single-cell analysis, enrichment analysis, spatial transcriptomics, immunofluorescence staining (IF), Sirius red staining, wound healing and transwell assays, western blotting (WB), Cell Counting Kit-8 (CCK8) assay and in vivo experiments, we investigated the possible mechanisms of GJA4 in promoting CRC.

Results: We discovered that in CRC, GJA4 on fibroblasts is involved in promoting fibroblast activation and promoting EMT through a fibroblast-dependent pathway. Furthermore, GJA4 may act synergistically with M2 macrophages to limit T cell infiltration by stimulating the formation of an immune-excluded desmoplasic barrier. Finally, we found a significantly correlation between GJA4 and pathological staging (P < 0.0001) or D2 dimer (R = 0.03, P < 0.05).

Conclusion: We have identified GJA4 expressed on fibroblasts is actually a promoter of the tumor mesenchymal phenotype. Our findings suggest that the interaction between GJA4+ fibroblasts and M2 macrophages may be an effective target for enhancing tumor immunotherapy.

Keywords: Cancer-associated fibroblasts; Colorectal cancer; Epithelial-mesenchymal transition; GJA4; M2 macrophages.


Conflict of interest statement

Declaration of competing interest The authors declare that they have no known competing financial interests or personal relationships that could have appeared to influence the work reported in this paper.

Figures

Fig 1
Fig. 1
Expression analysis of GJA4 (gap junction protein alpha 4). (A-C) Representative images of HE (Hematoxylin-eosin) staining and GJA4’s IHC (immunohistochemical) staining in CRC (colorectal cancer) tissues of different stages. Wilcoxon test was used to compare the expression level of GJA4 in different tumor stages (****P < 0.0001). (D) Correlation between GJA4 and ACTA2 (actin alpha 2) in TCGA (The Cancer Genome Atlas) datasets (left) and our samples (right, n = 59). The error band indicates 95% confidence interval. (E) Representative pictures of pathological HE staining of GJA4 high/low expression group. Scale bars, 500 and 100 µm (enlarged images), 1000 and 100 µm (enlarged images), respectively. (F) Spearman correlation between the expression of GJA4 and three immune-related scores (ImmuneScore, ESTIMATEScore and StromalScore) (***P < 0.001). (G) Uniform manifold approximation and projection (UMAP) dimensionality reduction analysis based on single cell RNA-seq dataset EMTAB8107. A total of 12 cell types with unique genetic markers were identified. (H-I) The UMAP (H) and Violin (I) plots depict the expression levels of GJA4 in the annotated cell types. Darker blue indicates higher expression.
Fig 2
Fig. 2
GJA4 participates in the activation of fibroblasts. (A) Fibroblasts were further clustered into seven types by UMAP dimensionality reduction algorithm, with each color representing a unique cluster. (B) Marker gene expression in seven subpopulations of fibroblasts, red shows upregulation and blue shows downregulation. (C) The major lineages of fibroblasts (fibroblasts and myofibroblasts). (D) UMAP plots show the expression of GJA4 on fibroblasts. (E) Gene Set Enrichment Analysis (GSEA) of GJA4. NES, normalized enrichment score. FDR, false discovery rate. (F) Ranking of cell differentiation according to CytoTRACE. (G) Differentiation model on UMAP based on the trajectory analysis using Monocle 3 and CytoTRACE. The development and differentiation of the cells along the trajectory is ordered by the color from dark to light. (H) The changes of significant genes during pseudotime are shown. (I) Gene expression level in single spot ordered along the pseudotime for ACTA2, CAV1, GJA4, DES, PDGFRB, and VIM. (J) CAFs (cancer-associated fibroblasts) with stable transfection of GJA4 were established. Lentiviral vectors were used to interfere with GJA4 expression. And the obtained data from WB (western blotting) illustrate transfection efficiency (%, ****P < 0.0001). (K) Immunofluorescence labeling was used to measure the levels of α-SMA and Vimentin in CRC cells (control cells and CRC cells transfected with the CAFs with NC, sh-GJA4, and oe-GJA4 constructs) (Scale bars = 20 µm). Intensity of immunofluorescence are indicated as mean ± SEM (*P < 0.05, ***P < 0.001). Each experimental procedure was conducted thricely in an independent manner. (L) GJA4 overexpression accelerating cell proliferation for fibroblasts. Cell proliferation was evaluated over 72 h of incubation in the CCK8 assay. (M-O) Sirius red staining images of CRC sections at different pathological stages, including Ⅱ (M), Ⅲ (N), and Ⅳ (O) stages (5 ×, 10 × and 10 ×, respectively). (P) Wilcoxon test was used to compare the Sirius Red (fibrosis grade) between GJA4 high expression group and low expression group (***P < 0.001).
Fig 3
Fig. 3
GJA4 promotes EMT (epithelial-mesenchymal transition) via a fibroblast-dependent pathway. (A) Cell-cell communications between fibroblasts and other cell types. (B) GSEA (Gene Set Enrichment Analysis) of correlation between GJA4 and EMT. (C) A non-contact fibroblast and cancer cell co-culture system was constructed using a Transwell insert (pore size: 0.4 μm) (upper chamber, fibroblasts; lower chamber, cancer cells) in which the culture medium was diffusible but the cells could not permeate. (D) CAFs with stable transfection of GJA4 were established. We used lentiviral vectors for overexpression and silencing of the GJA4. Recombinant lentivirus was then transduced into CAFs, and western blotting (WB) was used to detect GJA4 overexpression and knockdown efficiency. CAFs stably transfected with GJA4 were then co-cultured with tumor cells as described in C. (E) The migratory potential of the different groups of CRC cells (control cells and CRC cells transfected with the CAFs with NC, sh-GJA4, and oe-GJA4 constructs) was evaluated through the scratch-wound cell migration assays. (Scale bars = 100 µm, ANVOA, ***P < 0.001, ****P < 0.0001). Each experimental procedure was conducted thricely in an independent manner. (F-G) The tumor cell migration assay. A cancer cell and fibroblast co-culture system (upper chamber, cancer cells; lower chamber, fibroblasts, pore size: 8 μm) (F). The transwell migration assays depict that changes in the GJA4 expression of CAFs affect the invasive abilities of CRC cells (Scale bars = 100 µm, ANOVA, ***P < 0.001, ****P < 0.0001). Each experimental procedure was conducted thricely in an independent manner. (H) Correlation of GJA4 expression levels with EMT markers (CDH1 and CDH2) based on TCGA-CRC. The error band indicates 95% confidence interval. (I) The expression of the EMT-related proteins with CRC cells was examined by WB after the transfection of the CAFs with NC, sh-GJA4, and oe-GJA4 constructs. The statistical analysis of the WB result is shown in the right panel (ANOVA, *P < 0.05, **P < 0.01, ****P < 0.0001). Each experimental procedure was conducted thricely in an independent manner. (J-L) IF staining images of GJA4, E-cadherin, and N-cadherin in stage II (J), III (K), and IV (L) CRC tissues. Red stands for regions with high GJA4 expression and blue stands for regions with low GJA4 expression. Representative views of co-staining of GJA4 and E-cadherin, and N-cadherin are shown in the magnified image view to the right. Scale bars, 100 and 20 µm (enlarged images). Nuclei (DAPI) in blue. Fluorescence co-localization analyses of GJA4, E-cadherin and N-cadherin were provided (right), and the co-localization quantifications were presented as Spearman correlation coefficients.
Fig 4
Fig. 4
GJA4 on fibroblasts can promote the M2 phenotype of macrophages. (A) The heatmap shows the strength of the correlation between GJA4 and tumor-infiltrating immune cells in forty publicly available CRC datasets. Eight immune infiltration algorithms were utilized. Red, positive correlation; blue, negative correlation. (B) Non-contact co-culture of fibroblasts and macrophages (upper chamber, fibroblasts; lower chamber, macrophages, pore size: 0.4 μm). (C) Immunofluorescence of fibroblasts co-cultured with macrophages (ns, not significant, *P < 0.05, **** P < 0.0001, scale bars: 20 μm). Immunofluorescence intensities are indicated as mean intensity ± SD. (D) Models of subcutaneous tumors are shown schematically. RKO cells and stable transfection GJA4 CAFs were mixed 1:1, and then subcutaneously injected into the right axillary region of mice (1 × 10⁷ cells / mouse). (E) Mouse xenograft tumors (n = 6 per group). (F) Tumor formation was observed 7 days later. Tumor size, represented by the maximum (a) and minimum (b) diameters, was measured twice a week. Tumor volume (V) was calculated using the formula: V = 1/2ab2 (*P < 0.05, **P < 0.01). (G) M2 macrophage infiltration level of the different groups of CRC cells (control cells and CRC cells transfected with the CAFs with NC, sh-GJA4, and oe-GJA4 constructs). The obtained data are indicated as mean ± SD (ns, not significant, ** P < 0.01, **** P < 0.0001). (H-J) IF staining images of GJA4 and CD163 in stage II (H), III (I), and IV (J) CRC tissue. Red stands for regions with high GJA4 expression and blue stands for regions with low GJA4 expression. Representative views of co-staining of GJA4 and CD163 are shown in the magnified image view to the right. Scale bars, 100 and 20 µm (enlarged images). Nuclei (DAPI) in blue. (K) Fluorescence co-localization analysis of GJA4 and CD163, and the co-localization quantifications were presented as Spearman correlation coefficients.
Fig 5
Fig. 5
GJA4 may act synergistically with M2 macrophages to formate an immune-excluded desmoplasic barrier. (A-D) Spatial transcription data of tumor tissue sections from two CRC patients were obtained from a publicly available database (http://www.big.ac.cn/, accession number: VISDS000781 and VISDS000782). HE staining of CRC tissue sections of ST (Spatial transcriptome) spots (A and C). Unbiased clustering of ST spots (B and D). (E-H) Spatial feature plots of signature score of GJA4+ fibroblasts, M2 macrophages, CD8+ T cells, B cells, CD4+ T cells, DC cells, and epithelial cells in tissue sections. The ‘xCell’ algorithm is used to estimate score points of each cluster. (I-J) The Spearman correlation of signature score of GJA4+ fibroblasts and M2 macrophages. The error band indicates 95% confidence interval. (K-L) Functional enrichment analysis of genes significantly enriched in GJA4+ fibroblasts/M2 macrophages cluster in two patients. Biological Processes (BP), Cellular Components (CC), Molecular Functions (MF), and Kyoto Encyclopedia of Genes and Genomes (KEGG). (M) Fluorescent micrograph illustrating immunofluorescence stainings for GJA4 (red), CD8 (pink), CK (green), and nuclear staining (blue) in stage IV CRC tissue. Representative views of co-staining of GJA4 and CK, and CD8 are shown in the magnified image view to the right. Scale bars, 500 and 100 µm (enlarged images). (N) The Spearman correlation between GJA4 and Tumor Immune Exclusion score. (O) The Spearman correlation between GJA4 and CD8A or CD274 in TCGA-CRC. (P) Representative images of IHC staining for CD8 or PD‐L1 based on our CRC sample (left). The H-score correlation between GJA4 and CD8 or PDL1 in our samples (right, n = 59). The error band indicates 95% confidence interval. (Q) Four IPS score levels of ctla4+pd1-, ctla4-pd1-, ctla4+pd1+, and ctla4-pd1+ in GJA4 high and low expression groups (TCIA database). Wilcoxon test, ***P < 0.001.
Fig 6
Fig. 6
Correlation analysis of GJA4 with patients’ coagulation indicators. (A-B) The correlation between GJA4 and coagulation indicators [D-dimer (A) and Fibrinogen (B)] (Spearman correlation coefficient, n = 59).

Similar articles

Cited by

References

    1. Dekker E., Tanis P.J., Vleugels J.L.A., Kasi P.M., Wallace M.B. Colorectal cancer. Lancet. 2019;394(10207):1467–1480. doi: 10.1016/s0140-6736(19)32319-0. - DOI - PubMed
    1. Biller L.H., Schrag D. Diagnosis and treatment of metastatic colorectal cancer: a review. JAMa. 2021;325(7):669–685. doi: 10.1001/jama.2021.0106. - DOI - PubMed
    1. Ciardiello F., Ciardiello D., Martini G., Napolitano S., Tabernero J., Cervantes A. Clinical management of metastatic colorectal cancer in the era of precision medicine. CA Cancer J. Clin. 2022;72(4):372–401. doi: 10.3322/caac.21728. - DOI - PubMed
    1. Shin A.E., Giancotti F.G., Rustgi A.K. Metastatic colorectal cancer: mechanisms and emerging therapeutics. Trends. Pharmacol. Sci. 2023;44(4):222–236. doi: 10.1016/j.tips.2023.01.003. - DOI - PMC - PubMed
    1. Hervé J.C., Bourmeyster N., Sarrouilhe D., Duffy H.S. Gap junctional complexes: from partners to functions. Prog. Biophys. Mol. Biol. 2007;94(1–2):29–65. doi: 10.1016/j.pbiomolbio.2007.03.010. - DOI - PubMed