

Linking sequences of exposure to residential (dis)advantage, individual socioeconomic status, and health
- PMID: 38833849
- PMCID: PMC11878194
- DOI: 10.1016/j.healthplace.2024.103262
Linking sequences of exposure to residential (dis)advantage, individual socioeconomic status, and health
Abstract
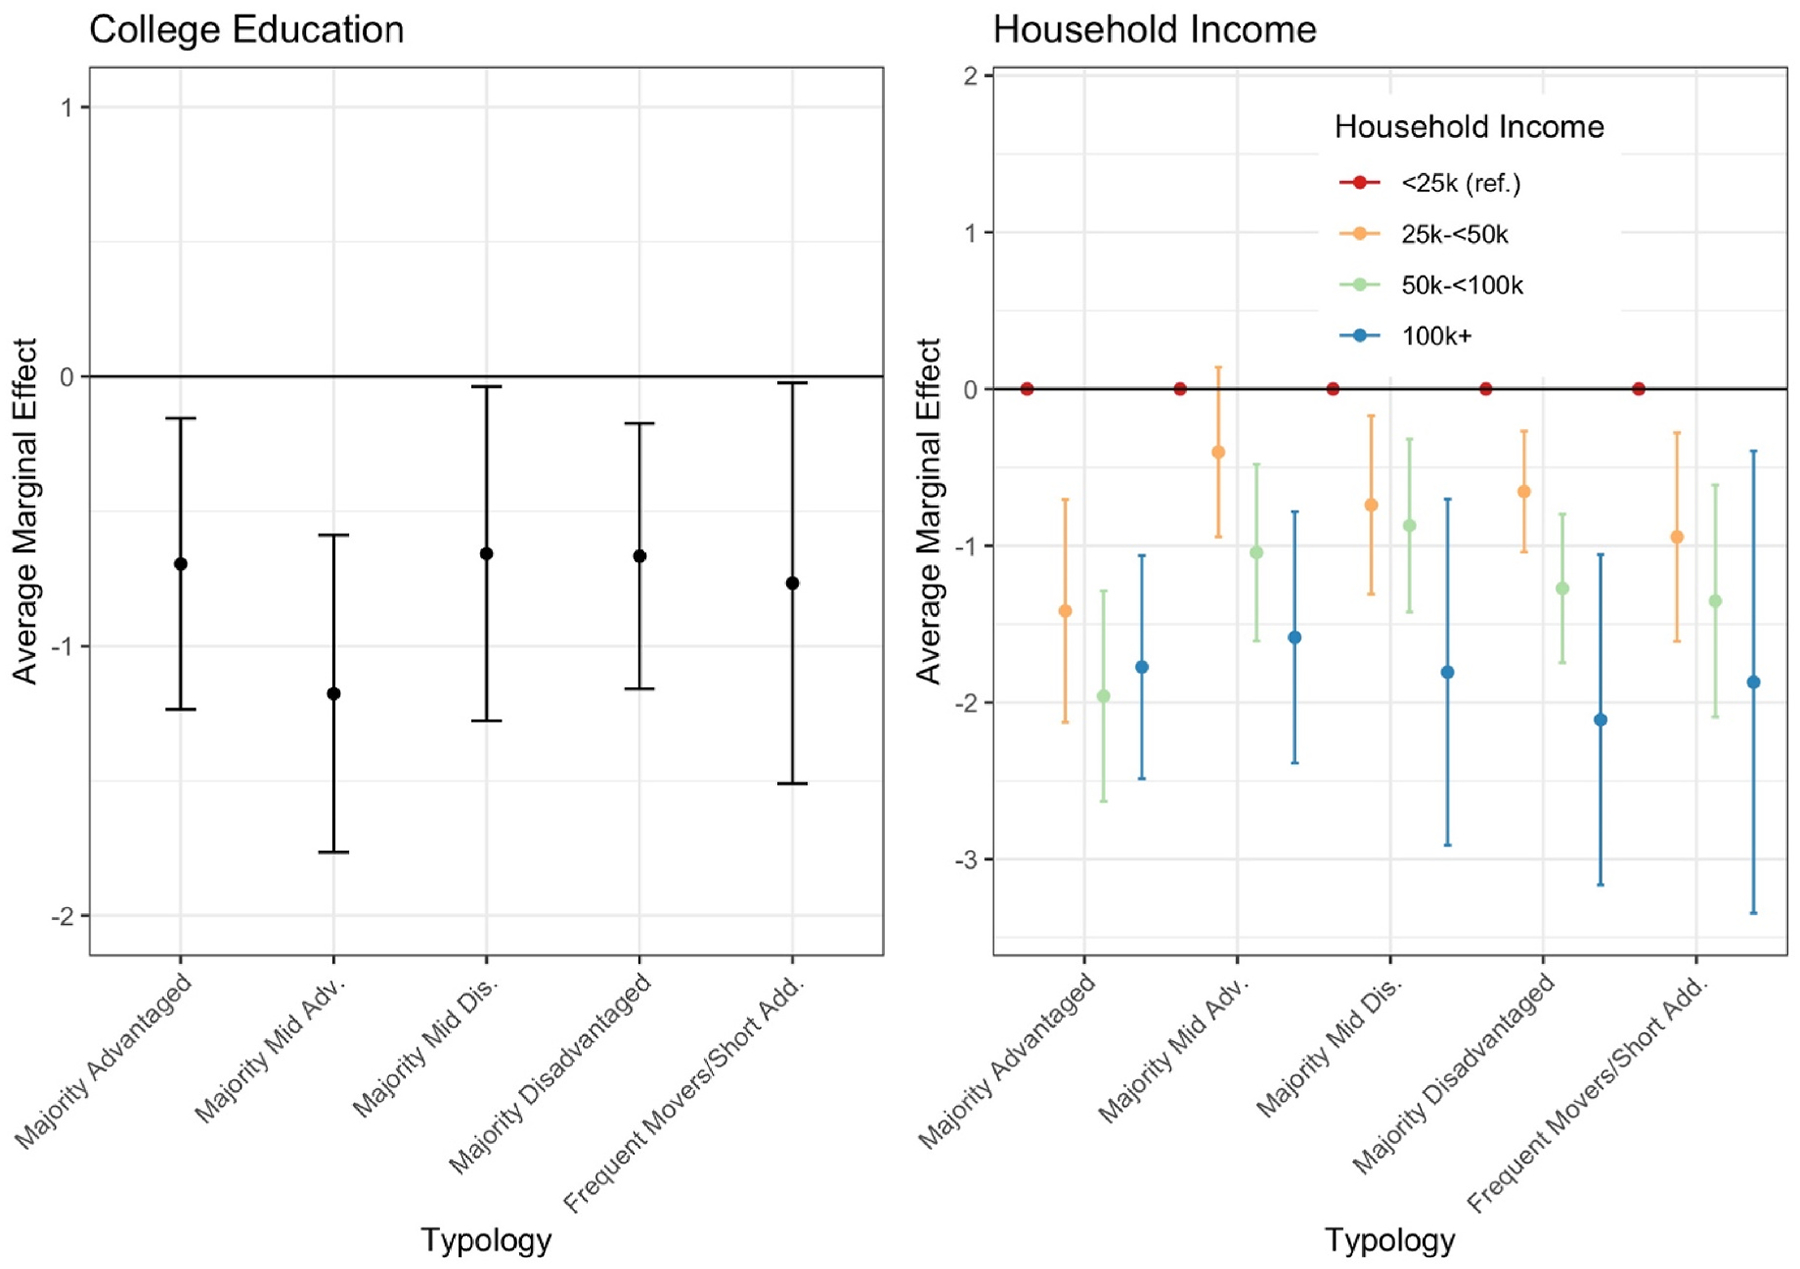
Life course theories suggest that the relationship between residential (dis)advantage and health is best understood by examining the ordering and duration of cumulative exposures across the life course. This study employs sequence and cluster analysis on two decades of residential histories linked to the Survey of the Health of Wisconsin to define typologies of exposure to residential (dis)advantage and use these typologies to predict self-rated fair/poor health. Exposure to residential (dis)advantage is mostly stable across the adult life course and greater disadvantage predicts fair/poor health. Longitudinal exposures to residential (dis)advantage shape health independently of and in tandem with individual-level resources.
Keywords: Health; Life course; Residential disadvantage; Socioeconomic status.
Copyright © 2024 The Authors. Published by Elsevier Ltd.. All rights reserved.
Figures


Similar articles
-
The health implications of cumulative exposure to contextual (dis)advantage: methodological and substantive advances from a unique data linkage.Am J Epidemiol. 2025 Feb 5;194(2):480-489. doi: 10.1093/aje/kwae183. Am J Epidemiol. 2025. PMID: 38973742 Free PMC article.
-
Education and Health across Lives and Cohorts: A Study of Cumulative (Dis)advantage and Its Rising Importance in Germany.J Health Soc Behav. 2018 Mar;59(1):94-112. doi: 10.1177/0022146517751206. Epub 2018 Jan 16. J Health Soc Behav. 2018. PMID: 29337605
-
Multiple contexts of exposure: Activity spaces, residential neighborhoods, and self-rated health.Soc Sci Med. 2015 Dec;146:204-13. doi: 10.1016/j.socscimed.2015.10.040. Epub 2015 Oct 23. Soc Sci Med. 2015. PMID: 26519605
-
Intergenerational transmission of health inequalities: towards a life course approach to socioeconomic inequalities in health - a review.J Epidemiol Community Health. 2024 Aug 25;78(10):641-649. doi: 10.1136/jech-2022-220162. J Epidemiol Community Health. 2024. PMID: 38955463 Free PMC article. Review.
-
Health disparities based on socioeconomic inequities: implications for urban health care.Acad Med. 2004 Dec;79(12):1139-47. doi: 10.1097/00001888-200412000-00004. Acad Med. 2004. PMID: 15563647 Review.
Cited by
-
Xu et al respond to "Invited commentary: improving spatial exposure data for everyone-life-course social context and ascertaining residential history".Am J Epidemiol. 2025 Mar 4;194(3):578-579. doi: 10.1093/aje/kwae243. Am J Epidemiol. 2025. PMID: 39270678 No abstract available.
-
Cumulative neighborhood disadvantage and racial and geographic disparities in epigenetic aging.SSM Popul Health. 2025 Jun 10;31:101825. doi: 10.1016/j.ssmph.2025.101825. eCollection 2025 Sep. SSM Popul Health. 2025. PMID: 40584435 Free PMC article.
-
The Automatic Context Measurement Tool (ACMT) to Compile Participant-Specific Built and Social Environment Measures for Health Research: Development and Usability Study.JMIR Form Res. 2024 Oct 4;8:e56510. doi: 10.2196/56510. JMIR Form Res. 2024. PMID: 39365663 Free PMC article.
References
MeSH terms
Grants and funding
LinkOut - more resources
Full Text Sources
