. 2024 Jul 8;34(13):2801-2811.e9.
doi: 10.1016/j.cub.2024.05.018. Epub 2024 Jun 3.

Prefrontal cortical ripples mediate top-down suppression of hippocampal reactivation during sleep memory consolidation

Affiliations

Prefrontal cortical ripples mediate top-down suppression of hippocampal reactivation during sleep memory consolidation

Justin D Shin et al. Curr Biol. .

Abstract

Consolidation of initially encoded hippocampal representations in the neocortex through reactivation is crucial for long-term memory formation and is facilitated by the coordination of hippocampal sharp-wave ripples (SWRs) with cortical slow and spindle oscillations during non-REM sleep. Recent evidence suggests that high-frequency cortical ripples can also coordinate with hippocampal SWRs in support of consolidation; however, the contribution of cortical ripples to reactivation remains unclear. We used high-density, continuous recordings in the hippocampus (area CA1) and prefrontal cortex (PFC) over the course of spatial learning and show that independent PFC ripples dissociated from SWRs are prevalent in NREM sleep and predominantly suppress hippocampal activity. PFC ripples paradoxically mediate top-down suppression of hippocampal reactivation rather than coordination, and this suppression is stronger for assemblies that are reactivated during coordinated CA1-PFC ripples for consolidation of recent experiences. Further, we show non-canonical, serial coordination of independent cortical ripples with slow and spindle oscillations, which are known signatures of memory consolidation. These results establish a role for prefrontal cortical ripples in top-down regulation of behaviorally relevant hippocampal representations during consolidation.

Keywords: consolidation; hippocampus; non-REM; prefrontal cortex; reactivation; replay; ripples; sleep; suppression; top-down.


Conflict of interest statement

Declaration of interests The authors declare no competing interests.

Figures

Figure 1.
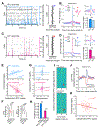
Figure 1.. Independent and coordinated ripple events in CA1 and PFC.
(A) Example CA1 and PFC raster plot illustrating the occurrence of independent CA1 and PFC ripples and coordinated events. Events indicated by the arrowheads are expanded on right to show LFP and single unit activity. (B) PFC ripple triggered spectrogram combined across all animals (n = 8 rats) and epochs (n = 72 epochs; n = 37,335 ripples). Note the associated spindle band activity (12-16 Hz) during these events. (C) Example PFC ripple event shown across 5 tetrodes. Detected ripple event is highlighted in red. (D) Cross-correlation between all ripple events in CA1 and PFC. Red dashed line indicate the 95% confidence intervals for jittered data. (E) Independent ripple rate over the 9 sleep epochs (left, PFC: F = 2.44, *p = 0.03; CA1: F = 1.18, p = 0.34, main effect of time, repeated measures ANOVA). (F) The correlations between overall and coordinated ripple rate over time for CA1 and PFC events suggest PFC driven coupling (PFC, r = 0.91 ± 0.03; CA1, r = 0.45 ± 0.18, *p = 0.01). (G) Peak spindle power during independent vs coordinated PFC ripple events (Independent = 1.42 ± 0.01, Coordinated = 1.66 ± 0.01, ***p = 2.11×10−66). See also Figures S1, S2, and Table S1.
Figure 2.
Figure 2.. Predominant suppression of CA1 activity during independent PFC ripples.
(A) Independent PFC ripple triggered modulation of PFC neurons (left), CA1 pyramidal (middle), and CA1 interneurons (right). (Right) Overall modulation in each area showing neurons excited or suppressed during ripples, with predominantly excitation in PFC and predominantly suppression in CA1 (pyramidal and interneurons). Gray lines indicate individual animals. (B) The degree of suppression was higher in INH interneurons as compared to pyramidal cells (±200 around ripple onset; ***p = 1.37×10⁻⁹). (C) Timing of peak suppression for CA1 INH cells (pyramidal and interneurons) and PFC EXC cells (Comparison of peak timing distributions, ***p = 4.90×10−46). (D) Relationship between CA1 INH modulation and PFC ripple frequency, amplitude, and length (MI vs Frequency, r = 0.13, *p = 0.018; MI vs Amplitude, r = −0.04, p = 0.41; MI vs Length, r = −0.01, p = 0.90). See also Figures S2 and S3.
Figure 3.
Figure 3.. Properties of PFC ripple modulated CA1 pyramidal neurons.
(A) Example firing maps for CA1 EXC, INH, and non-modulated cells during one trajectory. (B) Differences in spatial properties for CA1 EXC and INH pyramidal cells during the run session preceding the sleep epoch in which the cells were modulated (Theta firing rate, EXC = 1.20 ± 0.10 Hz, INH = 2.05 ± 0.10 Hz, ***p = 2.08×10⁻⁶; Number of fields, EXC = 3.3 ± 0.17, INH = 3.99 ± 0.11, **p = 0.002; Field width, EXC = 21.67 ± 0.91 cm, INH = 26.56 ± 0.61 cm, ***p = 1.1×10⁻⁴; Spatial information (bits/spike), EXC = 1.52 ± 0.12 bits, INH = 1.49 ± 0.06 bits, p = 0.83; Stability, EXC = 0.54 ± 0.03, INH = 0.72 ± 0.01, ***p = 9.01×10⁻⁷; Pairwise phase consistency, EXC = 0.10 ± 0.01, INH = 0.05 ± 0.004, ***p = 3.31×10⁻¹⁰). (C) (Left) Mean NREM firing rate and intra-SWR firing dynamics for CA1 EXC and INH cells during coordinated ripples (NREM firing rate, EXC = 1.07 ± 0.11 Hz, INH = 0.81 ± 0.05 Hz, p = 0.18; FR gain, EXC = 2.02 ± 0.16, INH = 4.07 ± 0.10, ***p = 2.88×10⁻²⁷; Burst probability, EXC = 0.031 ± 0.006, INH = 0.075 ± 0.005, ***p = 6.38×10⁻⁵; Spike latency, EXC = 0.080 ± 0.006, INH = 0.099 ± 0.001, ***p = 1.61×10⁻⁵). (Right) Relationship between SWR bursting incidence (top, EXC: r = 0.29, p = 0.08, INH: r = −0.79, ***p = 5.20×10−69) or spike latency for CA1 EXC and INH cells (bottom, EXC: r = −0.21, p = 0.21, INH: r = 0.54, *** p = 9.51×10⁻²⁵) with modulation index (MI) during independent PFC ripple events. (D) Modulation of PFC and CA1 neurons during coordinated ripples, aligned to ripple onset in the opposing area. (E) Relationship between MI during coordinated ripples and independent PFC ripples (top, CA1, EXC: r = 0.03, p = 0.82; INH: r = −0.82, ***p = 6.84×10−80; bottom, PFC, EXC: r = 0.76, ***p = 1.34×10−92; INH: r = 0.76, ***p = 1.51×10⁻¹⁰). Note the negative relationship for CA1 INH cells, indicating that stronger the recruitment during coordinated ripples, the more inhibited the cells are during independent PFC ripples. See also Figure S3.
Figure 4.
Figure 4.. Assembly reactivation during independent and coordinated ripple events.
(A) (Left) Example PFC raster plot during NREM sleep with the reactivation strength of an assembly overlaid. (Right) Neuron weights for the plotted assembly on the left, with member cells highlighted in blue. (B) (Left) Independent PFC and CA1 ripple triggered PFC reactivation strength with inset highlighting cross-regional modulation. (Right) Example PFC assembly aligned to CA1 and PFC ripple events (top) and the absolute weights of EXC and INH PFC cells (bottom; modulation during independent CA1 SWRs, EXC = 0.137 ± 0.003, INH = 0.131 ± 0.003, p = 0.37). (C) and (D) Same as in (A) and (B) but for CA1 (modulation during independent PFC ripples, EXC = 0.112 ± 0.004, INH = 0.087 ± 0.001, ***p = 8.04×10⁻⁷). (E) Relationship between Z-scored assembly reactivation strength during independent PFC ripples and coordinated ripples (PFC: r = 0.53, ***p = 1.28×10⁻²³; CA1: r = −0.71, ***p = 4.25×10−87). Note that PFC reactivation strength is correlated across events, whereas CA1 assemblies that are highly suppressed during independent PFC ripples are strongly reactivated during coordinated ripples. (F) Reactivation strength during within-area independent and coordinated ripples and during opposing area independent events (PFC: Independent-PFC = 0.71 ± 0.03, Coordinated-PFC = 0.96 ± 0.04, Independent-CA1 = 0.13 ± 0.02, **p = 0.0023, ***p = 3.21×10⁻³³, ***p = 2.12×10−53 for independent-PFC vs coordinated-PFC, independent-PFC vs independent-CA1, and coordinated-PFC vs independent-CA1, respectively; CA1: Independent-CA1 = 1.67 ± 0.03, Coordinated-CA1 = 1.11 ± 0.03, Independent-PFC = −0.51 ± 0.02, ***p = 2.44×10⁻¹⁸, ***p = 7.45×10−239, ***p = 1.14×10−128 for independent-CA1 vs coordinated-CA1, independent-CA1 vs independent-PFC, and coordinated-CA1 vs independent-PFC, respectively; Kruskal-Wallis test, Bonferroni corrected for multiple comparison). (G) Relationship between independent PFC ripple reactivation and reinstatement of assemblies in the subsequent run epoch (PFC: r = −0.002, p = 0.76, n = 257; CA1: r = 0.15, **p = 0.0031, n = 382). (H) Prediction of intra-area ripple type (independent or coordinated) using spike count data (PFC: data = 0.6 ± 0.001, shuffle = 0.5 ± 4.64×10⁻⁵, ***p = 3.39×10−50; CA1: data = 0.55 ± 0.005, shuffle = 0.50 ± 1.37×10⁻⁴, ***p = 1.28×10⁻²⁶). (I) All CA1-PFC joint assemblies sorted by independent PFC ripple aligned reactivation strength. Assemblies must have at least one member cell in each area to be included in analysis. Note that the high degree of CA1-PFC assembly suppression during independent PFC ripples is associated with strong reactivation during CA1-PFC coordinated ripples (red arrowheads). (J) The bottom 50% of assemblies sorted by independent PFC ripple aligned reactivation strength. (K) CA1-PFC reactivation strengths during independent PFC ripples were negatively correlated with reactivation during CA1-PFC coordinated events, similar to what is seen in CA1 assemblies (r = −0.25, ***p = 3.69×10⁻⁴). See also Figures S4 and S5.
Figure 5.
Figure 5.. Differences in content between independent and coordinated SWR replay events.
(A) Example CA1 rasters during independent (black) and coordinated (red) SWR events. Only significant replay events are shown. (B) Jump distance and absolute weighted correlation for significant CA1 replay events decoded during independent CA1 SWRs and coordinated ripples (Jump distance: Independent = 0.468 ± 0.003, Coordinated = 0.505 ± 0.005, ***p = 2.73×10⁻¹¹; Weighted correlation: Independent = 0.620 ± 0.002, Coordinated = 0.585 ± 0.003, ***p = 1.10×10⁻¹⁷). (C) Rank-order correlation analysis. Example rank-order matrix and template from an example sleep epoch (Left). Templates were generated separately for independent and coordinated ripple events. The order of unit spiking (both pyramidal cells and interneurons included) was more consistent for independent SWR events as compared to coordinated SWRs (Independent = 0.356 ± 0.002, Coordinated = 0.344 ± 0.004, ***p = 3.34×10⁻⁵, Wilcoxon rank sum). (D) Population dimensionality was higher during independent SWRs as compared to coordinated SWRs (Independent = 0.239 ± 0.002, Coordinated = 0.222 ± 0.002, ***p = 4.37×10⁻¹⁵, Wilcoxon rank sum) (E) Sequence degradation (rZshuf) of independent, coordinated, and awake replay events after shuffling individual cells’ linearized firing fields (Independent = 0.585 ± 0.004, Coordinated = 0.475 ± 0.005, Wake = 0.662 ± 0.004, ***p = 7.34×10−79, ***p = 5.70×10−42 ***p = 2.40×10−169 for Independent vs Coordinated, Independent vs Wake, and Coordinated vs Wake, respectively; Kruskal-Wallis test, Bonferroni corrected for multiple comparison). (F) Per-cell contribution (PCC) to all significant replay for CA1 modulated vs non-modulated cells (top, modulated = 55.04 ± 1.28, non-modulated = 46.65 ± 1.02, ***p = 2.39×10⁻⁷) and the difference in PCC (coordinated minus independent) to independent and coordinated events (bottom, modulated = 10.44 ± 0.57, non-modulated = 8.17 ± 0.55, ***p = 9.88×10⁻⁴). See also Figure S5.
Figure 6.
Figure 6.. Serially coupled spindles, ripples, and slow oscillations.
(A) Cross-correlation between independent or coordinated CA1 SWRs with PFC spindles and SOs (trough time). Note that only coordinated CA1-PFC ripples tend to be associated with spindle oscillations. Furthermore, the timing of SWRs relative to SOs is different between these events, with coordinated ripples occurring primarily at the trough and independent SWRs preceding SO troughs. (B) Average waveforms for SOs and other, lower amplitude slow waves extracted from PFC LFPs. (C) Probability of coordinated and independent ripple associated CA1 replay during up and down states (Coordinated: up = 0.19 ± 0.02, down = 0.11 ± 0.01, ***p = 2.30×10⁻⁴; Independent: up = 0.09 ± 0.01, down = 0.08 ± 0.01, p = 0.18). (D) Raster showing the reactivation strengths of example CA1 and PFC assemblies in relation to LFP events. Note the sequential organization of events with PFC leading CA1. (E) Event probability fold change of spindles and ripples aligned to SO troughs (Spindles, ***p = 2.84×10⁻¹⁴; PFC ripples, ***p = 1.66×10⁻⁷; CA1 ripples, ***p = 3.86×10⁻⁵, ttest vs 0), showing the spindle-PFC ripple-CA1 ripple timing. (F) (Left) Cumulative proportion of event timings within ±250 ms of SO troughs (Spindles vs PFC ripples, ***p = 2.41×10⁻¹⁶, PFC ripples vs CA1 ripples, ***p = 4.62×10⁻¹³), and (Right) preferred SO phase for each event type (Spindles vs PFC ripples, U2 = 2.63, ***p = 5.73×10⁻²³, PFC ripples vs CA1 ripples, U2 = 2.54, ***p = 3.61×10⁻²², Watson’s U2 test). Gray shaded area indicates repeated data for visualization. (G) SO trough aligned CA1 and PFC reactivation strength during SO associated coordinated events where PFC ripples precede CA1 SWRs (PFC vs shuffle, ***p = 4.91×10⁻¹⁹; CA1 vs shuffle, ***p = 2.12×10−39; PFC vs CA1 timing, ***p = 7.96×10⁻⁵). (H) (Left) Relationship between independent PFC ripple associated CA1 suppression and SO upstate CA1 reactivation strength (data: r = −0.40, ***p = 3.01×10⁻²¹, shuffle: r = −0.01, p = 0.86), again showing a negative relationship. (Middle) SO trough aligned reactivation strength for CA1 assemblies. (Right) Z-scored SO trough aligned CA1 reactivation strength plotted for the first and fourth quartiles. See also Figure S6.

Update of

Similar articles

Cited by

References

    1. Buzsaki G. (1989). Two-stage model of memory trace formation: a role for “noisy” brain states. Neuroscience 31, 551–570. 10.1016/0306-4522(89)90423-5. - DOI - PubMed
    1. Squire LR, and Alvarez P (1995). Retrograde amnesia and memory consolidation: a neurobiological perspective. Curr Opin Neurobiol 5, 169–177. 10.1016/0959-4388(95)80023-9. - DOI - PubMed
    1. Nadel L, and Moscovitch M (1997). Memory consolidation, retrograde amnesia and the hippocampal complex. Curr Opin Neurobiol 7, 217–227. 10.1016/s0959-4388(97)80010-4. - DOI - PubMed
    1. Girardeau G, and Zugaro M (2011). Hippocampal ripples and memory consolidation. Curr Opin Neurobiol 21, 452–459. 10.1016/j.conb.2011.02.005. - DOI - PubMed
    1. Logothetis NK, Eschenko O, Murayama Y, Augath M, Steudel T, Evrard HC, Besserve M, and Oeltermann A (2012). Hippocampal-cortical interaction during periods of subcortical silence. Nature 491, 547–553. 10.1038/nature11618. - DOI - PubMed

LinkOut - more resources