. 2024 Sep 9;73(10):1684-1701.
doi: 10.1136/gutjnl-2023-331854.

DYRK1B blockade promotes tumoricidal macrophage activity in pancreatic cancer

Affiliations

DYRK1B blockade promotes tumoricidal macrophage activity in pancreatic cancer

Anna Brichkina et al. Gut. .

Abstract

Objective: Highly malignant pancreatic ductal adenocarcinoma (PDAC) is characterised by an abundant immunosuppressive and fibrotic tumour microenvironment (TME). Future therapeutic attempts will therefore demand the targeting of tumours and stromal compartments in order to be effective. Here we investigate whether dual specificity and tyrosine phosphorylation-regulated kinase 1B (DYRK1B) fulfil these criteria and represent a promising anticancer target in PDAC.

Design: We used transplantation and autochthonous mouse models of PDAC with either genetic Dyrk1b loss or pharmacological DYRK1B inhibition, respectively. Mechanistic interactions between tumour cells and macrophages were studied in direct or indirect co-culture experiments. Histological analyses used tissue microarrays from patients with PDAC. Additional methodological approaches included bulk mRNA sequencing (transcriptomics) and proteomics (secretomics).

Results: We found that DYRK1B is mainly expressed by pancreatic epithelial cancer cells and modulates the influx and activity of TME-associated macrophages through effects on the cancer cells themselves as well as through the tumour secretome. Mechanistically, genetic ablation or pharmacological inhibition of DYRK1B strongly attracts tumoricidal macrophages and, in addition, downregulates the phagocytosis checkpoint and 'don't eat me' signal CD24 on cancer cells, resulting in enhanced tumour cell phagocytosis. Consequently, tumour cells lacking DYRK1B hardly expand in transplantation experiments, despite their rapid growth in culture. Furthermore, combining a small-molecule DYRK1B-directed therapy with mammalian target of rapamycin inhibition and conventional chemotherapy stalls the growth of established tumours and results in a significant extension of life span in a highly aggressive autochthonous model of PDAC.

Conclusion: In light of DYRK inhibitors currently entering clinical phase testing, our data thus provide a novel and clinically translatable approach targeting both the cancer cell compartment and its microenvironment.

Keywords: immunotherapy; macrophages; molecular carcinogenesis; pancreatic cancer; pancreatic tumours.


Conflict of interest statement

Competing interests: None declared.

Figures
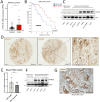
Figure 1
Figure 1
DYRK1B is expressed in pancreatic cancer cells. (A) DYRK1B mRNA expression (in transcript per million) in bulk tissue derived from patients with PDAC (n=59). Subtype classification as described in Rashid et al. Each dot represents one patient (mean±SD). (B) Kaplan-Meier plot depicting overall survival of patients with PDAC in relation to DYRK1B expression (Yeh cohort, scan split and log-rank test). (C) DYRK1B immunoblot of human cell lines. Actin was used as a loading control. Shown is one representative blot of n=2. (D) DYRK1B immunohistochemistry of tissue microarrays derived from resected PDAC material. (E) Dyrk1b mRNA expression (in counts per million) from mouse KPC bulk tissue and from KPC-derived primary organoids. Each dot represents one animal or one organoid line. (F) DYRK1B Western blot of murine cell lines. Shown is one representative blot of n=2. (G) DYRK1B immunohistochemistry on mouse KPC tumour tissue. The scale bar is 100 µm. DYRK1B, dual specificity and tyrosine phosphorylation-regulated kinase 1B; mRNA, messenger RNA; PDAC, pancreatic ductal adenocarcinoma; S, tumour stroma area; T, epithelial tumour area; TCGA, The Cancer Genome Atlas.
Figure 2
Figure 2
DYRK1B suppresses PDAC cell proliferation. (A) Western blot depicting DYRK1B protein levels in parental mKpc4 cells (WT) and DYRK1BKO clones 5.3 (KO5.3) and 2.7 (KO2.7). Actin was used as a loading control. Shown is one representative blot of n=3. (B) Colony staining (crystal violet, blue) of Dyrk1b-WT and Dyrk1b-KO mKpc4 clones. Shown is one representative of n=6. (C) Relative cell number (%) of mKpc4 cells grown in clonal density. Mean of n=6±SD (one-tailed t-test). (D) The relative percentage of BrDU-positive Dyrk1b-WT/KO mKpc4 cells. Mean of n=3±SD. (E) The relative percentage of BrDU-positive mKpc4 cells treated with DMSO as a solvent or 1 µM AZ191 for 4 days. Mean of n=3±SD. (F) Relative cell number (%) of WT/KO mKpc4 cells treated with solvent (DMSO) or 0.2 µM KU0063794 or 0.2 µM Everolimus for 6 days. Mean of n=4–5±SD. (G) Colony stain (crystal violet, blue) of WT/KO mKpc4 cells treated with solvent DMSO or 0.2 µM KU0063794. Shown is one representative of n=5. (H) Transcriptome signatures (RNAseq) of KO mKpc4 cells in comparison to WT cells. (I) Relative mRNA expression of TGFβ-pathway genes in WT and KO mKpc4 cells as determined by quantitative reverse transcription-PCR. Shown is one representative of n=3, measured in triplicate (±SD). Asterisks indicate significance versus WT. (J) Representative phase-contrast images of WT/KO mKpc4 cells. The scale bar is 50 µm. BrDU, bromodeoxyuridine; DMSO, dimethyl sulfoxide; DYRK1B, dual specificity and tyrosine phosphorylation-regulated kinase 1B; KO, knockout; mRNA, messenger RNA; PDAC, pancreatic ductal adenocarcinoma; TGFβ, transforming growth factor beta; WT, wild-type.
Figure 3
Figure 3
Ablation of tumour cell-Dyrk1b stimulates macrophage recruitment and inhibits in vivo tumour growth. (A) Scheme outlining the allograft experiment. (B) Tumour size changes over time (subcutaneous allograft growth in C57BL/6 mice). Animals received either Dyrk1b-WT (black curve) or KO (clone 5.3; red curve) mKpc4 cells (n=12 each) on day 0. Shown is the mean±SEM. (C) Gene signatures (RNAseq) upregulated in the KO allograft (vs WT). (D) Representative histology of resulting tumours from B. The upper panel depicts H&E; other panels depict staining with corresponding antibodies (scale bar 150 µm in all panels). (E–I) Quantification of IHC staining intensity of slides from panel D. Each dot represents one tumour (relative IHC intensity, mean of n=4–5 ± SD (one-tailed t-test). (J) Immunofluorescent staining of allografted tumours. The scale bar is 30 µm. (K) Flow-cytometric quantification of F4/80-MHCII double-positive (M1) TAMs from tumours in panel B. Each dot represents one tumour (mean±SD). (L) Flow-cytometric quantification of F4/80-CD206 double-positive (M2) TAMs from tumours in panel B. Each dot represents one tumour (mean±SD). (M) IHC of tumours from panel B. Arrows depict individual T cells. The scale bar is 100 µm. (N–S) Flow-cytometric quantification of T cell subtypes in WT/KO5.3 tumours. Each dot represents one tumour (mean±SD). DYRK1B, dual specificity and tyrosine phosphorylation-regulated kinase 1B; IHC, immunohistochemistry; KO, knockout; MHCII, major histocompatibility complex class II; PDAC, pancreatic ductal adenocarcinoma; TAM, tumour-associated macrophages; WT, wild-type.
Figure 4
Figure 4
Dyrk1b-controlled cancer cell physiology acts on several aspects of Mph functions. (A) Scheme depicting the experiments to analyse the impact of the tumour cell secretome on Mphs. (B) Transcriptome signatures (RNAseq) of upregulated genes in Mphs after exposure to KO5.3 SN from mKpc4 cells. (C) Transcriptome signatures (RNAseq) of downregulated genes in Mphs after exposure to KO5.3 SN from mKpc4 cells. (D) Changes in expression of individual Mph genes (RNAseq) upon treatment with the indicated SN. (E–G) Relative mRNA expression determined by qRT-PCR of M1-like and M2-like genes in mouse BMDM (either untreated or stimulated with SN collected from WT mKPC4 cells previously treated with DMSO as a solvent or with 1 µM AZ191 for 4 days. Shown is one representative of n=3–7, measured in triplicate (mean±SD). (H) Absolute BMDM cell number left untreated (naive) or stimulated with conditioned media collected from WT/KO mKpc4 cells. Shown is one representative of n=3, measured in triplicate (mean±SD). (I) Migration over 16 hours of BMDM towards plain 0.5% containing medium (no SN) or medium containing 50% of SN from WT or KO mKpc4 cells. Mean of n=3±SD. (J) Graphical outline of the phagocytosis assay. BMDMs were labelled in green and tumour cells in red. Phagocytic Mphs were identified as double-positive cells. (K) The relative capability of BMDM to phagocytose WT or KO mKpc4 cells (calculated as a percentage of double-positive Mphs). Mean of n=4±SD. (L) The relative capability of BMDM to phagocytose WT mKpc4 cells. Before the phagocytosis assay, BMDM were primed with SN from WT or KO mKpc4 cells for 24 hours. Mean of n=5±SD. (M) Experimental scheme for crosstalk between cancer cells, Mphs and PSCs (mPSC4). (N–O) Relative mRNA expression determined by qRT-PCR of inflammatory (iCAF) and myofibroblastic (myCAF) cancer-associated fibroblast (CAF) marker genes in mPSC4 cells either left untreated (qPSC) or treated with SN from BMDM stimulated with SN from WT or KO5.3 mKpc4 cells. Shown is one representative of n=4, measured in triplicate (mean±SD). BMDM, bone-marrow-derived macrophages; DMSO, dimethyl sulfoxide; DYRK1B, dual specificity and tyrosine phosphorylation-regulated kinase 1B; KO, knockout; Mphs, macrophages; PSC, pancreatic stellate cells; qPSC, quiescent PSC; qRT-PCR, quantitative reverse transcription PCR; SN, supernatant; WT, wild-type.
Figure 5
Figure 5
DYRK1B-dependent cancer cell impact on macrophage physiology. (A) Mouse cytokine array membranes incubated with SN from WT/KO mKpc4 cells. Cytokines and chemokines downregulated or upregulated in Dyrk1b-KO clone 5.3 (vs WT) are highlighted in red and green, respectively. (B) Quantification of the results depicted in A (duplicate spots). (C) Migration index of BMDM towards SN collected from WT mKpc4 cells plus either no antibody (control) or supplemented with neutralising antibodies against the indicated chemokines. Shown is the mean of one representative of n=3, measured in triplicate wells (±SD). (D) The volcano plot of proteins differentially secreted by WT or KO5.3 mKpc4 cells was detected by mass spectrometry-based proteomics. Proteins upregulated or downregulated in Dyrk1b-KO are highlighted in green and red, respectively. Modelled effect sizes and nominal p values are plotted, while luminosity maps to false discovery rate-corrected p values <0.05 (n=3). (E) Relative mRNA expression was determined by qRT-PCR of M1-like and M2-like marker genes in untreated BMDM (control) or in BMDM treated with 100 ng/mL recombinant Sema3E. Shown is one representative of n=2, measured in triplicate (mean±SD). (F) Western blot depicting endogenous CD24 protein levels in WT/KO mKpc4 cells. Actin was used as a loading control. Shown is one representative blot of n=2. (G) Relative MFI of surface CD24 on WT/KO mKpc4 cells. Mean of n=3±SD. (H) The relative Cd24 mRNA expression as determined by qRT-PCR in WT/KO mKpc4 cells. Mean n=3±SD. (I) CD24 IHC of Dyrk1b WT/KO5.3 allograft tumour tissue. The scale bar is 100 µm. (J) Quantification of results from panel I. Each dot represents one tumour (mean±SD). (K) Western blot depicting CD24 protein level in parental Panc1 cells (WT) and DYRK1B-knockdown clones #9 and #7. Actin was used as a loading control. Shown is one representative blot of n=2. (L) Relative MFI of surface CD24 on parental Panc1 cells (WT) and DYRK1B-knockdown clones #7 and #9. Mean of n=3±SD. BMDM, bone-marrow-derived macrophages; DMSO, dimethyl sulfoxide; DYRK1B, dual specificity and tyrosine phosphorylation-regulated kinase 1B; KO, knockout; MFI, mean fluorescence intensity; Mphs, macrophages; PSC, pancreatic stellate cells; qPSC, quiescent PSC; qRT-PCR, quantitative reverse transcription PCR; SN, supernatant; WT, wild-type.
Figure 6
Figure 6
A DYRK1B-directed therapy extends survival in an autochthonous mouse model of PDAC. (A) Schematic outline of the treatment of KPC mice with drugs. Triple-mutant (LSL-KrasG12D/+, LSL-Trp53R172H/+ and Pdx1-Cre) animals underwent weekly palpation to identify tumour initiation. When a tumour reached 100–150 mm3, mice were treated with gemcitabine (Gem; 70 mg/kg; once a week), AZ191 (DYRK1Bi; 5 mg/kg; two times per week) and KU0063794 (mTORi; 5 mg/kg; two times per week) according to the scheme. (B) Body weight change of KPC mice undergoing triple therapy (Gem/AZ/KU). Each line represents one animal. (C) Early changes in body weight in the control (vehicle), Gem and triple regimen arms. The first treatment was given on day 0. Each dot represents one animal (mean±SD). (D) Change in tumour size of KPC mice treated with vehicle (solvent; black lines) or triple therapy (red lines). Each line represents one animal. (E) Kaplan-Meier overall survival curve of KPC mice treated with vehicle (black line, n=13) or with triple therapy (red line, n=14) (log-rank test). (F) CD24 IHC of tumours after a 14-day solvent/triple therapy. The scale bar is 100 µm. (G) Representative F4/80 IHC staining of KPC tumours receiving 14 days of the vehicle or triple treatment. The scale bar is 100 µm. (H) Quantification of F4/80 staining intensity as shown in G. Each dot represents one tumour (mean of n=6±SD). (I) Kaplan-Meier overall survival curve of KPC mice treated with triple therapy. Black line: non-responders (n=6); red line: responders (n=8) (log-rank test). (J) F4/80 IHC at endpoint in control animals and in triple therapy responders/non-responders. The scale bar is 100 µm. (K) Quantification of F4/80 IHC as depicted in panel J (mean±SD; one-tailed t-test). DYRK1B, dual specificity and tyrosine phosphorylation-regulated kinase 1B; IHC, immunohistochemistry; PDAC, pancreatic ductal adenocarcinoma.
Figure 7
Figure 7
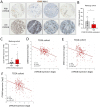
Intratumoral macrophage abundance correlates with DYRK1B levels in human PDAC. (A) Immunohistochemical CD68 staining (brown) of human PDAC tissue microarrays (Marburg cohort). DYRK1B levels were determined by bulk RNAseq. (B) Quantification of CD68 immunohistochemistry intensity in patients with PDAC, which were split into DYRK1B-low and high subgroups (n=15 each). Each dot represents one patient tumour (mean±SD). (C) CD24 mRNA levels in patients with PDAC as assessed by bulk RNA sequencing. Patients were split into DYRK1B-low/high subgroups (n=15 each). Each dot represents one patient tumour (mean±SD). (D) Correlation between CD68 and DYRK1B bulk mRNA expression in patients with PDAC of the TCGA cohort. (E) Correlation between MSR1 and DYRK1B bulk mRNA expression in patients with PDAC of the TCGA cohort. (F) Correlation between ITGAM (encoding CD11B) and DYRK1B bulk mRNA expression in patients with PDAC of the TCGA cohort. DYRK1B, dual specificity and tyrosine phosphorylation-regulated kinase 1B; PDAC, pancreatic ductal adenocarcinoma; mRNA, messenger RNA; TCGA, The Cancer Genome Atlas.

References

    1. Siegel RL, Miller KD, Wagle NS, et al. . Cancer statistics, 2023. CA Cancer J Clin 2023;73:17–48. 10.3322/caac.21763 - DOI - PubMed
    1. Beatty GL, Werba G, Lyssiotis CA, et al. . The biological underpinnings of therapeutic resistance in Pancreatic cancer. Genes Dev 2021;35:940–62. 10.1101/gad.348523.121 - DOI - PMC - PubMed
    1. Rahib L, Smith BD, Aizenberg R, et al. . Projecting cancer incidence and deaths to 2030: the unexpected burden of thyroid, liver, and Pancreas cancers in the United States. Cancer Res 2014;74:2913–21. 10.1158/0008-5472.CAN-14-0155 - DOI - PubMed
    1. Bärthel S, Falcomatà C, Rad R, et al. . Single-cell profiling to explore Pancreatic cancer heterogeneity, plasticity and response to therapy. Nat Cancer 2023;4:454–67. 10.1038/s43018-023-00526-x - DOI - PMC - PubMed
    1. Bear AS, Vonderheide RH, O’Hara MH. Challenges and opportunities for Pancreatic cancer Immunotherapy. Cancer Cell 2020;38:788–802. 10.1016/j.ccell.2020.08.004 - DOI - PMC - PubMed

MeSH terms