. 2024 Jun 4;15(1):4756.
doi: 10.1038/s41467-024-48846-5.

Downregulation of rhodopsin is an effective therapeutic strategy in ameliorating peripherin-2-associated inherited retinal disorders

Affiliations

Downregulation of rhodopsin is an effective therapeutic strategy in ameliorating peripherin-2-associated inherited retinal disorders

Christian T Rutan Woods et al. Nat Commun. .

Erratum in

Abstract

Given the absence of approved treatments for pathogenic variants in Peripherin-2 (PRPH2), it is imperative to identify a universally effective therapeutic target for PRPH2 pathogenic variants. To test the hypothesis that formation of the elongated discs in presence of PRPH2 pathogenic variants is due to the presence of the full complement of rhodopsin in absence of the required amounts of functional PRPH2. Here we demonstrate the therapeutic potential of reducing rhodopsin levels in ameliorating disease phenotype in knockin models for p.Lys154del (c.458-460del) and p.Tyr141Cys (c.422 A > G) in PRPH2. Reducing rhodopsin levels improves physiological function, mitigates the severity of disc abnormalities, and decreases retinal gliosis. Additionally, intravitreal injections of a rhodopsin-specific antisense oligonucleotide successfully enhance the physiological function of photoreceptors and improves the ultrastructure of discs in mutant mice. Presented findings shows that reducing rhodopsin levels is an effective therapeutic strategy for the treatment of inherited retinal degeneration associated with PRPH2 pathogenic variants.


Conflict of interest statement

The authors declare no competing interests.

Figures

Fig. 1
Fig. 1. Improved rod and cone functions in Prph2Y141C/+ and Prph2K153∆/+ mice following partial ablation of Rho.
Representative scotopic (A) and photopic (B) ERG waveforms at P30 from all genotypes. CF Mean maximum amplitudes of scotopic a-waves and b-waves, as well as photopic b-waves, plotted as mean ± SD at P17, P30, and P90. P < 0.05, ∗∗P < 0.01, ∗∗∗P < 0.001, ∗∗∗∗P < 0.0001 by one-way ANOVA with Tukey’s post-hoc comparison (see Table S3 for corresponding p values). N = 9-15 animals/genotype/age. *denotes comparisons between (C, D) Prph2Y141C/+ and Prph2Y141C/+/Rho+/- or (E, F) Prph2K153∆/+ and Prph2K153∆/+/Rho+/-.
Fig. 2
Fig. 2. Partial ablation of RHO does not affect ONL thickness in Prph2K153∆/+ or Prph2Y141C/+.
A Representative images of H&E stained retinal sections at P30 and P90. B, C Nuclei counts were performed in 100 µm width windows in retinal sections taken from the indicated genotypes. Images were captured every 500 µm starting at the optic nerve head sections, and nuclei counts from multiple regions were plotted as mean ± SD for the listed genotypes (n = 3 for each genotype). P < 0.05, ∗∗P < 0.01, ∗∗∗P < 0.001 by two-way ANOVA (P30 Prph2Y141C/+: Interaction P = 0.8626, Row Factor P < 0.0001, and Column Factor P < 0.0001. P90 Prph2Y141C/+: Interaction P = 0.0001, Row Factor P < 0.0001, and Column Factor P < 0.0001. P30 Prph2K153∆/+: Interaction P = 0.0026, Row Factor P < 0.0001, and Column Factor P < 0.0001. P90 Prph2K153∆/+: Interaction P < 0.0001, Row Factor P < 0.0001, and Column Factor P < 0.0001.) with Tukey’s post-hoc comparison. *denotes comparisons between (B) Prph2Y141C/+ or (C) Prph2K153∆/+and (B) Prph2Y141C/+/Rho+/- or (C) Prph2K153∆/+/Rho+/-. Scale bar corresponds to 100 µm.
Fig. 3
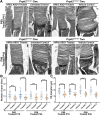
Fig. 3. Prph2Y141C/+/Rho+/- and Prph2K153∆/+/Rho+/- exhibit improved OS morphogenesis and ultrastructure compared to their respective controls.
A Representative TEM images at low and high-magnification of tannic acid/uranyl acetate-stained retinas from WT, Rho+/-, Prph2Y141C/+, Prph2Y141C/+/Rho+/-, Prph2K153∆/+, and Prph2K153∆/+/Rho+/- at P16. B Quantification of open discs at the base of the OS in the listed genotypes at P16, utilizing data from a previous publication for WT and Prph2Y141C/+ open discs. C Quantification of OS diameters measured in the listed genotypes at P16, with each data point representing a single outer segment. P < 0.05, ∗∗P < 0.01, ∗∗∗P < 0.001, ∗∗∗∗P < 0.0001 by one-way ANOVA (P < 0.0001 for both open disc and OS diameter) with Tukey’s post-hoc comparison. Arrowheads highlight misaligned, overgrown, and sagittally aligned discs, as well as whorl-like structures commonly observed in Prph2Y141C/+ and Prph2K153∆/+ ROSs. N (number of independent eyes used for analyses) values for (B): WT: 111, Rho+/-: 112; Prph2Y141C/+: 152; Prph2Y141C/+/Rho+/-: 105; Prph2K153∆/+: 98, Prph2K153∆/+/Rho+/-: 43 and for C: WT: 86, Rho+/-: 138, Prph2Y141C/+: 80, Prph2Y141C/+/Rho+/-: 139, Prph2K153∆/+: 63, Prph2K153∆/+/Rho+/-: 90. Scale bar, 1 µm. Error bars represent mean ± SD.
Fig. 4
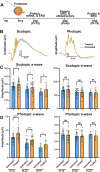
Fig. 4. Early-stage intervention with mRho ASO1 mitigates functional decline in Prph2Y141C/+ mice.
A Schematic representation of the design for early-stage preclinical intervention studies. Created with BioRender.com released under a Creative Commons Attribution-Non-commercial-NoDervis 4.0 International license. B Representative waveforms of scotopic and photopic responses recorded 15 days after injection at P30. Mean ± SD maximum amplitudes of scotopic a-waves and scotopic b-wave (C) and photopic a-wave and b-wave amplitudes (D) of treated (3.125 µg mRho ASO1) and untreated contralateral control eyes recorded in preclinical early injection studies at ages P30, P60, and P90. P < 0.05, ∗∗P < 0.01, ∗∗∗P < 0.001 by Mann-Whitney U test (PI-15: N = 51, PI-45: N = 34, and PI-75: N = 18).
Fig. 5
Fig. 5. Late-stage intervention with mRho ASO1 preserves functional performance in Prph2Y141C/+ mice.
A Design of late-stage preclinical intervention studies. Created with BioRender.com released under a Creative Commons Attribution-Non-commercial-NoDervis 4.0 International license. B Representative scotopic and photopic waveforms recorded at 15- and 45-days post injections at P45. C, D Mean maximum amplitudes of scotopic a-waves and b-waves, as well as photopic a-waves and b-waves were plotted as mean ± SD for treated eyes (6.25 µg mRho ASO1) and vehicle control contralateral eyes in the late-stage intervention studies conducted at P60 and P90. P < 0.05, ∗∗P < 0.01, ∗∗∗P < 0.001, ∗∗∗∗P < 0.0001 by Mann-Whitney U test (PI-45: N = 38 and PI-75: N = 18).
Fig. 6
Fig. 6. Treatment with mRho ASO1 effectively reduced protein and transcript levels in Prph2Y141C/+ mice.
Quantification of (A) RHO and (B) PRPH2 in retinal extracts at P30, P60, and P90 after injections with mRho ASO1 at P15 (3.125 µg mRho ASO1). C Graphs depicting the ratio of RHO to PRPH2 following P15 injection, determined by dividing the RHO signal intensity value by that of PRPH2. Quantification of (D) RHO and (E) PRPH2 in retinal extracts at P60 and P90 after injections with mRho ASO1 at P45 (6.25 µg mRho ASO1). F Graphs illustrating the ratio of RHO to PRPH2 following P45 injections. G–I Transcript levels assessed by qRT-PCR 15 days post injection at either P15 or P45. Quantification of (G) Rho and (H) Prph2 mRNA transcript levels relative to Gapdh for P15 and P45 injected samples. I Quantification of Rho mRNA transcript levels relative to Prph2 for P15 and P45 injected samples. Data are presented as mean ± SD. P < 0.05, ∗∗P < 0.01, ∗∗∗P < 0.001, ∗∗∗∗P < 0.0001 as determined by student t-test analysis. N = 3-5 retinas per treatment condition.
Fig. 7
Fig. 7. Early-stage treatment with mRho ASO1 successfully delays ONL thinning in Prph2Y141C/+ mice.
A Representative images of retinal sections stained with H&E at P90. BD Nuclear counts from 100 µm-windows at every 500 µm distance from the optic nerve and across the superior-inferior plane of retinal sections collected from P90 un-injected, 1X PBS injected as a control and mRho ASO1 injected animals following (B) early (P15) or (C) late-stage (P45) therapeutic intervention. B, C WT and Prph2Y141C/+ controls were added for comparison. B, C P < 0.05, ∗∗P < 0.01, ∗∗∗P < 0.001 by two-way ANOVA (P15 Injected: Interaction P < 0.0001, Row Factor P < 0.0001, and Column Factor P < 0.0001. P45 Injected: Interaction P < 0.0001, Row Factor P < 0.0001, and Column Factor P < 0.0001. P15 vs. P45 Injected: Interaction P < 0.0001, Row Factor P < 0.0001, and Column Factor P < 0.0001.) with Tukey’s post-hoc comparison. *denotes comparisons between Prph2Y141C/+ and (B) Prph2Y141C/+ 3.125 µg ASO or (C) Prph2Y141C/+ 6.25 µg ASO. #denotes comparisons between (B) Prph2Y141C/+ 3.125 µg ASO and P15 injected Prph2Y141C/+ 1X PBS. D Plotted are mean ± SD values from (B) and (C) for WT, Prph2Y141C/+ P15 Injected 3.125 µg ASO, and P45 injected 6.25 µg ASO Prph2Y141C/+ for ease of comparison. + denotes comparisons P15 injected and P45 injected. N = 3 animals for all genotypes and experimental conditions. Scale bar corresponds to 50 µm.
Fig. 8
Fig. 8. Injection of mRho ASO1 led to significant improvements in the morphogenesis and ultrastructure of OSs in Prph2Y141C/+ mice.
A Representative high-magnification TEM images of tannic acid/uranyl acetate-stained retinas taken from P90 mRho ASO1 treated and contralateral control eyes that were injected at P15 (3.125 µg mRho ASO1) and P45 (6.25 µg mRho ASO1). Quantification of open discs at the base of the OS (B) and OS diameters (C) in mRho ASO1 injected and contralateral control eyes 45 days after treatment. Each data point represents a single OS. P < 0.05, ∗∗P < 0.01, ∗∗∗P < 0.001, ∗∗∗∗P < 0.0001 by one-way ANOVA (P < 0.0001 for both open discs and OS diameter) with Tukey’s post-hoc comparison. N = 50 OSs per each sample for (B) and (C). Scale bar, 1 µm. Error bars represent mean ± SD.

References

    1. Nuzbrokh, Y., Ragi, S. D. & Tsang, S. H. Gene therapy for inherited retinal diseases. Ann. Transl. Med.9, 1278 (2021). 10.21037/atm-20-4726 - DOI - PMC - PubMed
    1. Georgiou, M., Fujinami, K. & Michaelides, M. Inherited retinal diseases: Therapeutics, clinical trials and end points-A review. Clin. Exp. Ophthalmol.49, 270–288 (2021). 10.1111/ceo.13917 - DOI - PubMed
    1. Sanjurjo-Soriano, C. & Kalatzis, V. Guiding lights in genome editing for inherited retinal disorders: implications for gene and cell therapy. Neural plasticity2018, 5056279 (2018). 10.1155/2018/5056279 - DOI - PMC - PubMed
    1. Nuzbrokh, Y., Kassotis, A. S., Ragi, S. D., Jauregui, R. & Tsang, S. H. Treatment-emergent adverse events in gene therapy trials for inherited retinal diseases: a narrative review. Ophthalmol. Ther.9, 709–724 (2020). 10.1007/s40123-020-00287-1 - DOI - PMC - PubMed
    1. Conley, S. M. et al. Delineating the clinical phenotype of patients with the c.629C>G, p.Pro210Arg mutation in peripherin-2. Investig. Ophthalmol. Vis. Sci.63, 19 (2022).10.1167/iovs.63.8.19 - DOI - PMC - PubMed

MeSH terms

LinkOut - more resources