. 2024 Jun 4;15(1):4764.
doi: 10.1038/s41467-024-48560-2.

Bacteriophage defends murine gut from Escherichia coli invasion via mucosal adherence

Affiliations

Bacteriophage defends murine gut from Escherichia coli invasion via mucosal adherence

Jiaoling Wu et al. Nat Commun. .

Abstract

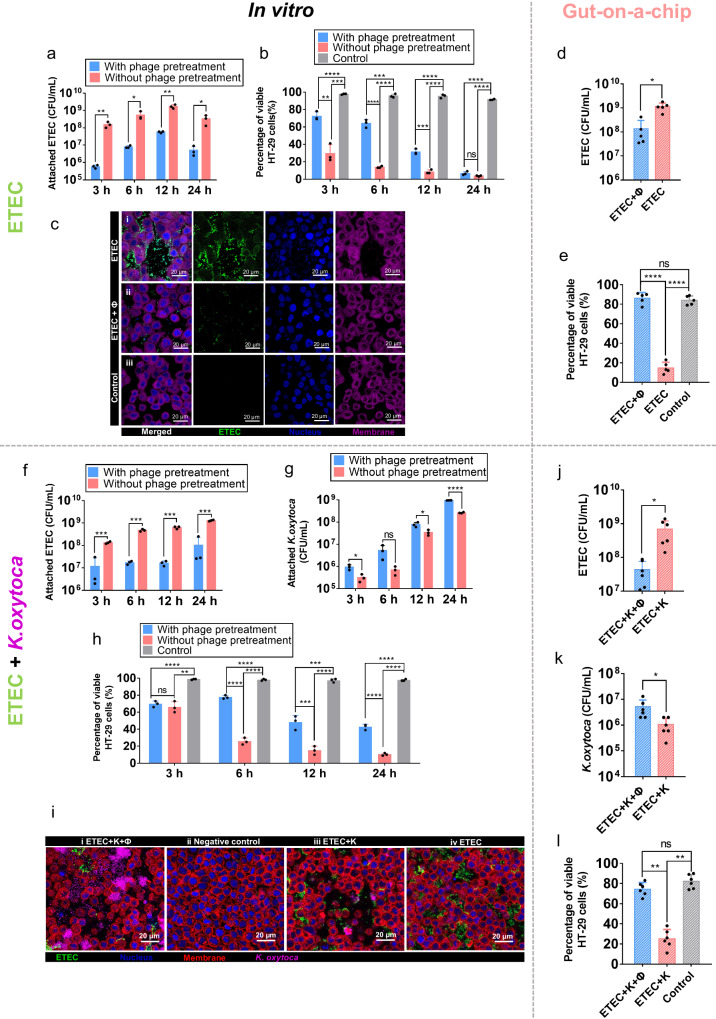
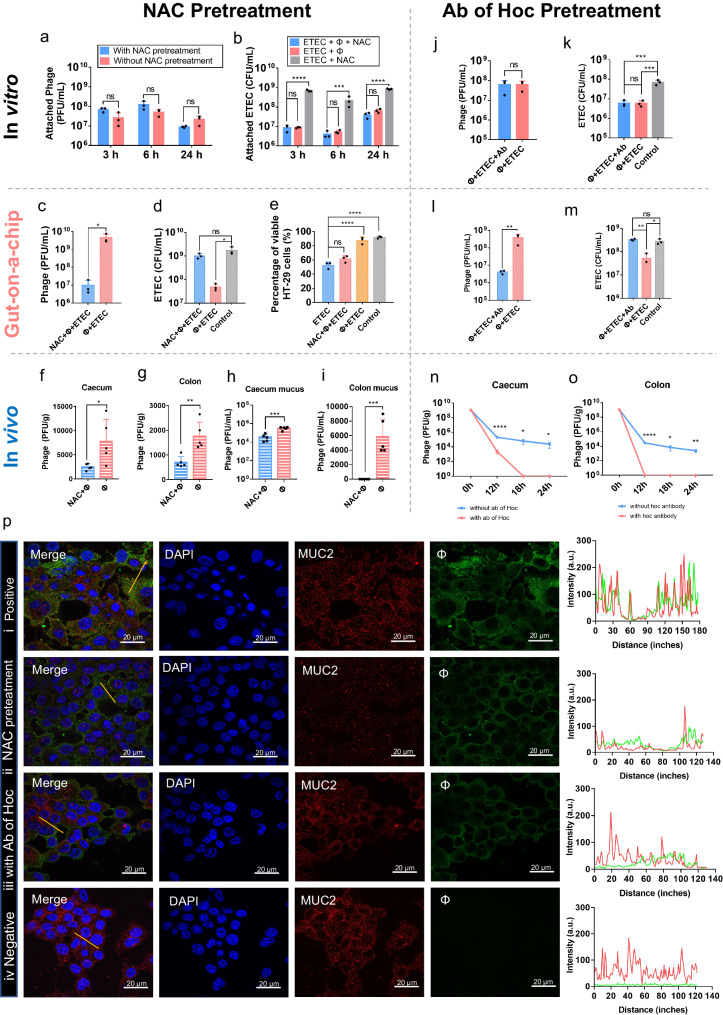
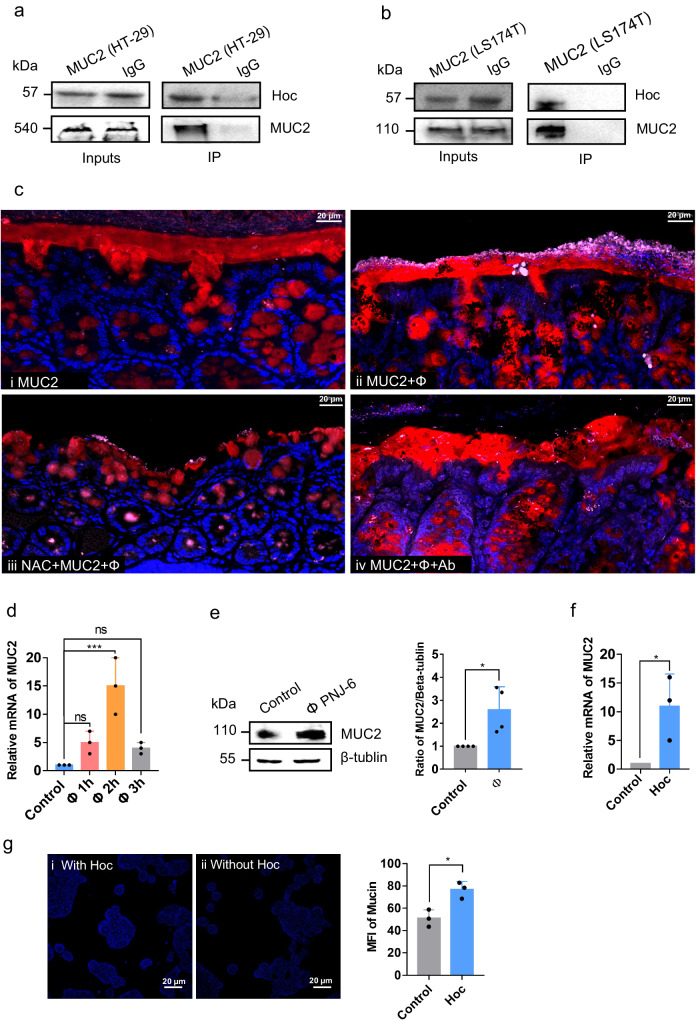
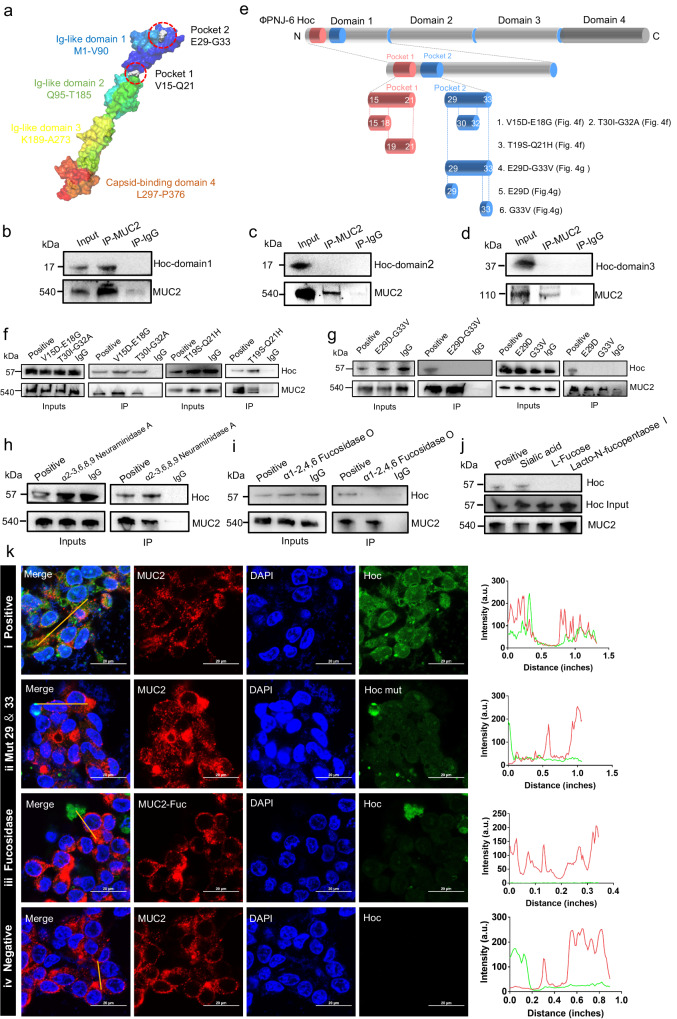
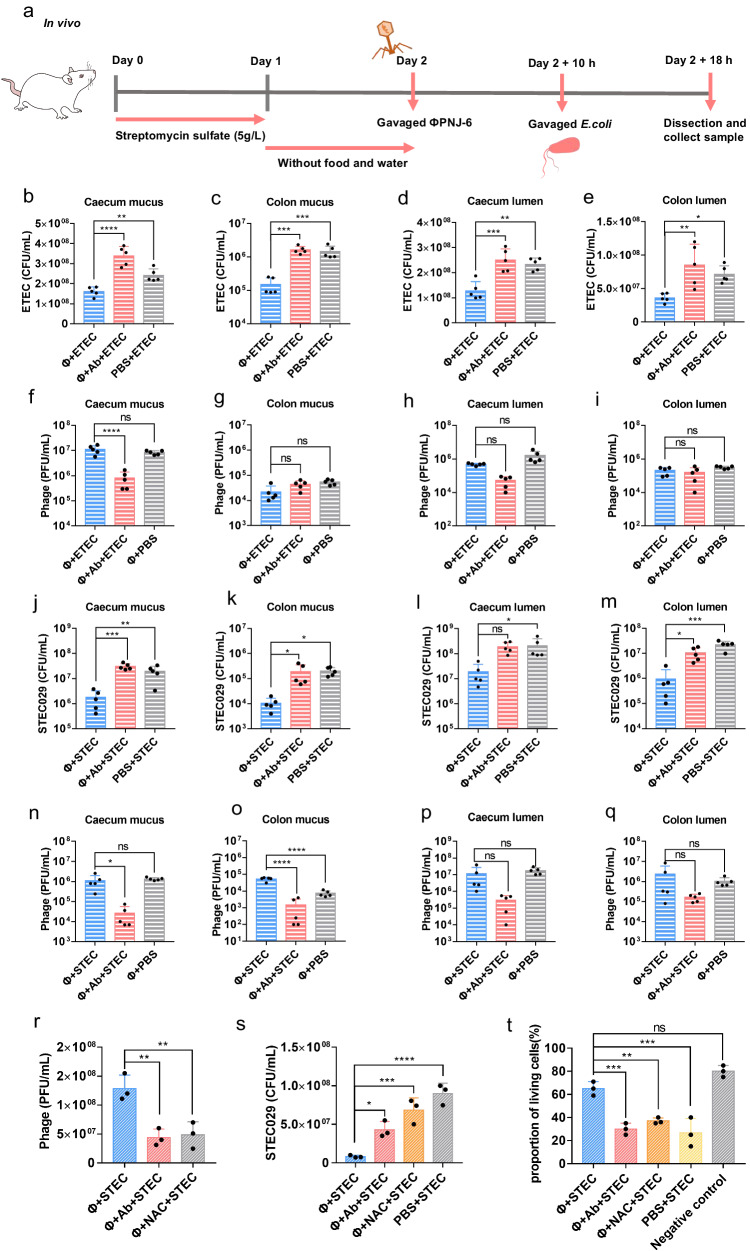
Bacteriophage are sophisticated cellular parasites that can not only parasitize bacteria but are increasingly recognized for their direct interactions with mammalian hosts. Phage adherence to mucus is known to mediate enhanced antimicrobial effects in vitro. However, little is known about the therapeutic efficacy of mucus-adherent phages in vivo. Here, using a combination of in vitro gastrointestinal cell lines, a gut-on-a-chip microfluidic model, and an in vivo murine gut model, we demonstrated that a E. coli phage, øPNJ-6, provided enhanced gastrointestinal persistence and antimicrobial effects. øPNJ-6 bound fucose residues, of the gut secreted glycoprotein MUC2, through domain 1 of its Hoc protein, which led to increased intestinal mucus production that was suggestive of a positive feedback loop mediated by the mucus-adherent phage. These findings extend the Bacteriophage Adherence to Mucus model into phage therapy, demonstrating that øPNJ-6 displays enhanced persistence within the murine gut, leading to targeted depletion of intestinal pathogenic bacteria.


Conflict of interest statement

The authors declare no competing interests.

Figures

Fig. 1
Fig. 1. Phage øPNJ-6 protects HT-29 cells from ETEC invasion.
In vitro model with ETEC: the number of ETEC attached to HT-29 cells (a), the proportion of live HT-29 cells in the phage pre-treatment or phage-free group (b), at different time points (3 h, 6 h, 12 h, and 24 h). c Fluorescence microscope photograph of HT-29 cells with different treatments in vitro. Green indicates ETEC, red indicates the cell membrane and blue indicates the nucleus. (c-i) ETEC was incubated with HT-29 cells for 3 h without prior phage treatment (×100); (c-ii) HT-29 cells were pre-treated with øPNJ-6, followed by incubated with ETEC for 3 h (×100); (c-iii) HT-29 cells were cultured without ETEC or øPNJ-6 treatment (×100). Scale bars, 20 μm. Gut-on-a-chip model with ETEC: (d) the number of ETEC in the phage-pretreated and phage-free treatment groups; (e) the cell survival in the presence or absence of phage pre-treatment. In vitro model with ETEC and K.oxytoca: the number of ETEC (f) and K.oxytoca (g) adhering to HT-29 cells, and the proportion of live HT-29 cells in the phage pre-treatment or phage-free group (h), at different time points (3 h, 6 h, 12 h, and 24 h). i Fluorescence microscope photograph of the competitive assay. Green indicates ETEC, purple represents K.oxytoca, red indicates the cell membrane and blue indicates nucleus; (i-i) ETEC and K. oxytoca were added to the cells and incubated for 3 h after phage treatment (× 63); (i-ii) HT-29 cells were not infected with any phage or bacteria (× 63); (i-iii) ETEC and K. oxytoca were added to the HT-29 cells and incubated for 3 h without phage (× 63); (i-iv) HT-29 cells were incubated with ETEC for 3 h (×63). Scale bars, 20 μm. Gut-on-a-chip model with ETEC and K.oxytoca: the number of ETEC (j), K.oxytoca (k), and the proportion of live HT-29 cells (l) in the gut-on-a-chip at 24 h. Data are presented as mean values  ±  SD (n  =  3 biologically independent experiments) and P-values are calculated by Multiple t test one per row (*P ≤ 0.05; **P ≤ 0.01; ***P ≤ 0.001; ****P ≤ 0.0001). Source data are provided as a Source Data file.
Fig. 2
Fig. 2. Mucin and Hoc were involved in the interaction between øPNJ-6 and the intestinal tract.
NAC pre-treatment: The number of phage (a) and ETEC (b) attached to HT-29 cells with or without NAC or phage pre-treatment at different time points (3 h, 6 h, 24 h) in vitro. The number of phage (c) and ETEC (d) attached to HT-29 cells, and the proportion of live HT-29 cells (e) pre-treated with or without NAC or phage pre-treatment at 24 h in the gut-on-a-chip. The number of phage adhering to the caecum (f), colon (g), or the mucus layer of the caecum (h) and colon (i) of mice pre-treated with or without NAC in the mouse model. Hoc antibody treatment: the number of phage (j) and ETEC (k) attached to HT-29 cells pre-treated with phage or Hoc antibody blocked phage at 3 h in vitro. The number of phage (l) and ETEC (m) attached to HT-29 cells pre-treated with phage or Hoc antibody blocked phage at 24 h in the gut-on-a-chip. The number of phage adhering to the caecum (n) and colon (o) of mice pre-treated with phage or Hoc antibody blocked phage. p Fluorescence microscope photograph of the binding of øPNJ-6 to MUC2. (p-i) øPNJ-6 co-localized with MUC2 in the positive control group (×100); (p-ii) The number of øPNJ-6 adhering to MUC2 was decreased after NAC pretreatment (×100); (p-iii) The number of øPNJ-6 adhering to MUC2 was diminished after Hoc antibody blocking (×100); (p-iv) HT-29 cells in their natural state shown no presence of øPNJ-6 (×100). Red indicates MUC2, green indicates øPNJ-6, and blue indicates cell nucleus. Scale bars, 20 μm. Data are presented as mean values  ±  SD (n  =  3 independent experiments) and two-tailed P-values are calculated Multiple t test one per-row (*P ≤ 0.05; **P ≤ 0.01; ***P ≤ 0.001; ****P ≤ 0.0001). Source data are provided as a Source Data file.
Fig. 3
Fig. 3. Phage øPNJ-6 promotes mucin secretion from HT-29 cells.
Immunoprecipitation of Hoc protein interacting with MUC2 obtained from HT-29 cell lysates (a) or LS174T cells (b). c Immunofluorescence photograph of a section of mouse colon. The red color represents MUC2, blue DAPI indicates cell nucleus, and pink indicates phage øPNJ-6; (c-i) Normal mouse colon without any treatment (×60); (c-ii) Abundant phage adhered to the colon in mice without NAC treatment (×60); (c-iii) After NAC treatment, MUC2 in the mouse colon was significantly reduced, leading to a sharp decrease of phage adhering to the colon (×60); (c-iv) Phage was blocked by Hoc antibody, resulting in a significant decrease of phage adhering to the colon (×60). Scale bars, 20 μm. d mRNA transcriptional level of MUC2 in HT-29 cells when incubated with øPNJ-6 for 1, 2, 3 h. e Expression level of MUC2 in HT-29 cells when incubated with øPNJ-6 for 2 h; The bar represents gray value analysis of WB. f mRNA transcriptional level of MUC2 in HT-29 cells when incubated with Hoc protein for 2 h; (g) Fluorescence microscopy photograph of mucus expression in HT-29 cells was incubated with or without Hoc protein for 2 h. The blue color indicates mucus (×60); The bar represents Mean Fluorescence Intensity (MFI) of mucin; Data are presented as mean values  ±  SD P-values are calculated by One-way ANOVA (d) or unpair Student’s t test (eg) (n = 3 biologically independent experiments). To indicate significance, one symbol p < 0.05, two symbols p < 0.01, three symbols p < 0.001, four symbols p < 0.0001. Source data are provided as a Source Data file.
Fig. 4
Fig. 4. Interactions between glycan-binding pocket within the Hoc and fucose residues of MUC2.
a The structure of Hoc protein: contains four domains and two pockets in domain 1. CO-IP between MUC2 and domain 1 (b), domain 2 (c) or domain 3 (d) of Hoc protein. e Six mutants of Hoc were constructed in this study. (f) CO-IP between mutants V15D ~ E18G, T19S ~ Q21H or T30I ~ G32A of Hoc and MUC2. g CO-IP between mutants E29D ~ G33V, E29D or G33V of Hoc and MUC2. (h) CO-IP of Hoc and MUC2 treated with α2-3, 6, 8, 9 Neuraminidase A. i CO-IP of Hoc and MUC2 treated with α1-2, 4, 6 Fucosidase O. j CO-IP of Hoc pre-incubated with sialic acid, l-fucose, or lacto-N-fucopentaose I and MUC2. k Fluorescence microscope photograph of the binding of Hoc or mutant Hoc to MUC2. (k-i) Hoc of øPNJ-6 co-localized with MUC2 in the positive control group (×100); (k-ii) Mutant E29D and G33V of Hoc could not co-localize with MUC2 (×100); (k-iii) Hoc was unable to bind to MUC2 that was treated with α1-2, 4, 6 Fucosidase O (×100); (k-iv) LS174T cells in their natural state shown the absence of Hoc (×100). Red indicates MUC2, green indicates Hoc, and blue indicates cell nucleus. Scale bars, 20 μm. Source data are provided as a Source Data file.
Fig. 5
Fig. 5. Phage øPNJ-6 specifically lysed intestinal ETEC and STEC with the help of Hoc.
In the prevention assay with ETEC in vivo: (a) The scheme of prevention assay in mice; The image was created by Adobe Illustrator 2023 and PowerPoint. In the groups receiving pre-treated phage or Hoc antibody-blocked phage, the abundance of ETEC SH232 was assessed in the cecal (b) and colonic (c) mucus layers, as well as the ETEC SH232 counts in the luminal contents of the cecum (d) and colon (e) in mice. The phage levels were quantified in the cecal (f) and colonic (g) mucus layers, as well as the phage counts in the luminal contents of the cecum (h) and colon (i). In the prevention assay with SETC in vivo: The presence of STEC 029 in the mucus layer of the cecum (j) and colon (k), as well as the STEC 029 counts in luminal contents of the cecum (l) or colon (m). The phage numbers were quantified in the cecal (n) and colonic (o) mucus layers, and the phage counts in the luminal contents of the cecum (p) and colon (q). In the pump-paused model with STEC in the gut-on-a-chip: phage number (r), STEC number (s), and cell survival (t) in the control, Hoc antibody-coated or NAC treatment groups. Data are presented as mean values ±SD. n = 3 biologically independent experiments. P-values are calculated by Multiple t test one per-row. P-values are calculated by One-way ANOVA (*P ≤ 0.05; **P ≤ 0.01; ***P ≤ 0.001; ****P ≤ 0.0001). Source data are provided as a Source Data file.

Similar articles

Cited by

References

    1. De Sordi L, Lourenco M, Debarbieux L. “I will survive”: a tale of bacteriophage-bacteria coevolution in the gut. Gut Microbes. 2019;10:92–99. doi: 10.1080/19490976.2018.1474322. - DOI - PMC - PubMed
    1. Bergh O, Borsheim KY, Bratbak G, Heldal M. High abundance of viruses found in aquatic environments. Nature. 1989;340:467–468. doi: 10.1038/340467a0. - DOI - PubMed
    1. Rehman S, Ali Z, Khan M, Bostan N, Naseem S. The dawn of phage therapy. Rev. Med. Virol. 2019;29:e2041. doi: 10.1002/rmv.2041. - DOI - PubMed
    1. Khan Mirzaei M, et al. Bacteriophages isolated from stunted children can regulate gut bacterial communities in an age-specific manner. Cell Host Microbe. 2020;27:199–212.e195. doi: 10.1016/j.chom.2020.01.004. - DOI - PMC - PubMed
    1. Shkoporov AN, Hill C. Bacteriophages of the human gut: the “known unknown” of the microbiome. Cell Host Microbe. 2019;25:195–209. doi: 10.1016/j.chom.2019.01.017. - DOI - PubMed