. 2024 Jun 4;15(1):4757.
doi: 10.1038/s41467-024-48970-2.

Semaglutide ameliorates cardiac remodeling in male mice by optimizing energy substrate utilization through the Creb5/NR4a1 axis

Affiliations

Semaglutide ameliorates cardiac remodeling in male mice by optimizing energy substrate utilization through the Creb5/NR4a1 axis

Yu-Lan Ma et al. Nat Commun. .

Abstract

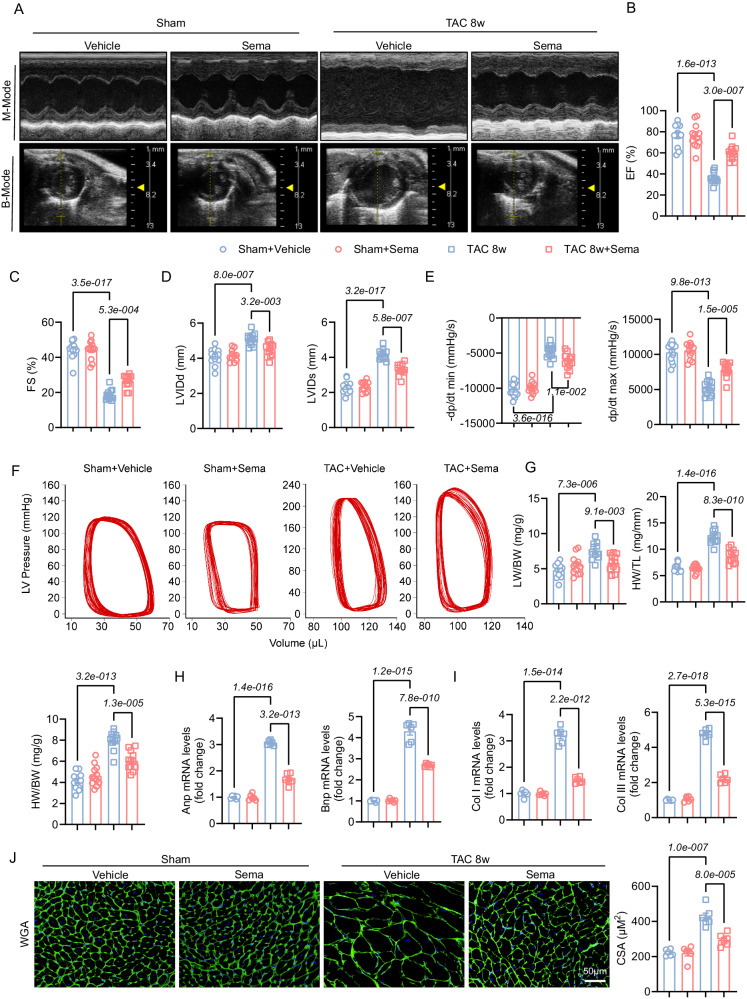
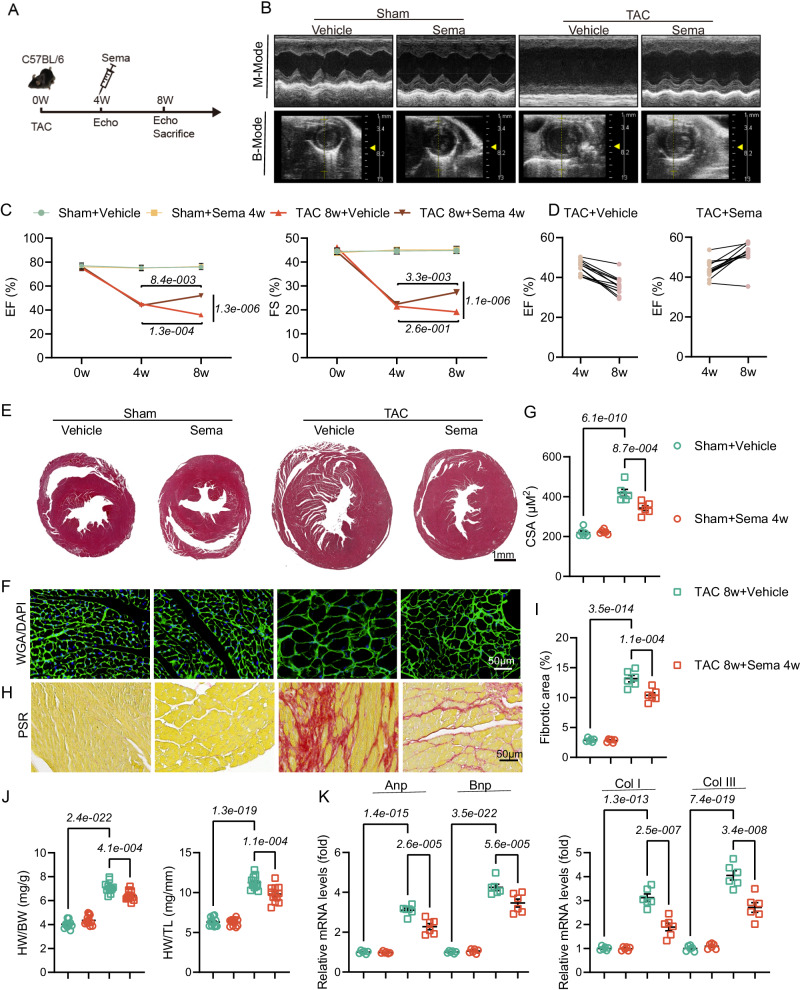
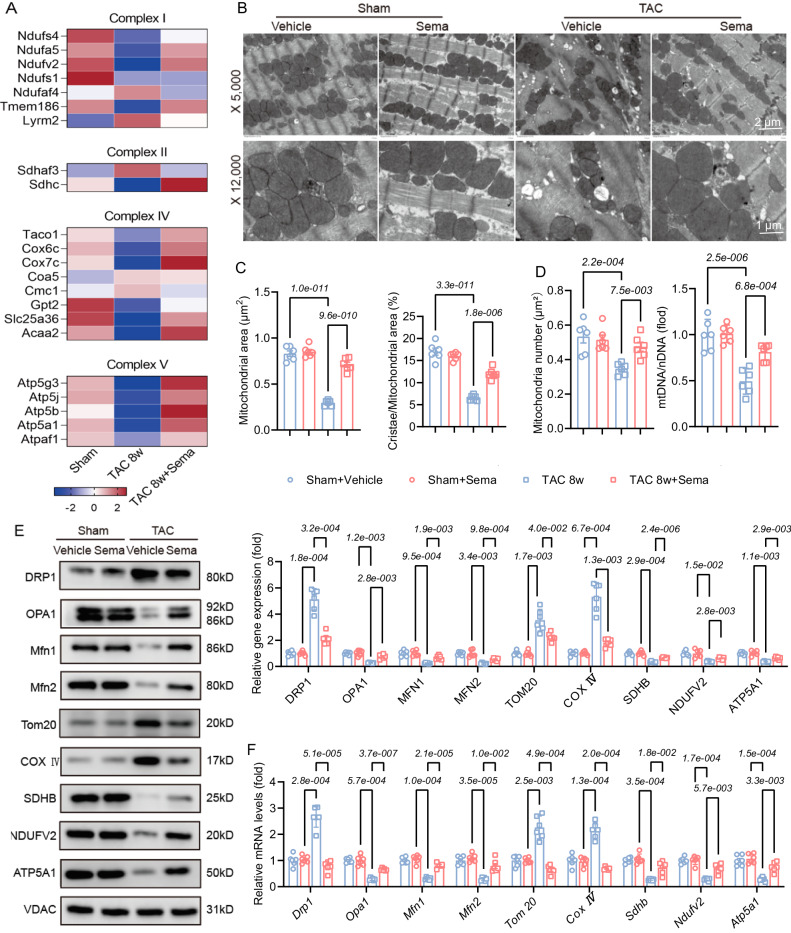
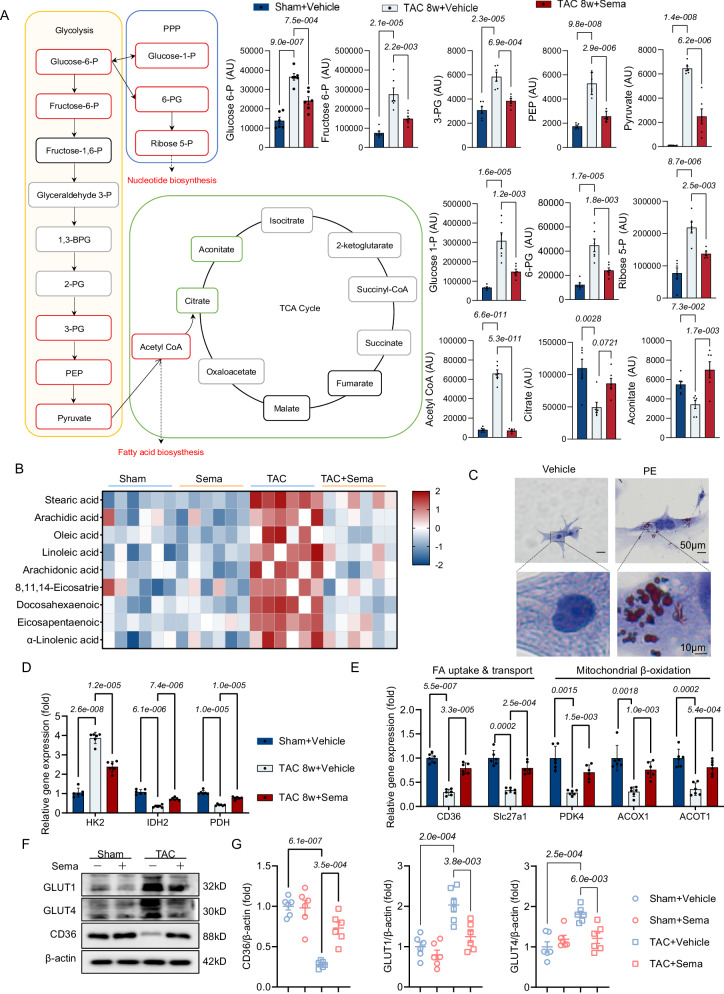
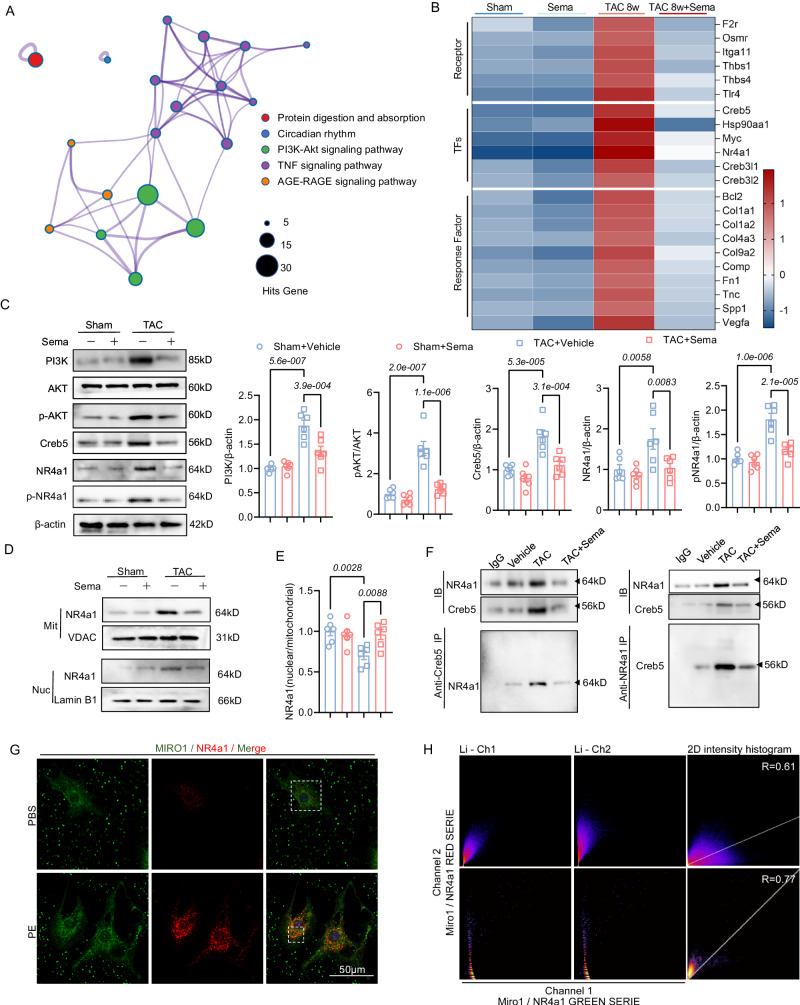
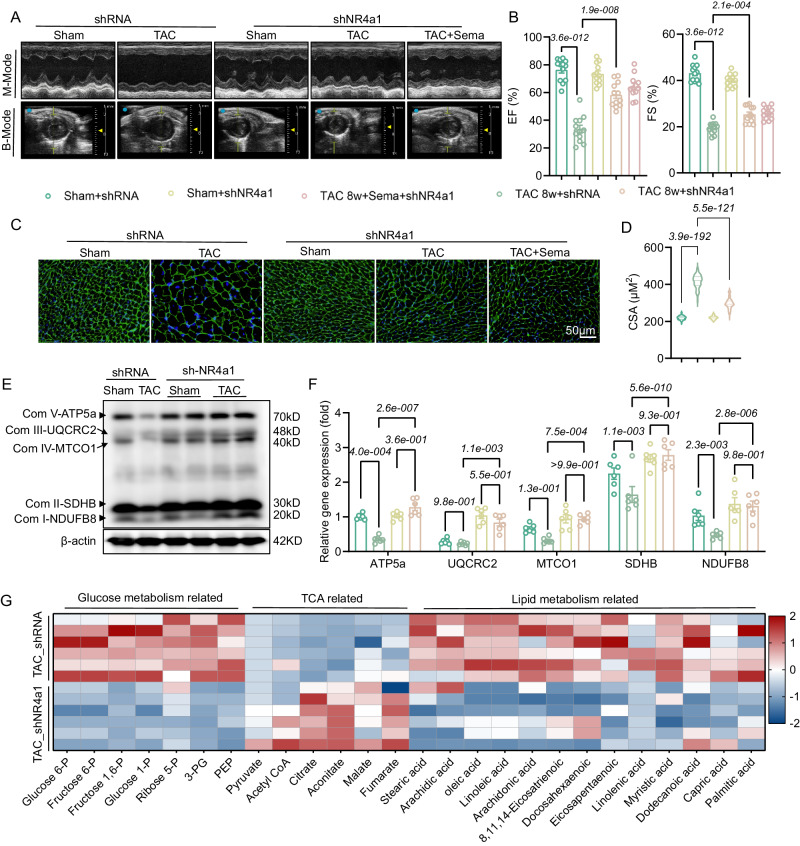
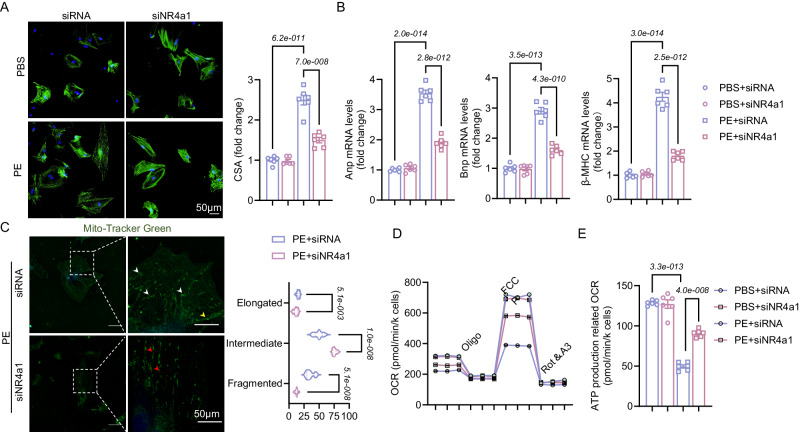
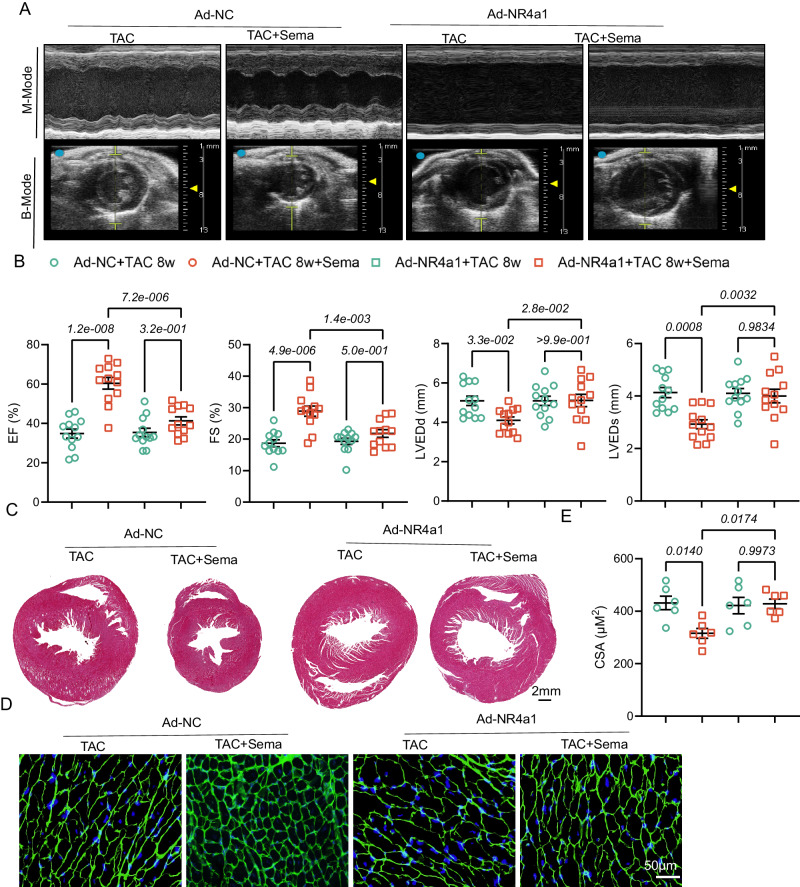
Semaglutide, a glucagon-like peptide-1 receptor agonist, is clinically used as a glucose-lowering and weight loss medication due to its effects on energy metabolism. In heart failure, energy production is impaired due to altered mitochondrial function and increased glycolysis. However, the impact of semaglutide on cardiomyocyte metabolism under pressure overload remains unclear. Here we demonstrate that semaglutide improves cardiac function and reduces hypertrophy and fibrosis in a mouse model of pressure overload-induced heart failure. Semaglutide preserves mitochondrial structure and function under chronic stress. Metabolomics reveals that semaglutide reduces mitochondrial damage, lipid accumulation, and ATP deficiency by promoting pyruvate entry into the tricarboxylic acid cycle and increasing fatty acid oxidation. Transcriptional analysis shows that semaglutide regulates myocardial energy metabolism through the Creb5/NR4a1 axis in the PI3K/AKT pathway, reducing NR4a1 expression and its translocation to mitochondria. NR4a1 knockdown ameliorates mitochondrial dysfunction and abnormal glucose and lipid metabolism in the heart. These findings suggest that semaglutide may be a therapeutic agent for improving cardiac remodeling by modulating energy metabolism.


Conflict of interest statement

The authors declare no competing interests.

Figures

Fig. 1
Fig. 1. Sema attenuates cardiac hypertrophy, fibrosis and cardiac dysfunction in mice that underwent TAC for eight weeks.
A Representative B- and M-mode echocardiographic imaging of the heart. BD EF, FS, LVIDd and LVIDs were assessed by echocardiography (n = 12); EF: F (3, 44) = 54.15, P = 8.2e-015; FS: F (3, 44) = 101.2, P = 9.1e-020; LVIDd: F (3, 44) = 15.91, P = 3.8e-007; LVIDs: F (3, 44) = 90.69, P = 7.2e-019. E The maximum rate of isovolumetric systolic LV pressure increase ( + dp/dt max) and the minimum rate of isovolumetric diastolic LV pressure decrease (-dp/dt min) (n = 12); +dp/dt max: F (3, 44) = 52.79, P = 1.3e-014; -dp/dt min: F (3, 44) = 88.28, P = 1.2e-018. F The ventricular pressure-volume loop (P-V loop) (n = 6). G The ratio of LW, BW, HW, and TL (n = 12); HW/TL: F (3, 44) = 83.11, P = 3.7e-018; HW/BW: F (3, 44) = 47.17, P = 8.5e-014; LW/BW: F (3, 44) = 11.35, P = 1.2e-005. H, I The mRNA expression of ANP, BNP, collagen I and collagen III in the heart (n = 6); ANP: F (3, 20) = 336.5, P = 2.8e-017; BNP: F (3, 20) = 276.1, P = 1.9e-016; LW/BW: COL 1: F (3, 20) = 210.4, P = 2.7e-015; COL3: F (3, 20) = 495.5, P = 6.3e-019. J Myocardial hypertrophy was detected by WGA staining and then quantitatively analyzed (scale bar: 50 μm; n = 6); CSA: F (3, 20) = 36.38, P = 2.7e-008. All results are shown as the mean ± SEM and analyzed by one-way ANOVA followed by Bonferroni post hoc test (BE and GJ). p values are indicated. Source data are provided as a Source Data file. EF, ejection fractions; FS, fractional shortening; LVIDd, left ventricular internal dimension at end-diastole; LVIDs, left ventricular internal dimension at end-systole; LW, lung weight; HW, heart weight; TL, tibial length; BW, body weight; BNP, B-type natriuretic peptide; ANP, A-type natriuretic peptide; WGA, wheat germ agglutinin.
Fig. 2
Fig. 2. Sema reverses cardiac hypertrophy, fibrosis and dysfunction in mice that underwent TAC for eight weeks.
A The time of TAC and Sema treatment (i.p.) in mice. B Representative B- and M-mode echocardiographic imaging of the heart. C, D Echocardiographic analysis of EF and FS in mice, data are presented as mean ± SEM (n = 6); EF: F (6, 88) = 25.78, P = 1.8e-017, F (1.947, 85.69) = 75.90 P = 2.0e-019, F (3, 44) = 124.5, P = 1.6e-021, F (44, 88) = 0.8118, P = 7.8e-001, F (6, 132) = 27.50, P = 4.1e-021, F (2, 132) = 80.98, P = 1.1e-023, F (3, 132) = 107.9, P = 2.4e-035; FS: F (6, 132) = 58.51, P = 7.9e-035, F (2, 132) = 144.4, P = 5.9e-034, F (3, 132) = 192.9, P = 4.6e-048, F (6, 132) = 58.51, P = 7.9e-035, F (2, 132) = 144.4, P = 5.9e-034, F (3, 132) = 192.9, P = 4.6e-048. E Representative histopathological cross-sectional images of mice hearts (scale bar: 1 mm; n = 6). F, G Myocardial hypertrophy was detected by WGA staining and then quantitatively analyzed (scale bar: 50 μm; n = 6); CSA: F (3, 20) = 70.58, P = 8.1e-011. H, I Myocardial fibrosis was detected by PSR staining and quantification of the collagen volume (scale bar: 50 μm; n = 6); Fibrotic area: F (3, 20) = 225.5, P = 1.4e-015. J The ratio of BW, HW, and TL (n = 12); HW/BW: F (3, 44) = 180.2, P = 1.0e-024; HW/TL: F (3, 44) = 140.2, P = 1.5e-022. K The mRNA expression levels of ANP, BNP, collagen I and collagen III in the heart (n = 6); ANP and BNP: F (7, 40) = 138.8, P = 5.2e-026; COLI and COL III: F (7, 40) = 82.22, P = 1.0e-021. All results are shown as the mean ± SEM and analyzed using one-way ANOVA followed by Bonferroni post hoc test G, I and J, K. For the analysis in (C,D), repeated measures two-way ANOVA followed by Sidak post hoc test was conducted. p values are indicated. Source data are provided as a Source Data file. EF, ejection fractions; FS, fractional shortening; LW, lung weight; HW, heart weight; TL, tibial length; BW, body weight; BNP, B-type natriuretic peptide; ANP, A-type natriuretic peptide; WGA, wheat germ agglutinin; PSR, picrosirius red.
Fig. 3
Fig. 3. Sema restores mitochondrial dysfunction and morphology in pathological cardiac remodeling.
A Heatmap showing the expression profile of mitochondrial respiratory chain signaling pathway gene sets in mouse cardiac tissue (n = 3). B TEM images of mouse cardiac tissues and quantification of the mitochondrial sectional area (scale bar: 2μm/1μm; n = 6). C The quantification of fragmented fused mitochondria (n = 6); Mitochondrial area: F (3, 20) = 109.4, P = 1.4e-012; Cristae/Mitochondrial area: F (3, 20) = 84.57, P = 1.6e-011. D The quantification of mitochondrial abundance by mitochondrial number and mtDNA/nDNA (n = 6); Mitochondrial number; F (3, 20) = 9.328, P = 4.6e-004; MtDNA/nDNA: F (3, 20) = 21.25, P = 2.0e-006. E Western blotting was used for protein quantitative analysis of mitochondrial function- and structure-related marker proteins Drp1, Opa1, Mfn2, Tom20, COX IV, SDHB, NDUFV2, and ATP5A1 and normalized to VDAC (n = 6 independent experiments with similar results); F (24, 160) = 67.22, P = 4.5e-071, F (3.243, 64.85) = 126.4, P = 8.4e-028, F (3, 20) = 72.44, P = 6.4e-011, F (20, 160) = 0.9693, P = 5.0e-001. F PCR was used for mRNA quantitative analysis of mitochondrial function- and structure-related marker proteins Drp1, Opa1, Mfn2, Tom20, COX IV, SDHB, NDUFV2 and ATP5A1 and normalized to VDAC (n = 6); F (24, 160) = 53.30, P = 6.3e-064, F (4.911, 98.21) = 49.04, P = 5.4e-025, F (3, 20) = 22.95, P = 1.1e-006, F (20, 160) = 1.417, P = 1.2e-001. All results are shown as the mean ± SEM, and analysis using one-way ANOVA followed by Bonferroni post hoc test (C-F) was conducted. p values are indicated. Source data are provided as a Source Data file. TEM, transmission electron microscopy; mtDNA, mitochondrial DNA; nDNA, nuclear DNA.
Fig. 4
Fig. 4. Sema can improve myocardial energy production by reducing glycolytic processes and lipid accumulation.
A Untargeted metabolomics mass spectrometry-based pathway analysis of Sema therapeutic cardiometabolic characteristics, quantification of changes in glycolysis and the TCA products (the red/green boxes represent products that have changed significantly; n = 6); Glucose 6-P: F (2, 15) = 38.02, P = 1.3e-006; Fructose 6-P: F (2, 15) = 23.04, P = 2.7e-005;3-PG: F (2, 15) = 23.58, P = 2.3e-005; PEP: F (2, 15) = 58.41, P = 8.3e-008; Pyruvate: F (2, 15) = 72.71, P = 1.9e-008; Glucose 1-P: F (2, 15) = 24.41, P = 1.9e-005; 6-PG: F (2, 15) = 23.85, P = 2.2e-005; Ribose 5-P: F (2, 15) = 26.35, P = 1.2e-005;Acetyl CoA: F (2, 15) = 206.8 P = 1.2e-011; Citrate: F (2, 15) = 8.599, P = 0.0033; Aconitate: F (2, 15) = 9.583, P = 2.1e-003. B Heatmap showing the determination of the content of free fatty acids associated with untargeted lipid metabolomics (n = 6). C Oil red O staining of NRVMs (scale bar: 50μm/10μm; n = 3 independent experiments with similar results). D The mRNA expression levels of glycolysis and TCA cycle key rate-limiting enzymes HK2, IDH2 and PDH (n = 6); F (4, 30) = 208.2, P = 2.0e-021, F (1.325, 19.87) = 588.5, P = 3.9e-017, F (2, 15) = 38.78, P = 1.2e-006, F (15, 30) = 0.8990, P = 5.7e-001. E The mRNA expression levels of key enzymes associated with fatty acid uptake and transport and mitochondrial β-oxidation CD36, Slc27a1, PDK4, ACOX1 and ACOT1 (n = 6); F (8, 60) = 0.1, P > 9.9e-001, F (3, 41) = 0.3, P = 7.8e-001, F (2, 15) = 426, P = 6.1e-014, F (15, 60) = 0.3, P = 9.9e-001. F Western blot analysis of the glucose transport-associated proteins GLUT1 and GLUT4 and the lipid-associated transporter CD36 (n = 6 independent experiments with similar results). G. GLUT1, GLUT4, and CD36 protein quantification levels were normalized to β-actin (n = 6); CD36/β-actin: F (3, 20) = 27.98, P = 2.3e-007; GLUT1/β-actin: F (3, 20) = 15.61, P = 1.8e-005; GLUT4/β-actin: F (3, 20) = 10.23, P = 2.7e-004. All results are shown as the mean ± SEM, and analysis using one-way ANOVA followed by Bonferroni post hoc test (A, D, E and G) was conducted. p values are indicated. Source data are provided as a Source Data file. TCA, the tricarboxylic acid; NRVMs, neonatal rat ventricular myocytes.
Fig. 5
Fig. 5. Sema can counteract the PI3K/AKT/Creb5 signaling pathway and reduce NR4a1 expression and mitochondrial-nuclear transport.
A Based on joint DEGs and Venn diagram analysis, network maps show the key molecular pathways involved in the cardiac remodeling process and regulated by Sema (n = 3). B Heatmap showing key molecular signatures involved in the cardiac remodeling process and regulated by Sema (n = 3). C Western blot analysis and quantification of PI3K, AKT, p-AKT, Creb5, NR4a1 and p-NR4a1 in the cardiac tissue of Sema-treated mice 8 weeks after sham or TAC surgery and quantification levels were normalized to β-actin (n = 6 independent experiments with similar results); PI3K/β-actin: F (3, 20) = 24.21, P = 7.3e-007; pAKT/AKT: F (3, 20) = 34.29, P = 4.5e-008; Creb5/β-actin: F (3, 20) = 17.38, P = 8.6e-006; NR4a1/β-actin: F (3, 20) = 6.550, P = 0.0029; pNR4a1/β-actin: F (3, 20) = 25.74, P = 4.5e-007. D, E Western blot analysis and quantification of NR4a1 in mitochondrial and nuclear proteins and quantification levels were normalized NR4a1 (nuclear/mitochondrial) (n = 6 independent experiments with similar results); NR4a1 (nuclear/mitochondrial): F (3, 20) = 5.807, P = 5.0e-003. F Pull-down analysis showing the binding between Creb5 and NR4a1 in vitro (n = 6 independent experiments with similar results). G, H Representative images of MIRO1 (green) and NR4a1 (red) immunofluorescence staining in NRVMs are shown on the left, and colocalization Pearson’s correlation coefficient (PCC) analysis is shown on the right (scale bar: 50 μm; n = 3 independent experiments with similar results). All results are shown as the mean ± SEM, and analysis using one-way ANOVA followed by Bonferroni post hoc test (C and E) was conducted. For the analysis in (G and H), a co-localization PCC analysis was used. p values are indicated. Source data are provided as a Source Data file. DEGs, differentially expressed genes; TAC, transverse aortic constriction; NRVMs, neonatal rat ventricular myocytes.
Fig. 6
Fig. 6. NR4a1 knockdown ameliorates disorders of glucolipid metabolism and ameliorates pathological cardiac remodeling.
A Representative B- and M-mode echocardiographic imaging of shRNA/shNR4a1 mouse hearts. B Echocardiographic analysis of EF and ES in mice (n = 12); EF: F (4, 55) = 48.91, P = 1.7e-017; FS: F (4, 55) = 130.9, P = 2.0e-027. C, D Myocardial hypertrophy was detected by WGA staining and then quantitatively analyzed in shRNA/shNR4a1 mice (n = 6); F (3, 396) = 2018, P = 1.70e-239. E, F Western blot analysis and quantification of the mitochondrial respiratory chain proteins ATP5a, UQCRC2, MTCO1, SDHB and NDUF88 in the cardiac tissue of shRNA/shNR4a1 mice after sham or TAC surgery (n = 6 independent experiments with similar results); F (12, 100) = 1.789, P = 6.0e-002, F (4, 100) = 161.5, P = 1.0e-042, F (3, 100) = 62.10, P = 9.4e-023. G Mass spectrometry-based analysis of glycolipid metabolism and TCA-related substances in shRNA/shNR4a1 mice 8 weeks after sham or TAC surgery (scale bar: 50 μm; n = 6). All results are shown as the mean ± SEM, and analysis using one-way ANOVA followed by Bonferroni post hoc test (B, D and F) was conducted. p values are indicated. Source data are provided as a Source Data file. EF, ejection fractions; FS, fractional shortening; WGA, wheat germ agglutinin; TAC, transverse aortic constriction.
Fig. 7
Fig. 7. NR4a1 knockdown improves the effects of pathological cardiac remodeling and mitochondrial function in vitro.
A Immunofluorescence staining and quantification of a-actinin in NRVMs reproducing siRNA/siNR4a1 virus after PE/PBS stimulation (scale bar: 50 μm; n = 3 independent experiments with similar results); F (3, 20) = 86.03, P = 1.3e-011. B The mRNA levels of the myocardial hypertrophy indicators ANP, BNP and β-MHC (scale bar: 50 μm; n = 6); Anp: F (3, 20) = 279.7, P = 1.7e-016; Bnp: F (3, 20) = 149.5, P = 7.3e-014; β-MHC: F (3, 20) = 213.2, P = 2.4e-015. C Representative confocal image of mitochondrial morphology stained by MitoTracker and the quantification of fragmented, intermediate, and elongated mitochondria (scale bar: 50/20 μm; n = 6). D NRVMs transfected with siRNA and siNR4a1 were subjected to an OCR assay. OCR was normalized by the total number of cardiomyocytes in each group (six pore cells per group; n = 6). E ATP production-coupled respiration in D (n = 6); F (3, 20) = 149.7, P = 7.2e-014. All results are shown as the mean ± SEM, and analysis using a one-way ANOVA followed by Bonferroni post hoc test (AC and E) was conducted. For the analysis in D, repeated measures two-way ANOVA followed by Sidak post hoc test was conducted. p values are indicated. Source data are provided as a Source Data file. PE, phenylephrine; NRVMs, neonatal rat ventricular myocytes; OCR, oxygen consumption rate; FCCP, carbonyl cyanide 4-(trifluoromethoxy) phenylhydrazone.
Fig. 8
Fig. 8. NR4a1 overexpression exacerbates cardiac remodeling and dysfunction in mice that underwent TAC for eight weeks.
A Representative B- and M-mode ultrasound images of AAV9-NC and AAV9-NR4a1 mice 8 weeks after sham or TAC surgery. B Echocardiographic analysis of EF, FS, LVIDd and LVIDs in mice (n = 12); EF: F (3, 44) = 24.81, P = 1.5e-009; FS: F (3, 44) = 13.84, P = 1.7e-006; LVIDd: F (3, 44) = 4.115, P = 1.2e-002; LVIDs: F (3, 44) = 7.995, P = 0.0002. C Representative histopathological cross-sectional images of mouse hearts (scale bar: 2 mm; n = 6). D, E Myocardial hypertrophy was detected by WGA staining and then quantitatively analyzed (scale bar: 50 μm; n = 6); F (3, 20) = 5.364, P = 0.0071. All results are shown as the mean ± SEM, and analysis using one-way ANOVA followed by Bonferroni post hoc test (B and E) was conducted. p values are indicated. Source data are provided as a Source Data file. AAV9, adeno-associated virus 9; TAC, transverse aortic constriction; EF, ejection fractions; FS, fractional shortening; LVIDd, diastolic left ventricular internal diameters; LVIDs, systolic left ventricular internal diameters; WGA, wheat germ agglutinin.

Similar articles

Cited by

References

    1. Cohn JN, Ferrari R, Sharpe N. Cardiac remodeling–concepts and clinical implications: a consensus paper from an international forum on cardiac remodeling. Behalf of an international forum on cardiac remodeling. J. Am. Coll. Cardiol. 2000;35:569–582. doi: 10.1016/S0735-1097(99)00630-0. - DOI - PubMed
    1. Bertero E, Maack C. Metabolic remodelling in heart failure. Nat. Rev. Cardiol. 2018;15:457–470. doi: 10.1038/s41569-018-0044-6. - DOI - PubMed
    1. Saddik M, Lopaschuk GD. Myocardial triglyceride turnover and contribution to energy substrate utilization in isolated working rat hearts. J. Biol. Chem. 1991;266:8162–8170. doi: 10.1016/S0021-9258(18)92956-X. - DOI - PubMed
    1. Wende AR, et al. Glucose transporter 4-deficient hearts develop maladaptive hypertrophy in response to physiological or pathological stresses. Am. J. Physiol. Heart circulatory Physiol. 2017;313:H1098–h1108. doi: 10.1152/ajpheart.00101.2017. - DOI - PMC - PubMed
    1. Sankaralingam S, et al. Lowering body weight in obese mice with diastolic heart failure improves cardiac insulin sensitivity and function: implications for the obesity paradox. Diabetes. 2015;64:1643–1657. doi: 10.2337/db14-1050. - DOI - PubMed

MeSH terms

Substances