

Ensemble of global climate simulations for temperature in historical, 1.5 °C and 2.0 °C scenarios from HadAM4
- PMID: 38834583
- PMCID: PMC11150430
- DOI: 10.1038/s41597-024-03400-2
Ensemble of global climate simulations for temperature in historical, 1.5 °C and 2.0 °C scenarios from HadAM4
Abstract
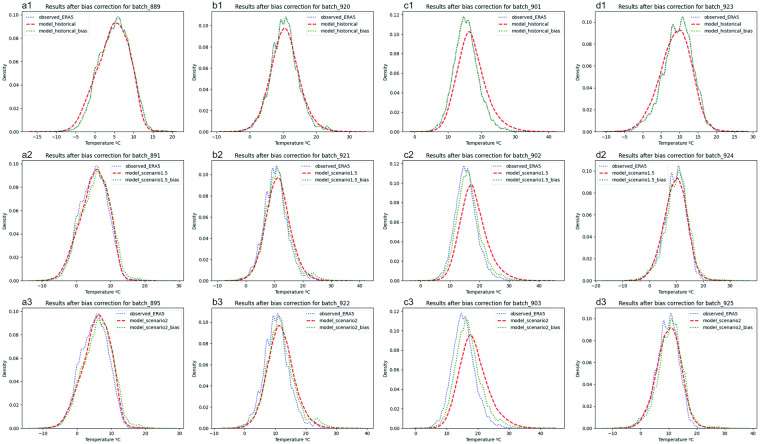
Large ensembles of global temperature are provided for three climate scenarios: historical (2006-16), 1.5 °C and 2.0 °C above pre-industrial levels. Each scenario has 700 members (70 simulations per year for ten years) of 6-hourly mean temperatures at a resolution of 0.833° ´ 0.556° (longitude ´ latitude) over the land surface. The data was generated using the climateprediction.net (CPDN) climate simulation environment, to run HadAM4 Atmosphere-only General Circulation Model (AGCM) from the UK Met Office Hadley Centre. Biases in simulated temperature were identified and corrected using quantile mapping with reference temperature data from ERA5. The data is stored within the UK Natural and Environmental Research Council Centre for Environmental Data Analysis repository as NetCDF V4 files.
© 2024. The Author(s).
Conflict of interest statement
The authors declare no competing interests.
Figures
References
-
- IPCC. IPCC Sixth Assessment Report (AR6). https://www.ipcc.ch/assessment-report/ar6/. - PMC - PubMed
-
- IPCC. Synthesis report of the IPCC Sixth Assessment Report (AR6). https://report.ipcc.ch/ar6syr/pdf/IPCC_AR6_SYR_LongerReport.pdf (2023).
-
- IPCC. Climate Change 2022: Impacts, Adaptation, and Vulnerability. Contribution of Working Group II to the Sixth Assessment Report of the Intergovernmental Panel on Climate Change. 10.1017/9781009325844 (Cambridge University Press, 2022).
-
- Andrijevic M, Byers E, Mastrucci A, Smits J, Fuss S. Future cooling gap in shared socioeconomic pathways. Environmental Research Letters. 2021;16:094053. doi: 10.1088/1748-9326/ac2195. - DOI
-
- Isaac M, van Vuuren DP. Modeling global residential sector energy demand for heating and air conditioning in the context of climate change. Energy Policy. 2009;37:507–521. doi: 10.1016/j.enpol.2008.09.051. - DOI
Publication types
Grants and funding
- Future of Cooling Programme/Oxford University | Oxford Martin School, University of Oxford
- 101023241/EC | EU Framework Programme for Research and Innovation H2020 | H2020 Priority Excellent Science | H2020 Marie Skłodowska-Curie Actions (H2020 Excellent Science - Marie Skłodowska-Curie Actions)
- DOCILE NE/P002099/1/RCUK | Natural Environment Research Council (NERC)
- DOCILE NE/P002099/1/RCUK | Natural Environment Research Council (NERC)
LinkOut - more resources
Full Text Sources
Miscellaneous
