. 2024 Jun 4;14(1):12825.
doi: 10.1038/s41598-024-63552-4.

Influence of heterochirality on the structure, dynamics, biological properties of cyclic(PFPF) tetrapeptides obtained by solvent-free ball mill mechanosynthesis

Affiliations

Influence of heterochirality on the structure, dynamics, biological properties of cyclic(PFPF) tetrapeptides obtained by solvent-free ball mill mechanosynthesis

Irena Bak-Sypien et al. Sci Rep. .

Abstract

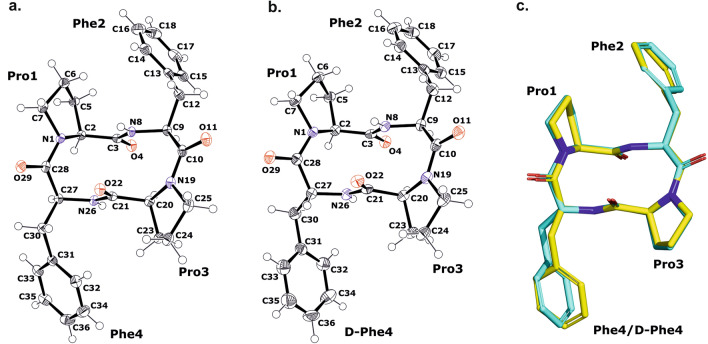
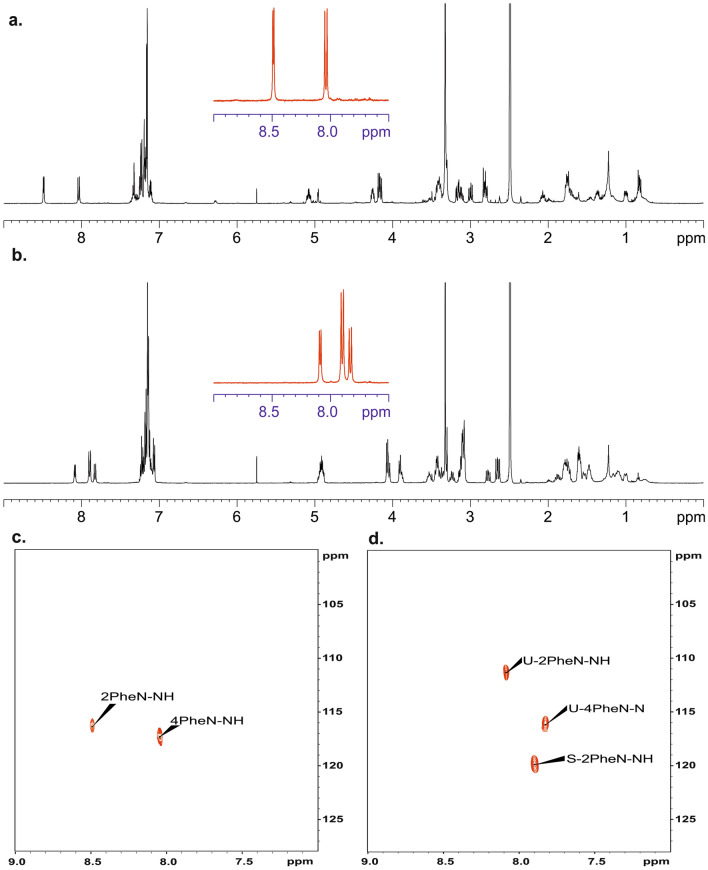
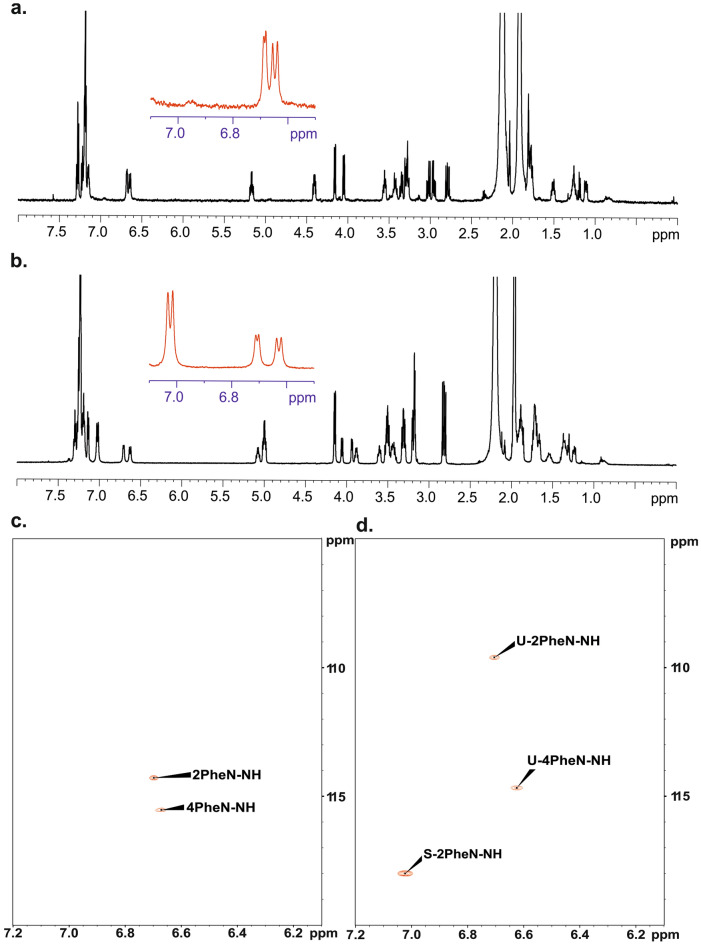
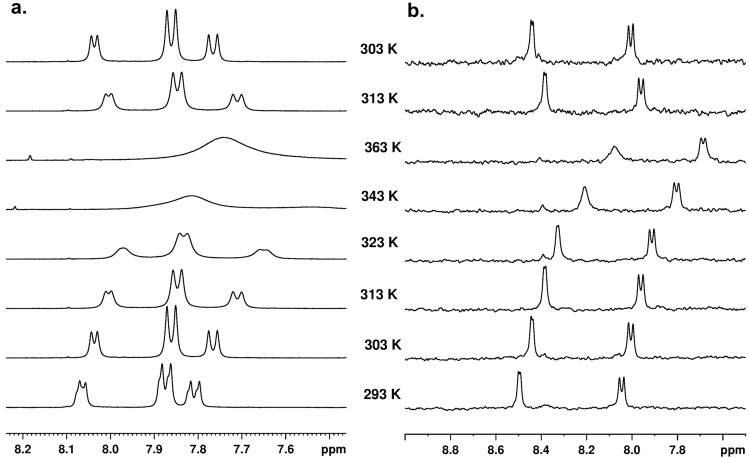
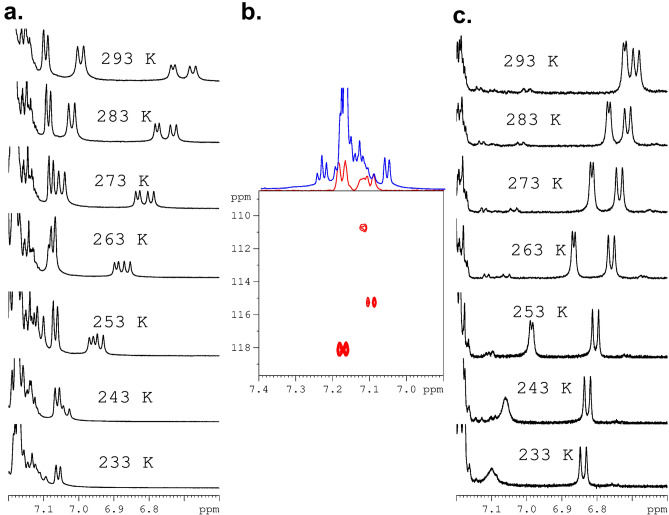
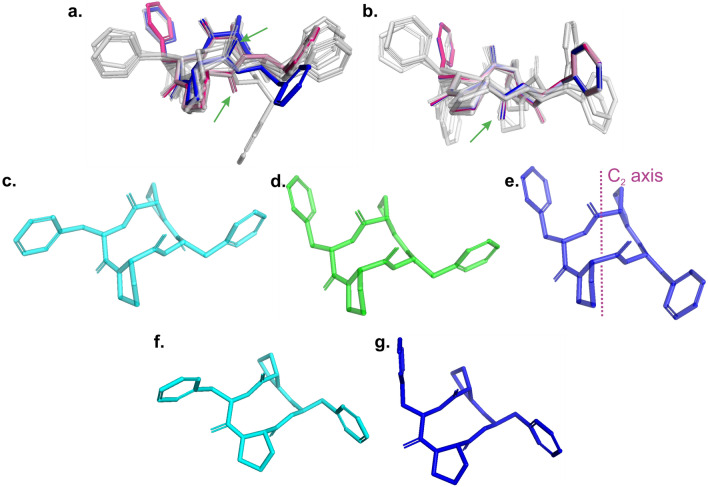
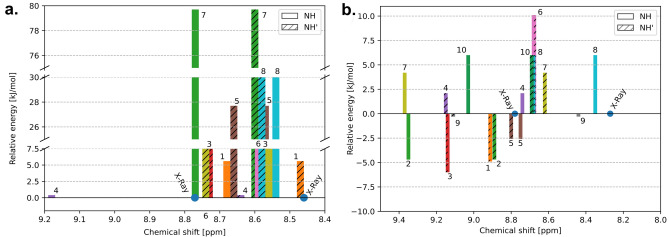
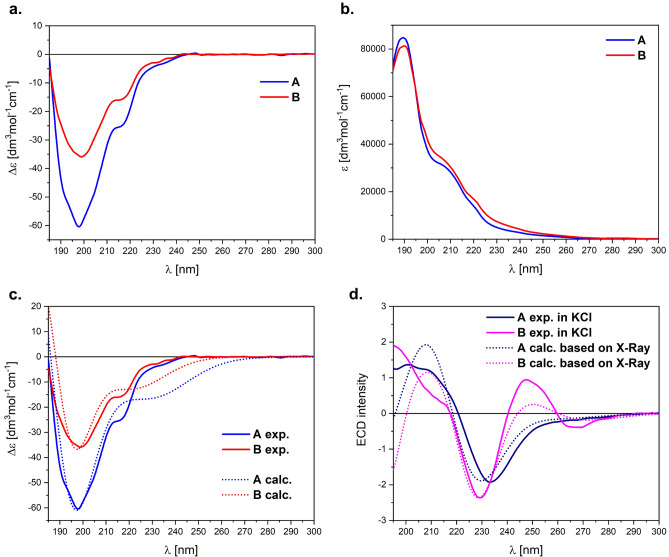
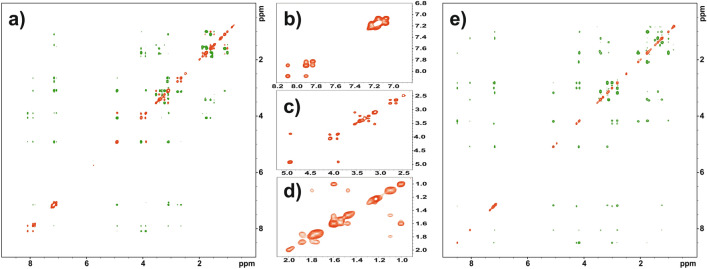
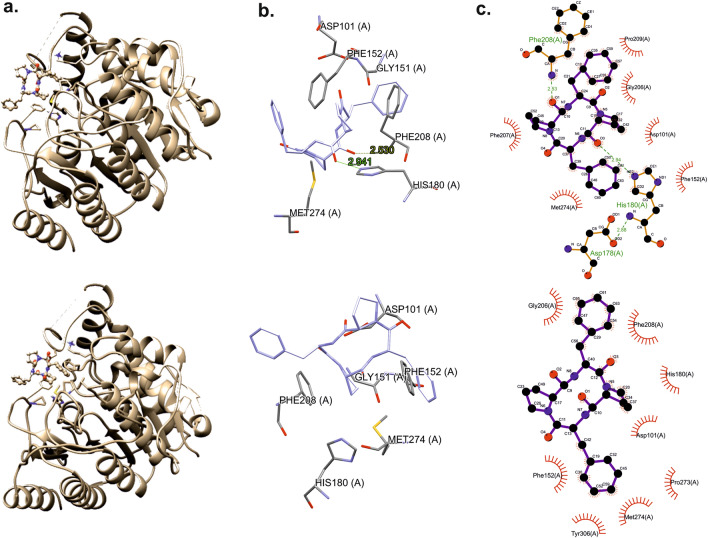
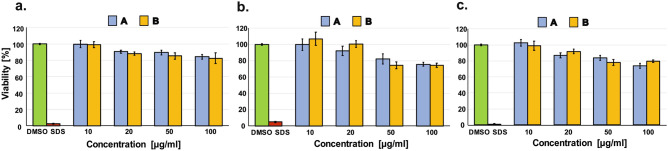
Cyclic tetrapeptides c(Pro-Phe-Pro-Phe) obtained by the mechanosynthetic method using a ball mill were isolated in a pure stereochemical form as a homochiral system (all L-amino acids, sample A) and as a heterochiral system with D configuration at one of the stereogenic centers of Phe (sample B). The structure and stereochemistry of both samples were determined by X-ray diffraction studies of single crystals. In DMSO and acetonitrile, sample A exists as an equimolar mixture of two conformers, while only one is monitored for sample B. The conformational space and energetic preferences for possible conformers were calculated using DFT methods. The distinctly different conformational flexibility of the two samples was experimentally proven by Variable Temperature (VT) and 2D EXSY NMR measurements. Both samples were docked to histone deacetylase HDAC8. Cytotoxic studies proved that none of the tested cyclic peptide is toxic.


Conflict of interest statement

The authors declare no competing interests.

Figures

Figure 1
Figure 1
(a,b) The molecular structures of c(Pro-Phe-Pro-Phe) (sample A) and c(Pro-Phe-Pro-D-Phe) (sample B) crystals showing the atom-labeling scheme. The displacement ellipsoids are drawn with 50% probability level and the H atoms are shown as small spheres of arbitrary radius. (c) The superposition of the analyzed cyclic peptide molecules; c(Pro-Phe-Pro-Phe) and c(Pro-Phe-Pro-D-Phe) are shown as yellow and cyan, respectively.
Figure 2
Figure 2
500 MHz 1H NMR spectra of sample B (a) and sample A (b) dissolved in DMSO-d6. The red inset shown in the middle of the spectrum represents N–H protons. The spectra were recorded at a temperature of 298 K. 1H–15N HSQC 2D NMR correlations for sample B (c) and for sample A (d). Samples were dissolved in DMSO-d6. Symbol S (d) represents sample with symmetrical geometry, symbol U represents unsymmetrical sample.
Figure 3
Figure 3
500 MHz 1H NMR spectra of sample A (b) and sample B (a) dissolved in acetonitrile-d3. The red inset shown in the middle of the spectrum represents N–H protons. The spectra were recorded at a temperature of 298 K. 1H–15N HSQC 2D NMR correlations for sample B (c) and for sample A (d). Sample were dissolved in acetonitrile-d3. Symbol S (d) represents sample with symmetrical geometry, symbol U represents unsymmetrical sample.
Figure 4
Figure 4
500 MHz 1H NMR Variable Temperature (VT) spectra for samples A (left) and B (right) dissolved in DMSO-d6. The measurement temperature is indicated in spectra.
Figure 5
Figure 5
Variable Temperature (VT) NMR spectra for samples dissolved in acetonitrile d3. (a) 1H VT NMR spectra for sample A, (b) The 1H–15N HSQC 2D NMR spectrum for sample A recorded at 233 K. The F2 projection generated from this correlation is shown as a red spectrum. The blue spectrum represents the 1H NMR spectrum recorded at 233 K, as shown in (a). (c) 1H VT NMR spectra for sample B. The measurement temperature is indicated in spectra.
Figure 6
Figure 6
Comparison of all conformers with indicating X-Ray (red) and lowest energy (blue) structure for A (a) and B (b). Green arrows indicated the difference in cyclic chain. Comparison of three the lowest energy conformers: (c) 1, (d) 2 and (e) 3 for A sample where the structure 3 is the lowest energy conformer and possess C2 axis symmetry. Comparison of two the lowest energy conformers: (f) 6 and (g) X-Ray for B sample where the structure X-Ray is the lowest energy conformer. Further details in the main text.
Figure 7
Figure 7
(a) Comparison of chemical shifts [ppm] and relative energy [kJ/mol] of conformers for sample A. (b) Comparison of chemical shifts [ppm] and relative energy [kJ/mol] of conformers for sample B. The conformation energy of the sample determined from X-ray examinations is arbitrarily set to 0 for A and B independently.
Figure 8
Figure 8
ECD (a) and UV (b) spectra of A and B (c = 3.4 × 10–4 M) recorded in the mixture CH3CN/H2O (1:1) at room temperature. (c) Solution-phase ECD spectrum of A and B in comparison with the calculated TDDFT spectra at the ωB97X-D/def2-TZVP/PCM(H2O); Note: UV-correction = 10 nm, σ = 0.47 eV. (d) Solid-state ECD spectra of A and B in KCl pellet (~ 0.3/100 mg KCl) superimposed with the calculated ECD spectra in vacuum based on X-ray structures using TDDFT method at the ωB97X-D/def2-TZVP (after H-optimization); Note: UV-correction = 25 nm, σ = 0.5 eV.
Figure 9
Figure 9
(a) ROESY-EXSY 2D NMR spectrum for sample A dissolved in DMSO-d6. The green contour-peaks represent the ROESY while the red cross-peaks EXSY correlations, the expanded regions (bd) marked in squares. Only EXSY cross-peaks are shown. Spectrum was recorded at temperature 298 K with mixing time equal 300 ms. (e) ROESY-EXSY 2D NMR spectrum for sample B dissolved in DMSO-d6. The red color represents the diagonal, the EXSY cross peaks are not visible on the spectrum. Spectrum was recorded at temperature 298 K with mixing time equal 300 ms.
Figure 10
Figure 10
Structures of compounds with docked ligand (a). Active site with ligand (b), and schematic diagram of the binding (c) for sample A (top column) and sample B (bottom column).
Figure 11
Figure 11
The impact of tested cyclic tetrapeptides on the viability of (a) HaCaT, (b) A431 and (c) MDA-MB-231 cells after 72-h incubation. Results were normalized to cells treated only with DMSO (taken as 100%). SDS was used as a positive control to confirm the validity of the assay. Each bar represents the mean viability value calculated as an average of at least three independent experiments performed in triplicate ± standard error.

References

    1. Empting M. CHAPTER 1. An introduction to cyclic peptides. In: Koehnke J, Naismith J, Van Der Donk WA, editors. Chemical Biology. Cambridge: Royal Society of Chemistry; 2017. pp. 1–14.
    1. Roxin Á, Zheng G. Flexible or fixed: A comparative review of linear and cyclic cancer-targeting peptides. Future Med. Chem. 2012;4:1601–1618. doi: 10.4155/fmc.12.75. - DOI - PubMed
    1. Vlieghe P, Lisowski V, Martinez J, Khrestchatisky M. Synthetic therapeutic peptides: Science and market. Drug Discov. Today. 2010;15:40–56. doi: 10.1016/j.drudis.2009.10.009. - DOI - PubMed
    1. Abdalla MA. Medicinal significance of naturally occurring cyclotetrapeptides. J. Natl. Med. 2016;70:708–720. doi: 10.1007/s11418-016-1001-5. - DOI - PubMed
    1. Mishra A, Dey S. Molecular docking studies of a cyclic octapeptide-cyclosaplin from sandalwood. Biomolecules. 2019;9:740. doi: 10.3390/biom9110740. - DOI - PMC - PubMed