. 2024 Jun 4;15(1):4743.
doi: 10.1038/s41467-024-47917-x.

Highly confined epsilon-near-zero and surface phonon polaritons in SrTiO3 membranes

Affiliations

Highly confined epsilon-near-zero and surface phonon polaritons in SrTiO3 membranes

Ruijuan Xu et al. Nat Commun. .

Erratum in

Abstract

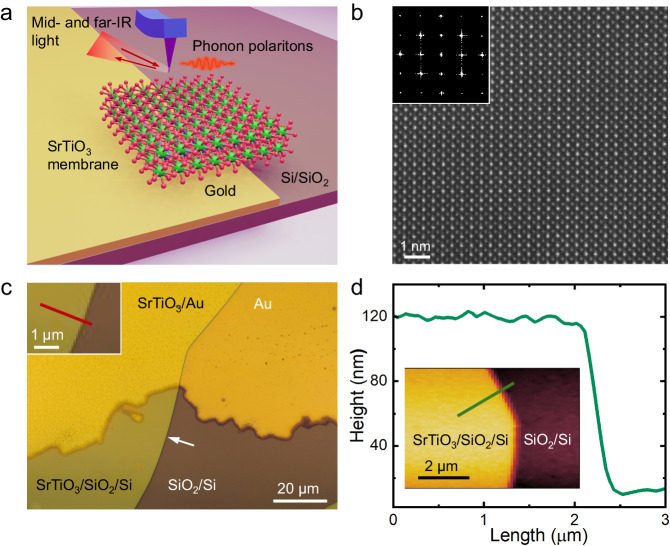
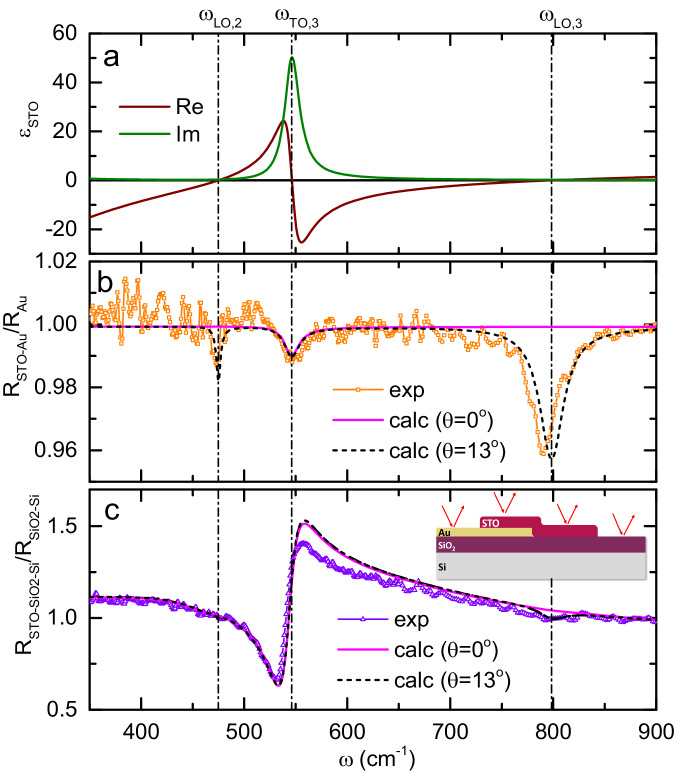
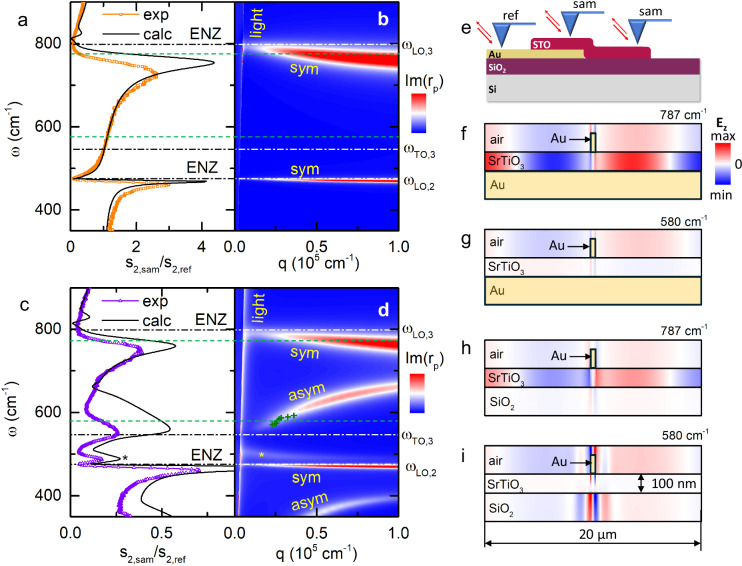
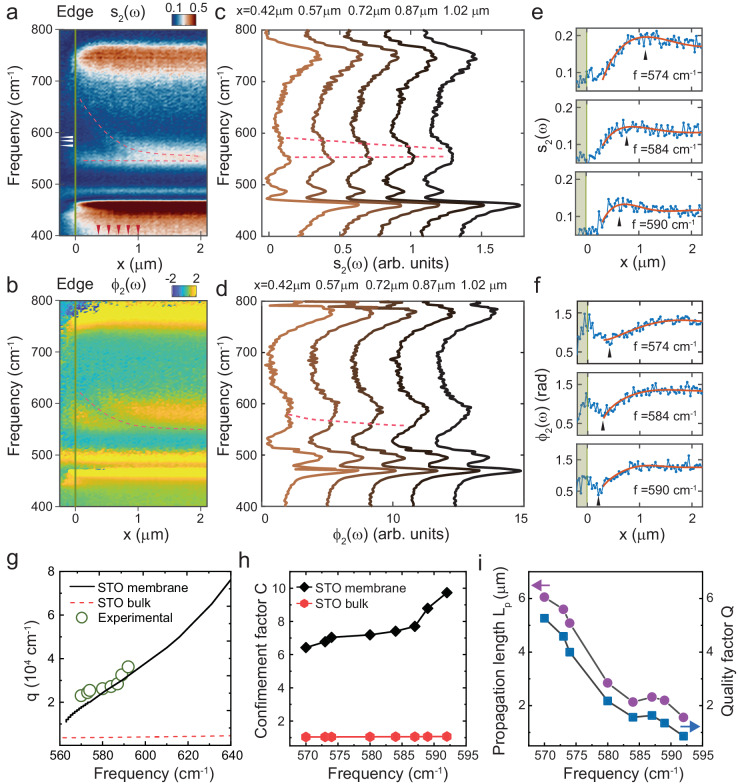
Recent theoretical studies have suggested that transition metal perovskite oxide membranes can enable surface phonon polaritons in the infrared range with low loss and much stronger subwavelength confinement than bulk crystals. Such modes, however, have not been experimentally observed so far. Here, using a combination of far-field Fourier-transform infrared (FTIR) spectroscopy and near-field synchrotron infrared nanospectroscopy (SINS) imaging, we study the phonon polaritons in a 100 nm thick freestanding crystalline membrane of SrTiO3 transferred on metallic and dielectric substrates. We observe a symmetric-antisymmetric mode splitting giving rise to epsilon-near-zero and Berreman modes as well as highly confined (by a factor of 10) propagating phonon polaritons, both of which result from the deep-subwavelength thickness of the membranes. Theoretical modeling based on the analytical finite-dipole model and numerical finite-difference methods fully corroborate the experimental results. Our work reveals the potential of oxide membranes as a promising platform for infrared photonics and polaritonics.


Conflict of interest statement

The authors declare no competing interests.

Figures

Fig. 1
Fig. 1. Preparation and structural characterization of SrTiO3 membranes.
a Schematics of the s-SNOM/SINS measurement on an SrTiO3 membrane. b Atomic-resolution STEM imaging of a freestanding SrTiO3 membrane suspended on a SiNx TEM grid. Inset shows the Fourier-transform of the STEM image. c The optical image of the SrTiO3 membrane transferred on a thermally oxidized Si substrate with part of the surface coated by a 50 nm thick gold film. The white arrow denotes the edge of the membrane. The inset shows the trace of SINS line scan across the edge of the membrane supported on SiO2/Si substrate. d A line scan of the height profile across the edge of the membrane. The inset indicates the trace of the line scan.
Fig. 2
Fig. 2. Analysis of far-field reflectivity spectra of the SrTiO3 membrane.
a The real and imaginary parts of the dielectric function of SrTiO3 at room temperature obtained by a factorized-formula fitting of the normal-incidence reflectivity measured on bulk SrTiO3. b Far-field reflectivity of a 100 nm SrTiO3 membrane laminated on gold (symbols) normalized to the reflectivity of bare gold, and calculated spectra using the dielectric function of bulk SrTiO3 for normal incidence (solid line) and for θ = 13° (dashed line). c Far-field reflectivity of the same SrTiO3 membrane on SiO2/Si normalized to the reflectivity of substrate (symbols), and calculated spectra using the dielectric function of bulk SrTiO3 for normal incidence (solid line) and at θ = 13° (dashed line). Vertical lines in all panels refer to LO and TO frequencies of bulk SrTiO3.
Fig. 3
Fig. 3. SINS spectra on a SrTiO3 membrane supported by gold- and SiO2.
a, c Symbols: SINS second-harmonics amplitude spectra (“sam”) of the membrane on gold- (a) and on SiO2/Si (c) normalized to the signal from bare gold (“ref”). Solid lines: finite-dipole model based on the dielectric function of bulk SrTiO3. b,d Calculated imaginary part of the complex reflection coefficient rp(q,ω) for the 100 nm SrTiO3 membrane on gold and on SiO2/Si, respectively. Dashed-dotted Vertical lines in (ad) denote the LO and TO frequencies of bulk SrTiO3. “sym" and “asym” refer to symmetric and antisymmetric modes, respectively. Green crosses in Fig.3d represent the data points in Fig.4g. e Schematic describing the SINS spectra acquisition. fi Simulated distribution of the electromagnetic field, when the sample is illuminated with a plane wave and a gold nanobeam (marked with a black rectangle) is placed on top in order to excite waves with finite in-plane momenta, for the membrane on gold at 787 and 560 cm−1, respectively (e, f), and for the membrane on SiO2/Si at the same frequencies (marked with dashed lines in (ad)). h, i In gold, the electromagnetic field is negligibly small.
Fig. 4
Fig. 4. Real-space SINS nanoimaging of SPhPs in SiO2/Si-supported membranes.
a, b Experimental near-field amplitude (a) and phase (b) spectra obtained by a line scan perpendicular to the edge of the membrane. The trace of SINS linescan is shown in Fig. 1c. Dashed curves in (a) and (b) denote the peak and dip associated with the propagation of SPhSs. c, d Near-field SINS amplitude (c) and phase (d) spectra obtained at locations on the membrane with different distances to the edge. The locations are denoted by the red arrows in (a). Dashed curves in (c) and (d) denote the peak and dip associated with the propagation of SPhSs. e, f Simultaneously measured near-field amplitude (e) and phase (f) line profiles of the SrTiO3 film at different frequencies (denoted by white arrows in (a)), with the scan direction perpendicular to the edge (denoted by green line) at x = 0. Experimental data is shown in blue. Black arrows in (e) and (f) show the shift of the peak in the amplitude profile and shift of the dip in the phase profiles. Red solid lines show the fitting of the experimental data using the complex-valued function s2(x)eiϕ2(x)=Aeiqxx+B. g Dispersion of SPhPs in bulk SrTiO3 and membranes. Experimental data extracted from SINS imaging is shown as green circles. h The confinement factor of SPhPs in membranes and bulk SrTiO3 as a function of frequency. i Propagation length Lp (purple circles) and quality factor Q (blue squares) of SPhPs in SrTiO3 membrane versus frequency.

References

    1. Caldwell, J. D. et al. Low-loss, infrared and terahertz nanophotonics using surface phonon polaritons. Nanophotonics4, 44–68 (2015).
    1. Campione, S., Brener, I. & Marquier, F. Theory of epsilon-near-zero modes in ultrathin films. Phys. Rev. B: Condens. Matter91, 121408 (2015).
    1. Vassant, S., Hugonin, J.-P., Marquier, F. & Greffet, J.-J. Berreman mode and epsilon near zero mode. Opt. Express20, 23971–23977 (2012). - PubMed
    1. Kinsey, N., DeVault, C., Boltasseva, A. & Shalaev, V. M. Near-zero-index materials for photonics. Nat. Rev. Mater.4, 742–760 (2019).
    1. Berreman, D. W. Infrared absorption at longitudinal optic frequency in cubic crystal films. Phys. Rev.130, 2193 (1963).