Randomized Controlled Trial
. 2024 Jul;27(7):1364-1375.
doi: 10.1038/s41593-024-01672-w. Epub 2024 Jun 4.

Cognitive control training with domain-general response inhibition does not change children's brains or behavior

Affiliations
Randomized Controlled Trial

Cognitive control training with domain-general response inhibition does not change children's brains or behavior

Keertana Ganesan et al. Nat Neurosci. 2024 Jul.

Abstract

Cognitive control is required to organize thoughts and actions and is critical for the pursuit of long-term goals. Childhood cognitive control relates to other domains of cognitive functioning and predicts later-life success and well-being. In this study, we used a randomized controlled trial to test whether cognitive control can be improved through a pre-registered 8-week intervention in 235 children aged 6-13 years targeting response inhibition and whether this leads to changes in multiple behavioral and neural outcomes compared to a response speed training. We show long-lasting improvements of closely related measures of cognitive control at the 1-year follow-up; however, training had no impact on any behavioral outcomes (decision-making, academic achievement, mental health, fluid reasoning and creativity) or neural outcomes (task-dependent and intrinsic brain function and gray and white matter structure). Bayesian analyses provide strong evidence of absent training effects. We conclude that targeted training of response inhibition does little to change children's brains or their behavior.


Conflict of interest statement

N.U.F.D. is a co-founder of Turing Medical. Any potential conflicts of interest have been reviewed and managed by Washington University. N.U.F.D. is a co-inventor of FIRMM Technology 2198 (FIRMM—real-time monitoring and prediction of motion in MRI scans, exclusively licensed to Turing Medical). Any potential conflicts of interest have been reviewed and managed by Washington University. The other authors declare no competing interests.

Figures
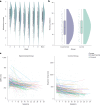
Fig. 1
Fig. 1. Training metrics.
a, Motivation (week 2: Experimental Group = 5.30 ± 0.80 (n = 38, min = 3.5, max = 6.17, q1–q3 = [4.67,5.67]); Control Group = 5.30 ± 0.72 (n = 39, min = 3.17, max = 6.17, q1–q3 = [5,6]) decreased over the weeks F (6, 308.75) = 16.42, P < 0.001) and was similar (t (395.13) = −0.50, P = 0.61) between both groups. b, Number of sessions (Experimental Group = 16.60 ± 8.35; Control Group = 16.99 ± 8.55) completed was similar (t (205.33) = 0.33, P > 0.740) between both groups. c, Training task performance during training improved in both groups over the course of the training period. Source data
Fig. 2
Fig. 2. Short-term near transfer.
a, Percentage correct stop increased significantly in the Experimental Group after training (pre-session: Experimental Group (n = 109) = 0.56 ± 0.01, Control Group (n = 109) = 0.56 ± 0.01; post-session: Experimental Group (n = 107) = 0.62 ± 0.01, Control Group (n = 106) = 0.54 ± 0.01). b, Go RT increased significantly in the Experimental Group and decreased significantly in the Control Group after training (pre-session: Experimental Group (n = 118) = 590.52 ± 9.93, Control Group (n = 116) = 580.42 ± 9.42; post-session: Experimental Group (n = 109) = 650.63 ± 10.31, Control Group (n = 109) = 544.60 ± 10.08). Source data
Fig. 3
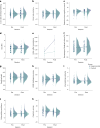
Fig. 3. Short-term far transfer on behavioral indices.
ac, Cognitive control. A significant training effect was found in the inhibition/shifting error factor (pre-session: Experimental Group (n = 110) = −0.003 ± 0.01, Control Group (n = 107) = 0.004 ± 0.01; post-session: Experimental Group (n = 104) = 0.027 ± 0.01, Control Group (n = 103) = −0.029 ± 0.01) and the reaction time factor (pre-session: Experimental Group (n = 111) = −0.026 ± 0.36, Control Group (n = 107) = 0.017 ± 0.30; post-session: Experimental Group (n = 104) = 1.31 ± 0.36, Control Group (n = 103) = −1.36 ± 0.50). Overall reaction times across all cognitive control tasks increased in the Experimental Group and decreased in the Control Group (error rate memory: pre-session: Experimental Group (n = 110) = 0.001 ± 0.003, Control Group (n = 107) = −0.001 ± 0.003; post-session: Experimental Group (n = 104) = 0.0004 ± 0.004, Control Group (n = 103) = −0.0002 ± 0.004). df, Decision-making. DG offer (pre-session: Experimental Group (n = 116) = 2.00 ± 0.10, Control Group (n = 113) = 1.77 ± 0.11; post-session: Experimental Group (n = 91) = 2.13 ± 0.12, Control Group (n = 82) = 1.80 ± 0.14); unfair offer acceptance (pre-session: Experimental Group (n = 116) = 0.43 ± 0.05, Control Group (n = 113) = 0.41 ± 0.05; post-session: Experimental Group (n = 91) = 0.57 ± 0.05, Control Group (n = 82) = 0.43 ± 0.05); percentage of delayed choice (pre-session: Experimental Group (n = 116) = 38.55 ± 3.06, Control Group (n = 112) = 38.80 ± 3.21; post-session: Experimental Group (n = 89) = 48.0 ± 3.72, Control Group (n = 82) = 43.63 ± 3.86). g, Academic achievement (pre-session: Experimental Group (n = 109) = 118.69 ± 1.02, Control Group (n = 110) = 116.01 ± 1.02; post-session: Experimental Group (n = 109) = 118.43 ± 1.04, Control Group (n = 110) = 116.75 ± 1.04). h, Fluid reasoning (pre-session: Experimental Group (n = 111) = 114.85 ± 1.45, Control Group (n = 107) = 117.66 ± 1.50; post-session: Experimental Group (n = 104) = 121.59 ± 1.51, Control Group (n = 103) = 123.0 ± 1.56). i,j, Changes in mental health, separately for internalizing problems (pre-session: Experimental Group (n = 96) = −0.008 ± 0.08, Control Group (n = 90) = 0.008 ± 0.10; post-session: Experimental Group (n = 63) = 0.10 ± 0.12, Control Group (n = 68) = −0.091 ± 0.11) and externalizing problems (pre-session: Experimental Group (n = 96) = 0.11 ± 0.10, Control Group (n = 90) = −0.12 ± 0.09; post-session: Experimental Group (n = 63) = 0.11 ± 0.14, Control Group (n = 68) = −0.10 ± 0.09). k, Creativity (pre-session: Experimental Group (n = 111) = 20.94 ± 0.81, Control Group (n = 102) = 24.28 ± 0.78; post-session: Experimental Group (n = 104) = 16.39 ± 0.67, Control Group (n = 98) = 17.20 ± 0.77). Source data
Fig. 4
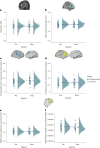
Fig. 4. Short term far transfer on neural indices.
Changes before and after training in a: activation in right IFG (rIFG) (pre-session: Experimental Group (n = 72) = −0.24 ± 0.25, Control Group (n = 69) = 0.96 ± 0.20; post-session: Experimental Group (n = 70) = −0.05 ± 0.25, Control Group (n = 66) = 0.27 ± 0.18). b, Cortical thickness in rIFG (pre-session: Experimental Group (n = 75) = 2.86 ± 0.01, Control Group (n = 71) = 2.89 ± 0.01; post-session: Experimental Group (n = 70) = 2.85 ± 0.01, Control Group (n = 67) = 2.87 ± 0.01). c, Functional connectivity in the CON (pre-session: Experimental Group (n = 75) = 0.31 ± 0.01, Control Group (n = 72) = 0.30 ± 0.01; post-session: Experimental Group (n = 70) = 0.33 ± 0.01, Control Group (n = 67) = 0.33 ± 0.01). d, Functional connectivity in the FPN (pre-session: Experimental Group (n = 75) = 0.27 ± 0.01, Control Group (n = 72) = 0.25 ± 0.01; post-session: Experimental Group (n = 70) = 0.27 ± 0.01, Control Group (n = 67) = 0.26 ± 0.01). e, Changes in fractional anisotropy of right fronto-striatal structural connectivity (pre-session: Experimental Group (n = 75) = 0.41 ± 0.002, Control Group (n = 72) = 0.41 ± 0.003; post-session: Experimental Group (n = 70) = 0.41 ± 0.002, Control Group (n = 67) = 0.41 ± 0.003). f, Changes in mean diffusivity of right fronto-striatal structural connectivity (pre-session: Experimental Group (n = 75) = 0.00088 ± 0.000003, Control Group (n = 72) = 0.00088 ± 0.000003; post-session: Experimental Group (n = 70) = 0.00088 ± 0.000003, Control Group (n = 67) = 0.00087 ± 0.000004). FA, fractional anisotropy; MD, mean diffusivity. Source data
Fig. 5
Fig. 5. Long-term near transfer.
a, Percentage correct stop remained increased significantly in the Experimental Group 1 year after training (pre-session: Experimental Group (n = 109) = 0.56 ± 0.008, Control Group (n = 109) = 0.56 ± 0.007; post-session: Experimental Group (n = 107) = 0.61 ± 0.008, Control Group (n = 106) = 0.56 ± 0.008). b, Go RT remained increased significantly in the Experimental Group 1 year after training (pre-session: Experimental Group (n = 118) = 590.52 ± 9.93, Control Group (n = 116) = 580.42 ± 9.42; post-session: Experimental Group (n = 109) = 674.67 ± 9.18, Control Group (n = 109) = 603.75 ± 9.28). Source data
Fig. 6
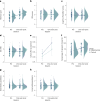
Fig. 6. Long-term far transfer.
ac, Changes in three executive function (EF) tasks 1 year after training: Corsi memory span (pre-session: Experimental Group (n = 117) = 5.36 ± 0.085, Control Group (n = 116) = 5.42 ± 0.080; post-session: Experimental Group (n = 110) = 6.41 ± 0.074, Control Group (n = 107) = 6.41 ± 0.071); PBI scores (pre-session: Experimental Group (n = 118) = 0.037 ± 0.050, Control Group (n = 116) = 0.020 ± 0.044; post-session: Experimental Group (n = 110) = 0.030 ± 0.047, Control Group (n = 108) = 0.066 ± 0.049); and cognitive flexibility cores (pre-session: Experimental Group (n = 114) = −0.024 ± 0.048, Control Group (n = 112) = −0.063 ± 0.053; post-session: Experimental Group (n = 109) = −0.103 ± 0.053, Control Group (n = 108) = −0.010 ± 0.055). df, Changes in three decision-making task variables: DG offer (pre-session: Experimental Group (n = 116) = 2.0 ± 0.10, Control Group (n = 113) = 1.77 ± 0.11; post-session: Experimental Group (n = 83) = 1.94 ± 0.15, Control Group (n = 80) = 2.07 ± 0.012); unfair offer acceptance (pre-session: Experimental Group (n = 116) = 0.43 ± 0.046, Control Group (n = 113) = 0.41 ± 0.046; post-session: Experimental Group (n = 83) = 0.54 ± 0.0555, Control Group (n = 80) = 0.48 ± 0.056); and percentage of delayed choice (pre-session: Experimental Group (n = 116) = 38.55 ± 3.06, Control Group (n = 112) = 38.80 ± 3.21; post-session: Experimental Group (n = 82) = 65.58 ± 3.33, Control Group (n = 78) = 64.03 ± 3.60). g,h, Changes in mental health, separated by internalizing problems (pre-session: Experimental Group (n = 96) = −0.008 ± 0.08, Control Group (n = 90) = 0.008 ± 0.10; post-session: Experimental Group (n = 81) = 0.061 ± 0.11, Control Group (n = 81) = −0.061 ± 0.13) and externalizing problems (pre-session: Experimental Group (n = 96) = 0.11 ± 0.10, Control Group (n = 90) = −0.12 ± 0.09; post-session: Experimental Group (n = 81) = 0.10 ± 0.12, Control Group (n = 81) = −0.10 ± 0.09). Source data
Extended Data Fig. 1
Extended Data Fig. 1. Correlation plots of associations between cognitive control and domains before training.
Significant associations were found between cognitive control performance and Academic performance (t(217) = 2.53, p = 0.0120, 95%CI = [0.0376, 0.295]), WASI fluid reasoning (t(216) = 2.27, p = 0.0240, 95%CI = [0.0203, 0.2800]), delay of gratification (t(226) = 2.44, p = 0.015, 95%CI = [0.0310, 0.2843]), externalising symptoms (t(184) = −2.15, p = 0.032, 95%CI = [−0.2940, −0.0131]), and mean diffusivity of right fronto-striatal tracts (t(145) = −2.81, p = 0.005, 95%CI = [−0.3754, −0.0679]) using one-way.
Extended Data Fig. 2
Extended Data Fig. 2. Training effect before and after COVID-19 lockdown.
a, Changes in Apathy before and after COVID-19 lockdown (pre-COVID: Experimental Group (n = 95) = 28.85 ± 0.67, Control Group (n = 88) = 27.66 ± 0.65; post-COVID: Experimental Group (n = 82) = 32.77 ± 0.94, Control Group (n = 83) = 30.57 ± 0.93). Apathy in both groups increased significantly after lockdown. b, Changes in Strength & Difficulties scores (pre-COVID: Experimental Group (n = 95) = 7.53 ± 0.46, Control Group (n = 89) = 6.86 ± 0.51; post-COVID: Experimental Group (n = 82) = 8.15 ± 0.58, Control Group (n = 83) = 6.83 ± 0.50).

Similar articles

Cited by

References

    1. Diamond A. Executive functions. Annu. Rev. Psychol. 2013;64:135–168. - PMC - PubMed
    1. Hoffmann F, Singer T, Steinbeis N. Children’s increased emotional egocentricity compared to adults is mediated by age-related differences in conflict processing. Child Dev. 2015;86:765–780. - PubMed
    1. McAuliffe K, Blake PR, Steinbeis N, Warneken F. The developmental foundations of human fairness. Nat. Hum. Behav. 2017;1:0042.
    1. Steinbeis, N. Taxing behavioral control diminishes sharing and costly punishment in childhood. Dev. Sci.21, e12492 (2018). - PubMed
    1. Steinbeis N, Bernhardt BC, Singer T. Impulse control and underlying functions of the left DLPFC mediate age-related and age-independent individual differences in strategic social behavior. Neuron. 2012;73:1040–1051. - PubMed

Publication types

LinkOut - more resources