. 2024 Jun 4;14(1):12811.
doi: 10.1038/s41598-024-63588-6.

Transcriptional profiling links unique human macrophage phenotypes to the growth of intracellular Salmonella enterica serovar Typhi

Affiliations

Transcriptional profiling links unique human macrophage phenotypes to the growth of intracellular Salmonella enterica serovar Typhi

Ruth Schade et al. Sci Rep. .

Abstract

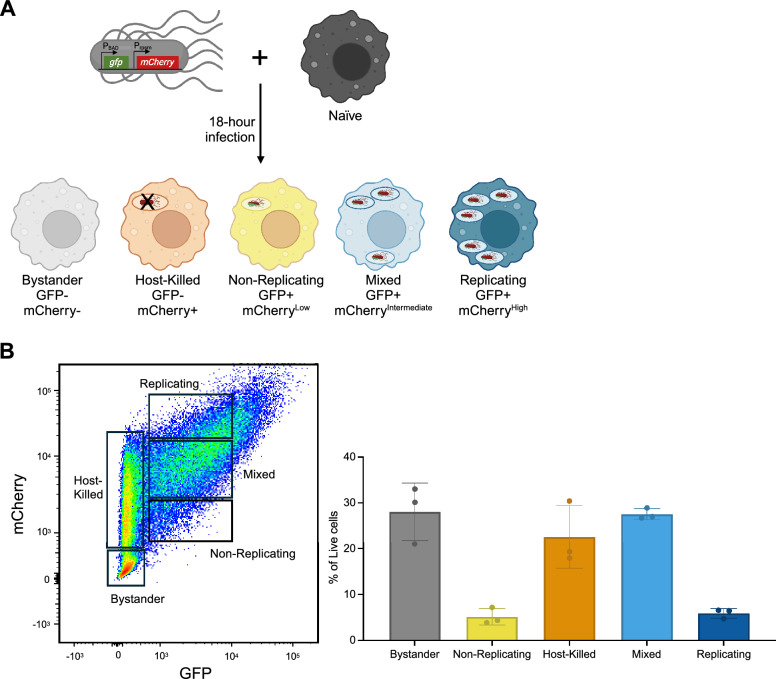
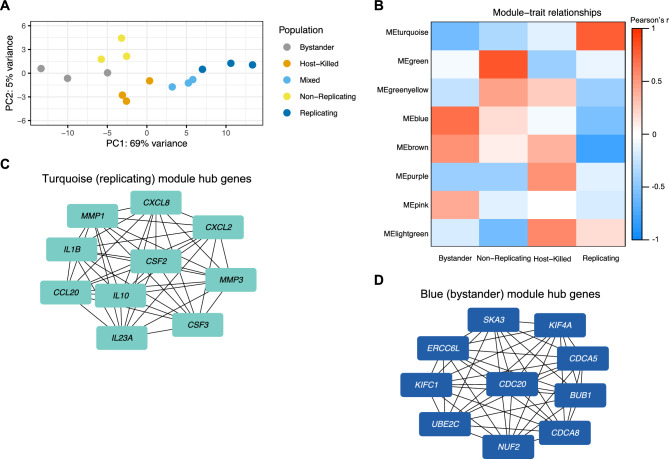
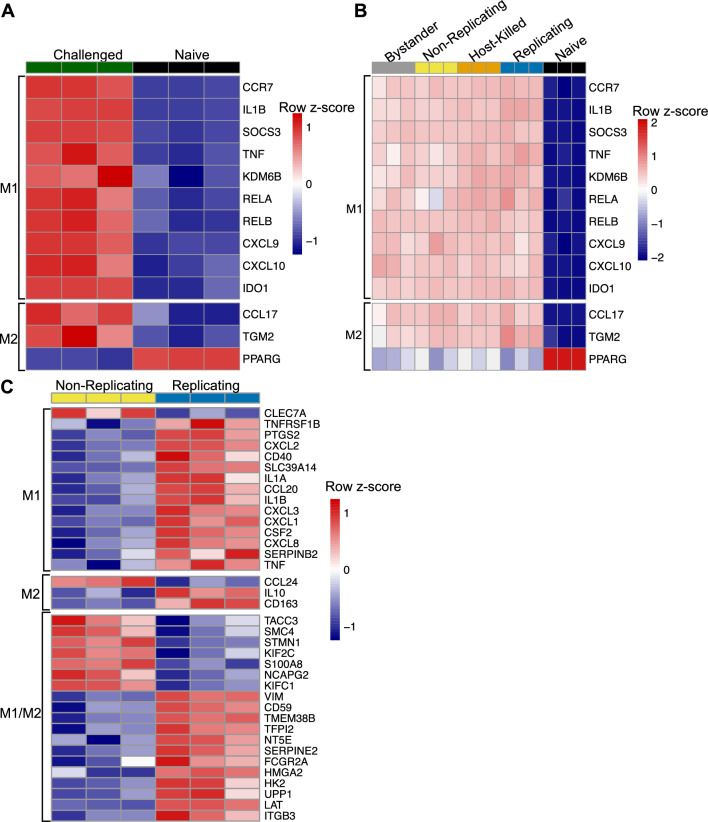
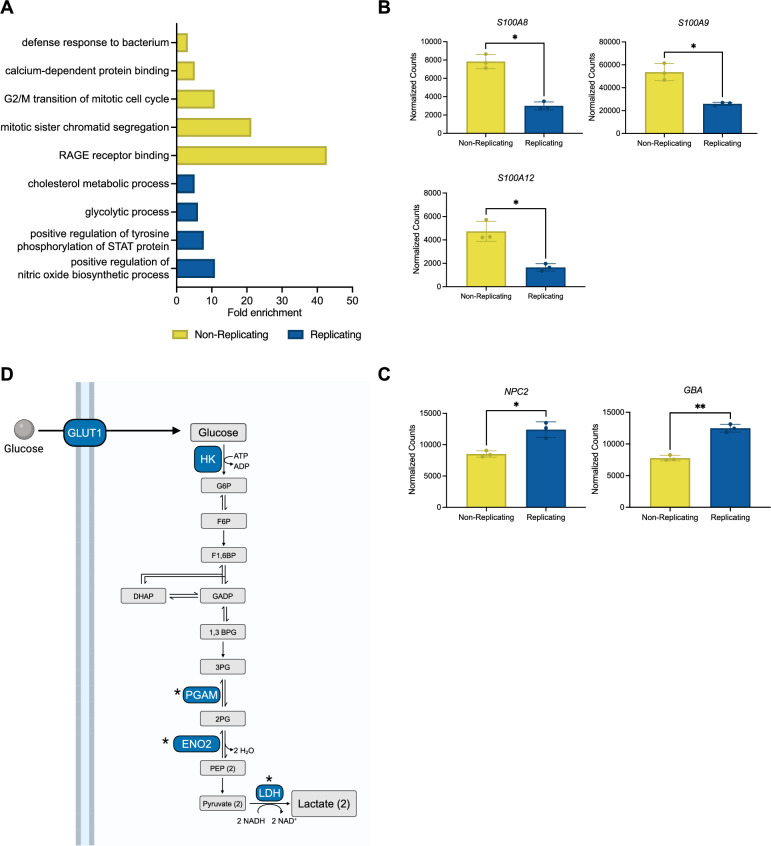
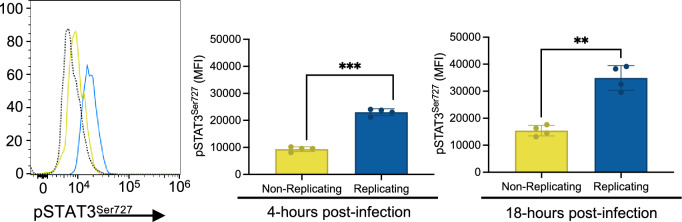
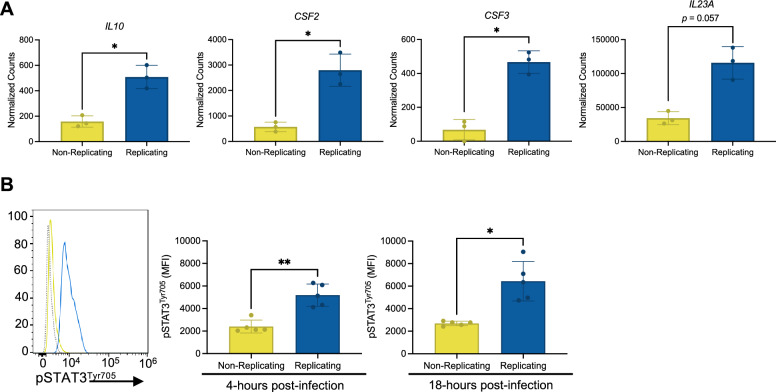
Macrophages provide a crucial environment for Salmonella enterica serovar Typhi (S. Typhi) to multiply during typhoid fever, yet our understanding of how human macrophages and S. Typhi interact remains limited. In this study, we delve into the dynamics of S. Typhi replication within human macrophages and the resulting heterogeneous transcriptomic responses of macrophages during infection. Our study reveals key factors that influence macrophage diversity, uncovering distinct immune and metabolic pathways associated with different stages of S. Typhi intracellular replication in macrophages. Of note, we found that macrophages harboring replicating S. Typhi are skewed towards an M1 pro-inflammatory state, whereas macrophages containing non-replicating S. Typhi exhibit neither a distinct M1 pro-inflammatory nor M2 anti-inflammatory state. Additionally, macrophages with replicating S. Typhi were characterized by the increased expression of genes associated with STAT3 phosphorylation and the activation of the STAT3 transcription factor. Our results shed light on transcriptomic pathways involved in the susceptibility of human macrophages to intracellular S. Typhi replication, thereby providing crucial insight into host phenotypes that restrict and support S. Typhi infection.


Conflict of interest statement

The authors declare no competing interests.

Figures

Figure 1
Figure 1
Human macrophages have a heterogeneous response to S. Typhi infection. (A) Schematic of the experimental design used to assess responses of differentiated THP-1 cells to S. Typhi infection 18 h post-infection. Differentiated THP-1 macrophages were infected with S. Typhi harboring a fluorescence-dilution reporter plasmid, pFCcGi, with mCherry controlled by the constitutively active rpsM promoter and gfp controlled by the L-arabinose inducible BAD promoter. The GFP and mCherry signals used to classify the THP-1 macrophage populations via flow cytometry are indicated under each macrophage. (B) Gating strategy to sort five different populations of differentiated THP-1 macrophages at 18-h post-infection with S. Typhi (left panel). The majority of GFP+ THP-1 macrophages were mCherryintermediate, which were defined as containing a mix of replicating and non-replicating S. Typhi. Macrophages with an mCherry signal higher than the mixed population were considered to contain replicating S. Typhi, and those with an mCherry signal lower than the mixed population were considered to harbor non-replicating S. Typhi. Macrophages with a GFP signal higher than was seen in the mixed population were considered outliers and thus were not collected. Frequency of the five populations of THP-1 macrophages from each of the 3 sorts for RNA-Seq based on mCherry and GFP expression (right panel).
Figure 2
Figure 2
Two modules of co-expressed genes characterize macrophage populations challenged with S. Typhi. (A) Principal component analysis of THP-1 macrophages challenged with S. Typhi. (B) Gene modules from Weighted Gene Co-expression Network Analysis that correlated with the different challenged populations and were not impacted by batch effects. Strength and direction of correlations between modules and populations are indicated by the blue to red scale. (C and D) The top ten hub genes from STRING protein–protein interaction network analysis completed with the most significant genes from the turquoise (replicating) and blue (bystander) modules; significant genes were chosen based on module membership and gene significance scores.
Figure 3
Figure 3
Macrophage polarization phenotypes are associated with differences in intracellular S. Typhi infection and replication. (A) Heatmap displaying gene expression in naïve hMDMs and hMDMs challenged with S. Typhi for 8-h. The hMDM gene expression dataset is from a publicly available RNA-Seq dataset (PRJNA721701). The genes included in this heatmap are commonly used to define M1 and M2 polarization in hMDMs,. (B) Heatmap showing gene expression in the different populations of THP-1 macrophages challenged with S. Typhi and naive THP-1 macrophage controls. The genes included in this heatmap are commonly used to define M1 and M2 polarization in hMDMs ,. (C) Heatmap showing expression of M1, M2, and M1/M2 genes from our compiled list (Supplementary Table S6). Genes shown here were significantly differentially expressed between the replicating and non-replicating populations (adjusted p-value < 0.01) For all heatmaps, the fill color is based on relative expression of each gene determined by row z-scores.
Figure 4
Figure 4
Macrophages harboring replicating versus non-replicating S. Typhi show enrichment in different immune and metabolic pathways. (A) Significant GO terms from pathway analysis using genes significantly differentially expressed between the replicating and non-replicating populations (adjusted p-value < 0.01). Pathway analysis was completed with DAVID,, which determines fold enrichment by calculating the ratio of genes in the user’s list in relation to the genes in the designated pathway. (B) Normalized count data for top genes in RAGE receptor binding and calcium-dependent protein binding pathways that are enriched in macrophages harboring non-replicating bacteria. (C) Normalized count data for the top genes in the cholesterol metabolism pathway. (D) Schematic representation of glucose uptake and glycolysis pathways. Grey boxes represent metabolites. Proteins encoded by genes that are differentially expressed in macrophages harboring replicating S. Typhi are shown in blue boxes. Asterisks indicate genes with significantly different expression between macrophages housing replicating versus non-replicating S. Typhi based on paired t-tests (* indicates p < 0.05).
Figure 5
Figure 5
Macrophages containing replicating S. Typhi had elevated phosphorylation of STAT3 at the serine 727 residue. THP-1 macrophages were infected with S. Typhi pFCcGi. At 4- and 18-h post-infection (hpi), cells were collected and STAT3 phosphorylation at Ser727 was measured via phospho-flow cytometry. The histogram depicts fluorescence of pSTAT3Ser727 in macrophages containing non-replicating S. Typhi (yellow), macrophages containing replicating S. Typhi (blue), and macrophages serving as an unstained control (dotted line). Median fluorescence intensity of pSTAT3Ser727 in the two populations of challenged macrophages at 4- and 18-hpi is shown in the bar plots to the right of the histogram. Data shown includes samples from independent experiments; n = 2 for both experiments.
Figure 6
Figure 6
Macrophages containing replicating S. Typhi had elevated phosphorylation of STAT3 at the tyrosine 705 residue. (A) Normalized count data from RNA-Seq on macrophages containing non-replicating S. Typhi versus replicating S. Typhi. The genes shown encode cytokines that are upstream regulators of STAT3 phosphorylation at the Tyr705 residue. (B) THP-1 macrophages were infected with S. Typhi pFCcGi. At 4- and 18-h post-infection (hpi), cells were collected and STAT3 phosphorylation at Tyr705 was measured via phospho-flow cytometry. The histogram depicts fluorescence of pSTAT3Tyr705 in macrophages containing non-replicating S. Typhi (yellow), macrophages containing replicating S. Typhi (blue), and macrophages serving as an unstained control (dotted line). Median fluorescence intensity of pSTAT3Tyr705 in the two populations of challenged macrophages at 4- and 18-hpi is shown in the bar plots to the right of the histogram. Data shown includes samples from independent experiments; n = 2 and n = 3.

Similar articles

Cited by

References

    1. Barton AJ, Hill J, Blohmke CJ, Pollard AJ. Host restriction, pathogenesis and chronic carriage of typhoidal Salmonella. FEMS Microbiol. Rev. 2021;45(5):fuab014. doi: 10.1093/femsre/fuab014. - DOI - PMC - PubMed
    1. Crump JA. Progress in typhoid fever epidemiology. Clin. Infect. Dis. 2019;68:S4–S9. doi: 10.1093/cid/ciy846. - DOI - PMC - PubMed
    1. Dyson ZA, Klemm EJ, Palmer S, Dougan G. Antibiotic resistance and typhoid. Clin. Infect. Dis. 2019;68:S165–S170. doi: 10.1093/cid/ciy1111. - DOI - PMC - PubMed
    1. Vazquez-Torres A, et al. Extraintestinal dissemination of Salmonella by CD18-expressing phagocytes. Nature. 1999;401:804–808. doi: 10.1038/44593. - DOI - PubMed
    1. Schwan WR, Huang X-Z, Hu L, Kopecko DJ. Differential bacterial survival, replication, and apoptosis-inducing ability of Salmonella serovars within human and murine macrophages. Infect. Immun. 2000;68:1005–1013. doi: 10.1128/IAI.68.3.1005-1013.2000. - DOI - PMC - PubMed

Substances