

Environmental and structural factors associated with bacterial diversity in household dust across the Arizona-Sonora border
- PMID: 38834753
- PMCID: PMC11150412
- DOI: 10.1038/s41598-024-63356-6
Environmental and structural factors associated with bacterial diversity in household dust across the Arizona-Sonora border
Abstract
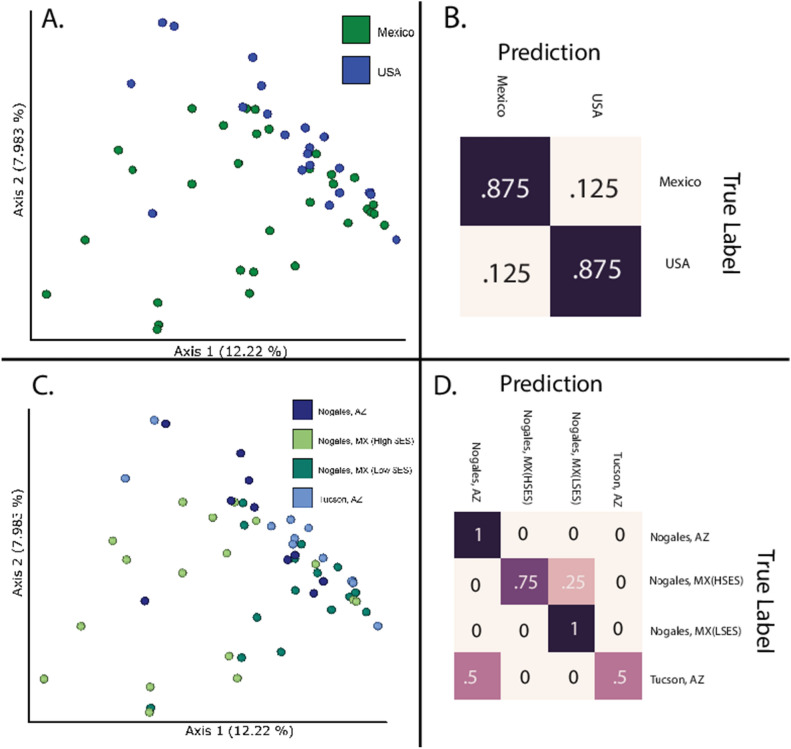
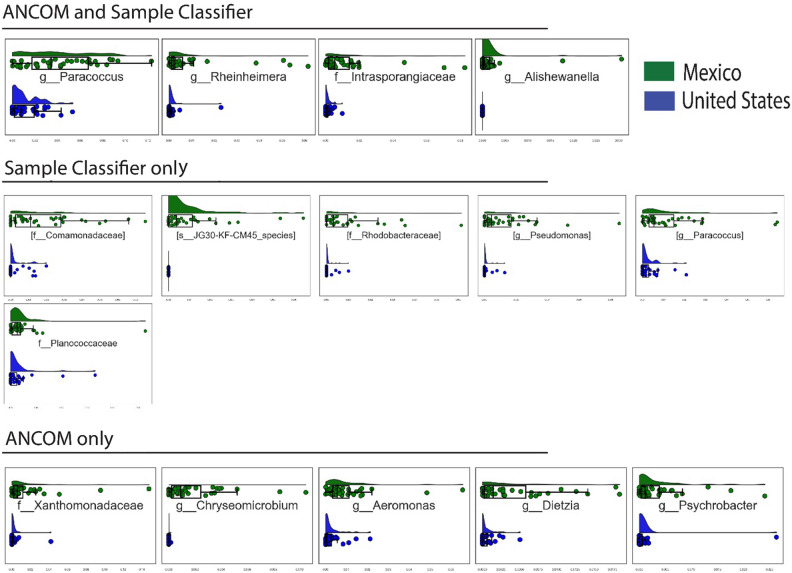
We previously reported that asthma prevalence was higher in the United States (US) compared to Mexico (MX) (25.8% vs. 8.4%). This investigation assessed differences in microbial dust composition in relation to demographic and housing characteristics on both sides of the US-MX Border. Forty homes were recruited in the US and MX. Home visits collected floor dust and documented occupants' demographics, asthma prevalence, housing structure, and use characteristics. US households were more likely to have inhabitants who reported asthma when compared with MX households (30% vs. 5%) and had significantly different flooring types. The percentage of households on paved roads, with flushing toilets, with piped water and with air conditioning was higher in the US, while dust load was higher in MX. Significant differences exist between countries in the microbial composition of the floor dust. Dust from Mexican homes was enriched with Alishewanella, Paracoccus, Rheinheimera genera and Intrasporangiaceae family. A predictive metagenomics analysis identified 68 significantly differentially abundant functional pathways between US and MX. This study documented multiple structural, environmental, and demographic differences between homes in the US and MX that may contribute to significantly different microbial composition of dust observed in these two countries.
© 2024. The Author(s).
Conflict of interest statement
Benton, L., Lopez-Galvez, N., Caporaso, JG., Herman, C., Cope E.K., Gameros, M., Rosales, C., Wright, A., Beamer, P., Lothrop, N., declares that they have no financial interests. Carr, T., has received consulting and advisory work for AstraZeneca, GlaxoSmithKline, Genentech, Novartis and royalties for writing from WoltersKluwer (UptoDate). Martínez, F., declares the following grants NIH: HL139054, HL130045, HL132523, HL147016, AI135108, AI146131, AI148104, AI149754, AI176305, HD104618, UH30OD023282; OM PHARMA: UANLID46205; American Lung Association: LTR DTD 4/12/16; and consultancy with OM PHARMA.
Figures
Update of
-
Environmental and Structural Factors Associated with Bacterial Diversity in Household Dust Across the Arizona-Sonora Border.Res Sq [Preprint]. 2023 Sep 29:rs.3.rs-3325336. doi: 10.21203/rs.3.rs-3325336/v1. Res Sq. 2023. Update in: Sci Rep. 2024 Jun 4;14(1):12803. doi: 10.1038/s41598-024-63356-6. PMID: 37841844 Free PMC article. Updated. Preprint.
References
MeSH terms
Substances
Grants and funding
LinkOut - more resources
Full Text Sources
