. 2024 Jun 4;7(1):685.
doi: 10.1038/s42003-024-06297-0.

A culture method with berbamine, a plant alkaloid, enhances CAR-T cell efficacy through modulating cellular metabolism

Affiliations

A culture method with berbamine, a plant alkaloid, enhances CAR-T cell efficacy through modulating cellular metabolism

Shin-Ichiro Takayanagi et al. Commun Biol. .

Abstract

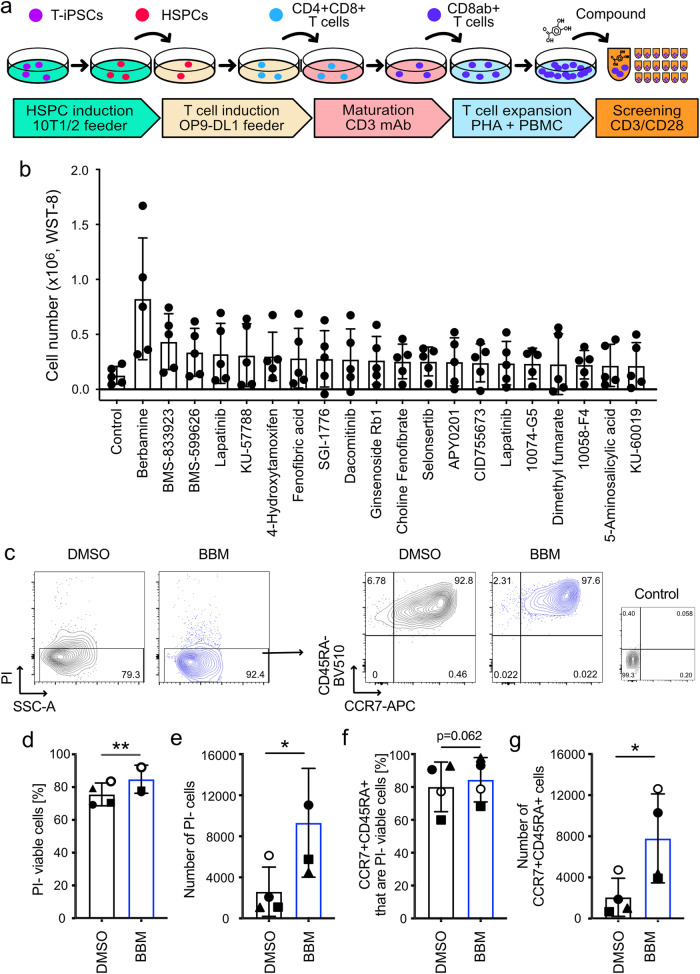
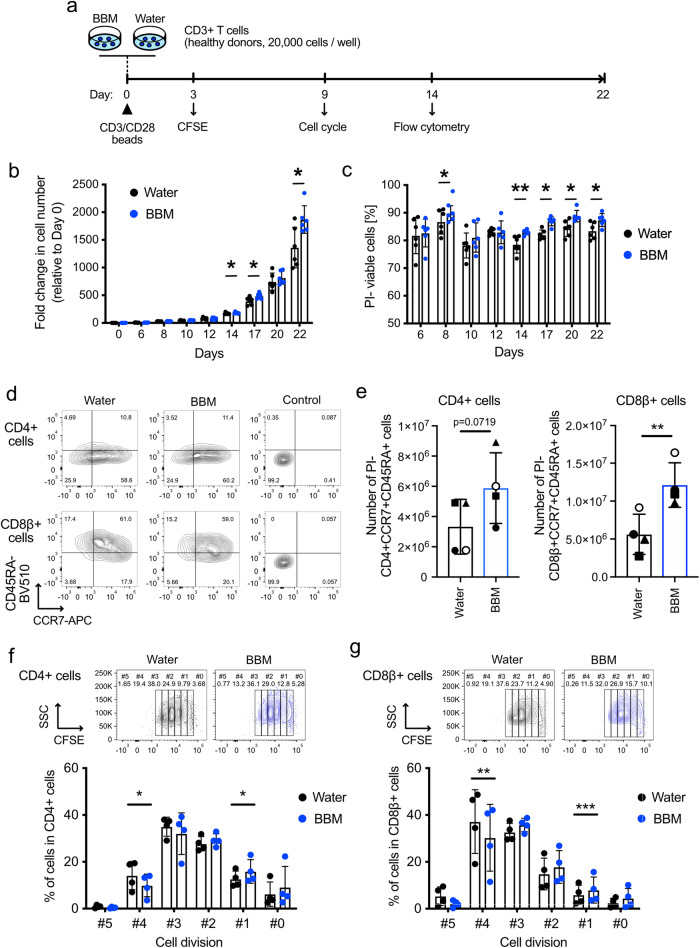
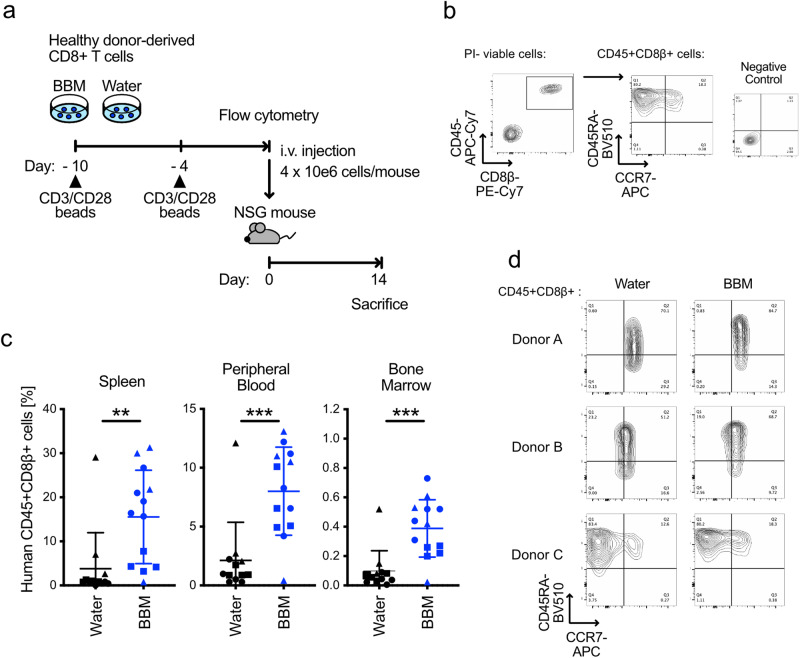
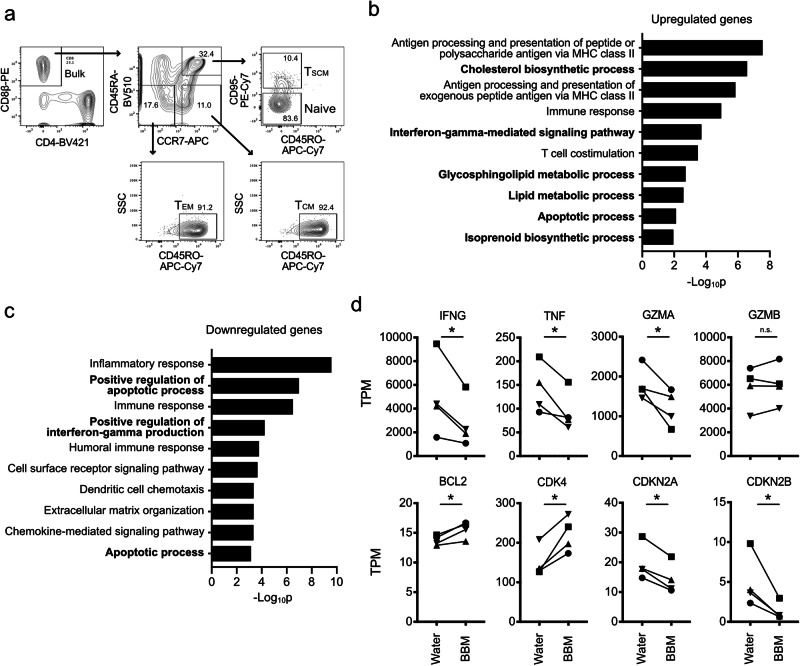
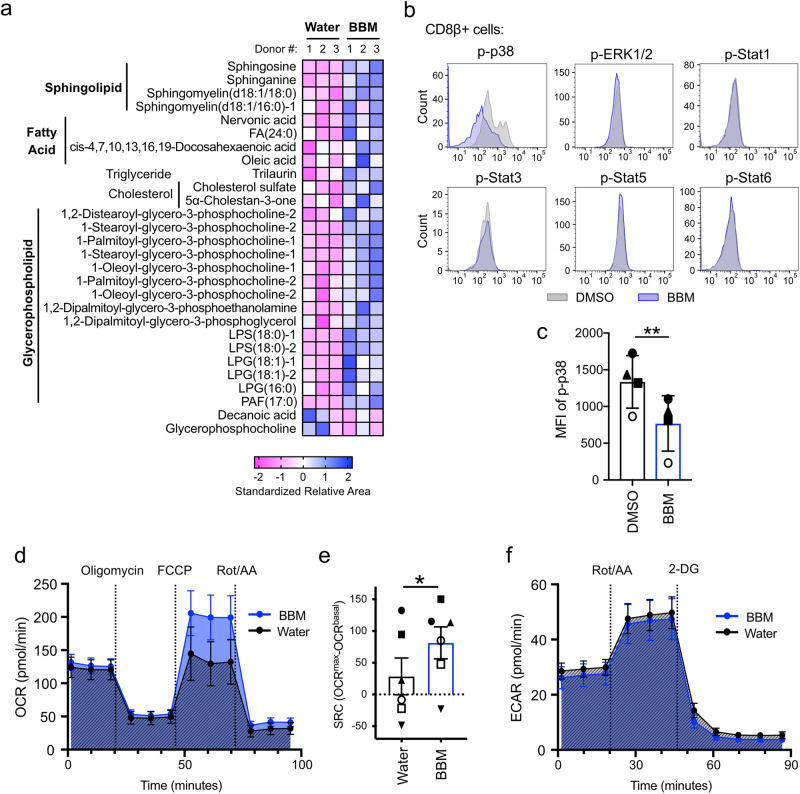
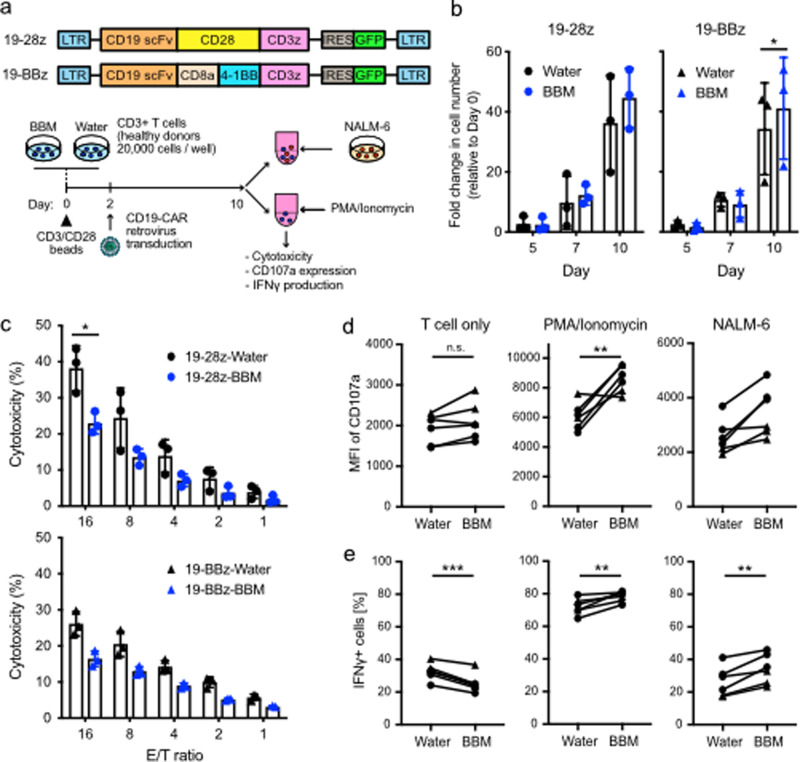
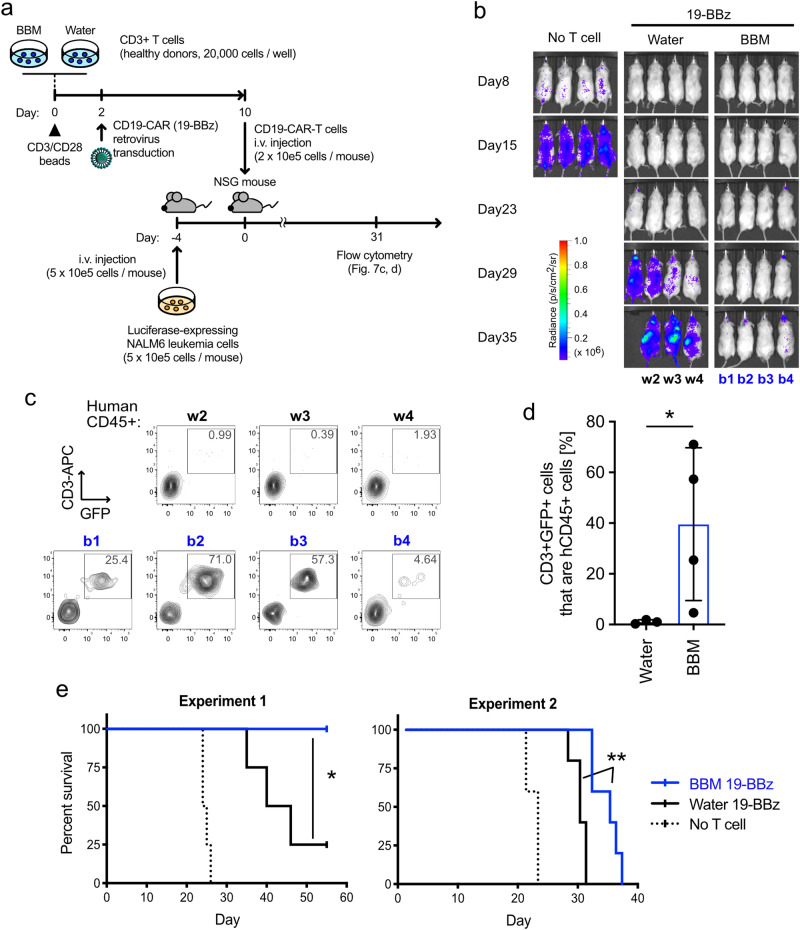
Memory T cells demonstrate superior in vivo persistence and antitumor efficacy. However, methods for manufacturing less differentiated T cells are not yet well-established. Here, we show that producing chimeric antigen receptor (CAR)-T cells using berbamine (BBM), a natural compound found in the Chinese herbal medicine Berberis amurensis, enhances the antitumor efficacy of CAR-T cells. BBM is identified through cell-based screening of chemical compounds using induced pluripotent stem cell-derived T cells, leading to improved viability with a memory T cell phenotype. Transcriptomics and metabolomics using stem cell memory T cells reveal that BBM broadly enhances lipid metabolism. Furthermore, the addition of BBM downregulates the phosphorylation of p38 mitogen-activated protein kinase and enhanced mitochondrial respiration. CD19-CAR-T cells cultured with BBM also extend the survival of leukaemia mouse models due to their superior in vivo persistence. This technology offers a straightforward approach to enhancing the antitumor efficacy of CAR-T cells.


Conflict of interest statement

S-i.T., S.C., K.F., A.K., Y.Kawai, and Sh.K. declare a patent titled Production method for T cells or NK cells, medium for culturing T cells or NK cells, method for culturing T cells or NK cells, method for maintaining undifferentiated state of undifferentiated T cells, and growth-accelerating agent for T cells or NK cells’ (WO2020116606) related to this work. S-i.T., S.C., S.H., K.F., N.W., N.O., Y.Kurimoto., A.F., A.K., M.K., and H.N. are employed by Kirin Holdings, Co., Ltd. Sh.K. is a founder, shareholder, and board member at Shinobi Therapeutics, Inc., and received research fundings from Kirin Holdings, Co., Ltd., Takeda Pharmaceutical Co., Ltd., Shinobi Therapeutics, Inc., Astellas Co., Ltd., Terumo Co., Ltd., and Tosoh Co., Ltd. The remaining authors declare no competing interests.

Figures

Fig. 1
Fig. 1. Screening of chemical compounds using the iPS-derived T cells.
a T cell differentiation scheme from T-iPSCs for screening chemical compounds. Expanded T-iPS-T cells were stimulated with CD3/CD28 microbeads and then incubated with compounds. All data presented in Fig. 1 were acquired 6 d later. b Cell numbers based on intracellular dehydrogenase activity. Error bars indicate the standard deviation (SD) of five independent experiments. c Representative FACS plots 6 d after the addition of the compounds. d Percentage and e number of PI-viable cells determined with flow cytometry. f Percentage and g number of CCR7+CD45RA+ cells. Error bars indicate the SD of four independent experiments (cf). Statistical significance is denoted as follows: *p < 0.05; **p < 0.01; and ***p < 0.001 (paired t-test).
Fig. 2
Fig. 2. Effects of BBM on human healthy donor-derived T cells.
a Experimental scheme for characterizing the effect of BBM on primary CD3+ T cells. b Fold changes in cell number and c viability determined using the standard trypan blue method. Error bars indicate SD from six donors. d Representative FACS plots illustrating the expression of CCR7 and CD45RA in CD4+ cells (top) and CD8β+ cells (bottom) on day 14. e Estimated numbers of CD4+CCR7+CD45RA+ cells (left) and CD8β+CCR7+CD45RA+ cells (right) in cultured CD3+ T cells calculated from the total cell number and frequencies of the populations that are PI- on day 14. f, g Results of the CFSE assay in CD4+ (f) and CD8β+ (g) fractions within CD3+ cells on day 3. Error bars indicate SD from six (b, c) or four donors (eg). Statistical significance is denoted as follows: *p < 0.05; **p < 0.01; and ***p < 0.001 (paired t-test).
Fig. 3
Fig. 3. In vivo persistence of primary T cells derived from healthy donors.
a Experimental scheme designed to assess the in vivo persistence of BBM-treated primary CD8+ T cells. b Gating strategy employed to determine the expression of CCR7 and CD45RA in the CD45+CD8β+ fractions. c Frequencies of injected CD45+CD8β+ cells in the spleen (left), peripheral blood (center), and bone marrow (right) on day 14. Each data point represents one injected mouse and its corresponding donors: circle; donor A, triangle; donor B, square; donor C. All error bars indicate SD. Statistical significance is denoted as follows: *p < 0.05; **p < 0.01; and ***p < 0.001 (unpaired t-test). d Representative flow cytometry plots of CCR7 and CD45RA in CD45+CD8β+ cells in the spleen samples.
Fig. 4
Fig. 4. Gene expression analysis in BBM-treated stem cell memory T cells.
a Gating strategy for FACS to purify the naïve and memory T cell fractions from healthy donor-derived CD8+ cells. b, c Gene ontology analysis of DEGs in BBM-treated TSCM cells. Upregulated (b) or downregulated (c) genes from RNA-sequencing results on day 12. Genes were queried in the DAVID functional annotation database. d Transcripts per million (TPM) values of cell cycle-related and effector function-related genes. Statistical significance is denoted as follows: *p < 0.05; **p < 0.01; and ***p < 0.001 (n = 4, paired t-test). TSCM stem cell memory T, TCM central memory T, TEM effector memory T.
Fig. 5
Fig. 5. Effect of BBM on metabolism and signaling pathways in primary T cells.
a Metabolomics of BBM-treated TSCM cells from healthy donor-derived CD8+ cells. Lipids commonly upregulated or downregulated in all three donors are shown. b Representative flow cytometry plots of Phosflow assay in BBM-treated CD3+ cells on day 10. Phosphorylated proteins in CD8+ T cells are shown. c Mean fluorescence intensity (MFI) of phosphorylated p38 in CD8+ T cells. Error bars indicate SD from four donors. d Oxygen consumption rate (OCR) across time for BBM-treated CD3+ T cells. e Spare respiratory capacity (SRC) calculated by OCRmax-OCRbasal. f Extracellular acidification rates (ECAR) across time for BBM-treated CD3+ T cells. Error bars indicate the standard error of the mean from six donors (df). Statistical significance is denoted as follows: *p < 0.05; **p < 0.01; and ***p < 0.001 (paired t-test) (c, e).
Fig. 6
Fig. 6. Effector functions of second-generation CAR-T cells.
a CD19-CAR retrovirus vectors (top) and an experimental scheme for in vitro assays. b Assessment of cell proliferation among CD3+ T cells transduced with CD19-CAR (CAR-T cells). Fold expansion rates compared to Day 0 were shown. c Evaluation of in vitro cytotoxicity of CAR-T cells against CD19-expressing NALM6 cells. E/T ratio effector/target ratio. Error bars indicate SD from three donors (b, c). d Expression of CD107a and e IFNγ production in CAR-T cells that were stimulated with PMA plus Ionomycin (PMA/Ionomycin), NALM6 cells, or unstimulated control (T cell only). Circle; 19-28z, triangle; 19-BBz. Statistical significance is denoted as follows: *p < 0.05; **p < 0.01; and ***p < 0.001 (paired t-test).
Fig. 7
Fig. 7. Berbamine improves the therapeutic effect of CAR-T cells.
a Experimental scheme of the in vivo assays. Bioluminescence in Luciferase-expressing NALM6 cells were monitored to measure the amount of leukemia burden. CD19-CAR with 4-1BB costimulatory domain (19-BBz) was transduced into primary CD3+ T cells and cultured with BBM or water. After 10 days of cultivation, CD19-CAR-T cells (2 × 105 cells/mouse) were injected into each leukemia mouse model. b IVIS images to monitor NALM6 cells. The scale bar represents the bioluminescence signal in radiance (p/s/cm2/sr). c Representative flow cytometry plots and d percentages CD3+ GFP+ cells that are hCD45+ cells in peripheral blood on day 31. Statistics: Mann–Whitney test. e Kaplan–Meier survival analysis. Statistics: log-rank Mantel–Cox test. Statistical significance is denoted as follows: *p < 0.05; **p < 0.01; and ***p < 0.001.

Similar articles

Cited by

References

    1. Rosenberg SA, Restifo NP. Adoptive cell transfer as personalized immunotherapy for human cancer. Science. 2015;348:62–68. doi: 10.1126/science.aaa4967. - DOI - PMC - PubMed
    1. Xu X, et al. Mechanisms of relapse after CD19 CAR T-cell therapy for acute lymphoblastic leukemia and its prevention and treatment strategies. Front. Immunol. 2019;10:2664. doi: 10.3389/fimmu.2019.02664. - DOI - PMC - PubMed
    1. Orlando EJ, et al. Genetic mechanisms of target antigen loss in CAR19 therapy of acute lymphoblastic leukemia. Nat. Med. 2018;24:1504–1506. doi: 10.1038/s41591-018-0146-z. - DOI - PubMed
    1. Hay KA, Turtle CJ. Chimeric antigen receptor (CAR) T cells: lessons learned from targeting of CD19 in B-cell malignancies. Drugs. 2017;77:237–245. doi: 10.1007/s40265-017-0690-8. - DOI - PMC - PubMed
    1. Porter DL, et al. Chimeric antigen receptor T cells persist and induce sustained remissions in relapsed refractory chronic lymphocytic leukemia. Sci. Transl. Med. 2015;7:303ra139. doi: 10.1126/scitranslmed.aac5415. - DOI - PMC - PubMed

Publication types

MeSH terms