

Proteomic analysis of cardiorespiratory fitness for prediction of mortality and multisystem disease risks
- PMID: 38834850
- PMCID: PMC11186767
- DOI: 10.1038/s41591-024-03039-x
Proteomic analysis of cardiorespiratory fitness for prediction of mortality and multisystem disease risks
Abstract
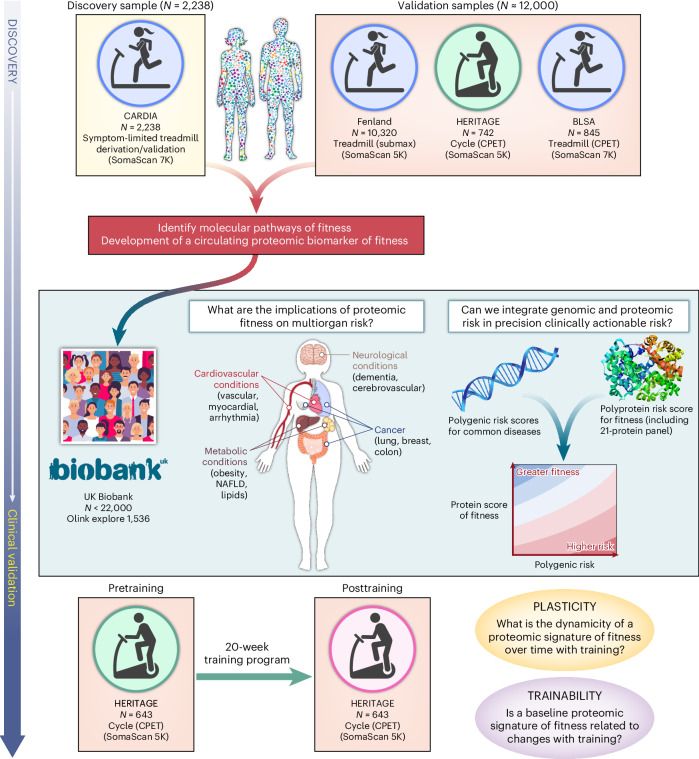
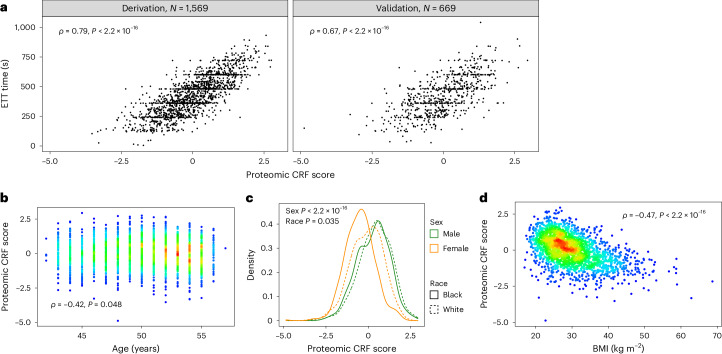
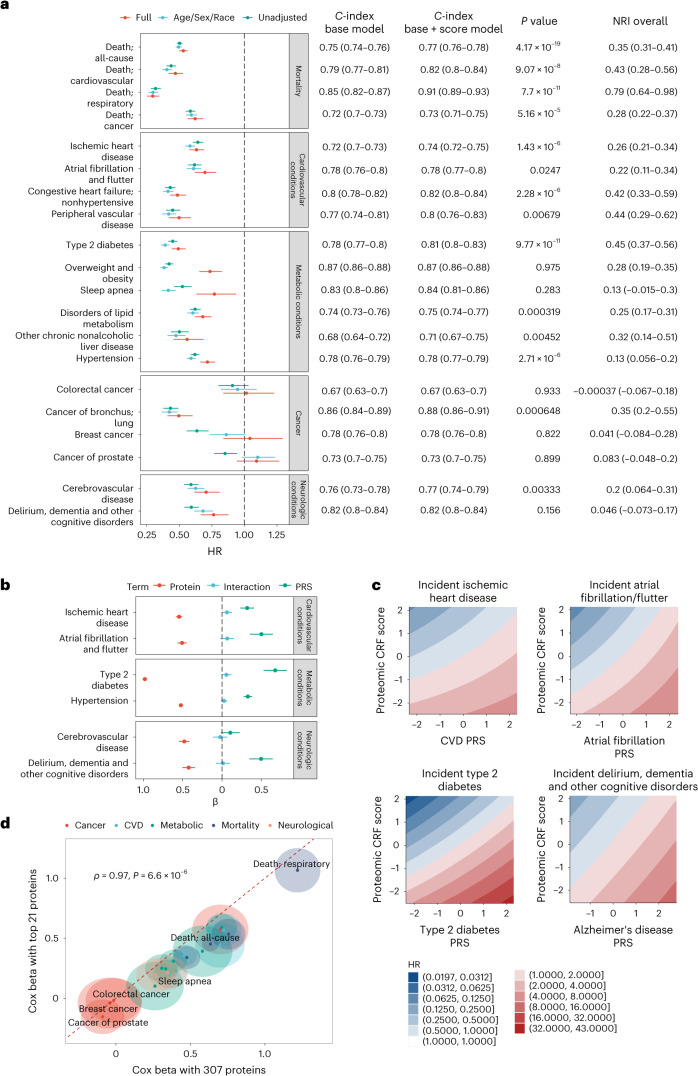
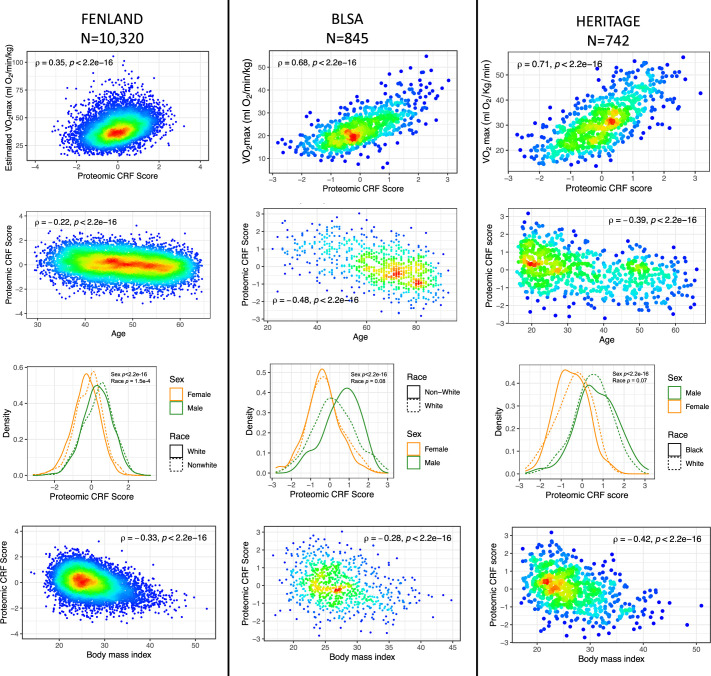
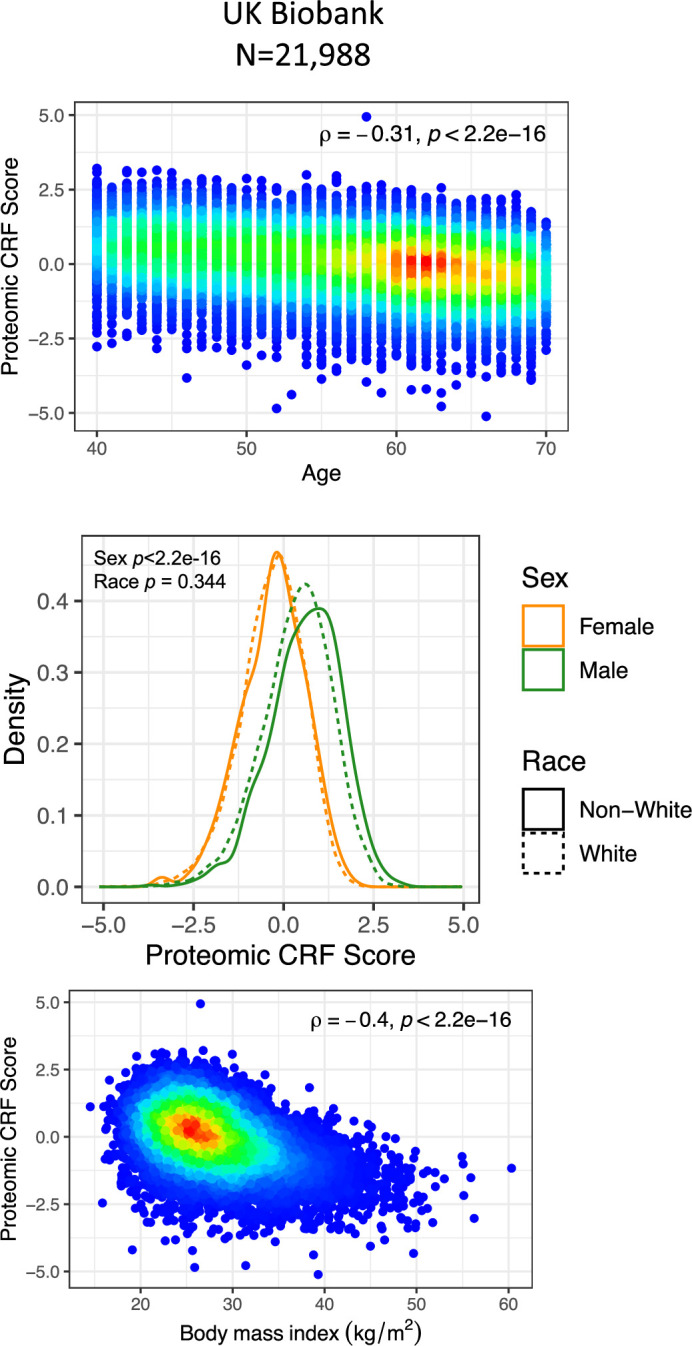
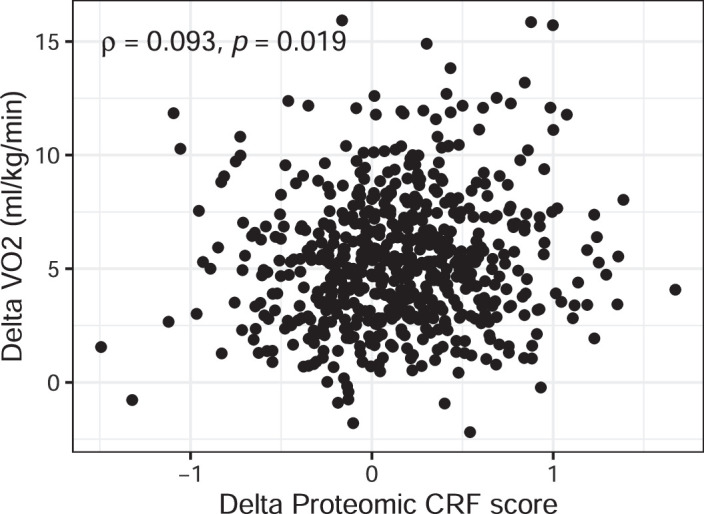
Despite the wide effects of cardiorespiratory fitness (CRF) on metabolic, cardiovascular, pulmonary and neurological health, challenges in the feasibility and reproducibility of CRF measurements have impeded its use for clinical decision-making. Here we link proteomic profiles to CRF in 14,145 individuals across four international cohorts with diverse CRF ascertainment methods to establish, validate and characterize a proteomic CRF score. In a cohort of around 22,000 individuals in the UK Biobank, a proteomic CRF score was associated with a reduced risk of all-cause mortality (unadjusted hazard ratio 0.50 (95% confidence interval 0.48-0.52) per 1 s.d. increase). The proteomic CRF score was also associated with multisystem disease risk and provided risk reclassification and discrimination beyond clinical risk factors, as well as modulating high polygenic risk of certain diseases. Finally, we observed dynamicity of the proteomic CRF score in individuals who undertook a 20-week exercise training program and an association of the score with the degree of the effect of training on CRF, suggesting potential use of the score for personalization of exercise recommendations. These results indicate that population-based proteomics provides biologically relevant molecular readouts of CRF that are additive to genetic risk, potentially modifiable and clinically translatable.
© 2024. The Author(s).
Conflict of interest statement
R.V.S. and A.S.P. have applied for a patent related to the findings in this manuscript. R.V.S. is supported in part by grants from the National Institutes of Health and the American Heart Association. In the past 12 months, R.V.S. has served for a consultant for Amgen and Cytokinetics. R.V.S. is a co-inventor on a patent for ex-RNAs signatures of cardiac remodeling and a pending patent on proteomic signatures of fitness and lung and liver diseases. V.L.M. has received grant support from Siemens Healthineers, NIDDK, NIA, NHLBI and AHA. V.L.M. has received other research support from NIVA Medical Imaging Solutions. V.L.M. owns stock in Eli Lilly, Johnson & Johnson, Merck, Bristo-Myers Squibb, Pfizer and stock options in Ionetix. V.L.M. has received research grants and speaking honoraria from Quart Medical. G.D.L. has hospital-based research agreements with from National Institutes of Health R01-HL 151841, R01-HL131029, R01-HL159514, U01HL160278, American Heart Association 15GPSGC-24800006 and SFRN for research involving exercise omics, and has received consulting fees from American Regent, Amgen, Cytokinetics, Boehringer Ingelheim, and Edwards and has received royalties from UpToDate for scientific content authorship related to exercise physiology. M.N. has received speaking honoraria from Cytokinetics. The remaining authors declare no competing interests.
Figures
References
-
- Kodama S, et al. Cardiorespiratory fitness as a quantitative predictor of all-cause mortality and cardiovascular events in healthy men and women: a meta-analysis. JAMA. 2009;301:2024–2035. - PubMed
-
- Mancini DM, et al. Value of peak exercise oxygen consumption for optimal timing of cardiac transplantation in ambulatory patients with heart failure. Circulation. 1991;83:778–786. - PubMed
-
- Sandvik L, et al. Physical fitness as a predictor of mortality among healthy, middle-aged Norwegian men. N. Engl. J. Med. 1993;328:533–537. - PubMed
-
- Wei M, et al. Relationship between low cardiorespiratory fitness and mortality in normal-weight, overweight, and obese men. JAMA. 1999;282:1547–1553. - PubMed
MeSH terms
Grants and funding
- K23 HL171855/HL/NHLBI NIH HHS/United States
- 75N93023D00005/AI/NIAID NIH HHS/United States
- 75N92021D00003/WH/WHI NIH HHS/United States
- 75N92020D00004/HL/NHLBI NIH HHS/United States
- 75N92022D00003/HL/NHLBI NIH HHS/United States
- R01 HL045670/HL/NHLBI NIH HHS/United States
- 75N92020D00002/HL/NHLBI NIH HHS/United States
- 75N92021D00002/HL/NHLBI NIH HHS/United States
- R01 NR019628/NR/NINR NIH HHS/United States
- 75N92020D00005/HL/NHLBI NIH HHS/United States
- 75N97023D00003/LM/NLM NIH HHS/United States
- R01 HL047327/HL/NHLBI NIH HHS/United States
- 75N92021D00005/WH/WHI NIH HHS/United States
- R01 HL078972/HL/NHLBI NIH HHS/United States
- 75N99023D00003/OF/ORFDO NIH HHS/United States
- R01 HL131029/HL/NHLBI NIH HHS/United States
- 75N92022D00002/HL/NHLBI NIH HHS/United States
- 75N90023D00005/CL/CLC NIH HHS/United States
- R01 HL047323/HL/NHLBI NIH HHS/United States
- R01 HL156975/HL/NHLBI NIH HHS/United States
- MC_UU_00006/4/MRC_/Medical Research Council/United Kingdom
- 75N96023D00005/ES/NIEHS NIH HHS/United States
- R01 HL140074/HL/NHLBI NIH HHS/United States
- 75N92020D00003/HL/NHLBI NIH HHS/United States
- 75N92022D00004/HL/NHLBI NIH HHS/United States
- 75N96023D00002/ES/NIEHS NIH HHS/United States
- 75N99023D00006/OF/ORFDO NIH HHS/United States
- 75N92021D00006/HL/NHLBI NIH HHS/United States
- 75N94023D00003/HD/NICHD NIH HHS/United States
- 75N92022D00005/HL/NHLBI NIH HHS/United States
- 75N99023D00005/OF/ORFDO NIH HHS/United States
- 75N96023D00003/ES/NIEHS NIH HHS/United States
- 75N90023D00003/CL/CLC NIH HHS/United States
- K23 HL150327/HL/NHLBI NIH HHS/United States
- MC_UU_00006/1/MRC_/Medical Research Council/United Kingdom
- R01 HL047317/HL/NHLBI NIH HHS/United States
- 75N92020D00006/HL/NHLBI NIH HHS/United States
- 75N96023D00004/ES/NIEHS NIH HHS/United States
- 75N92024D00005/HL/NHLBI NIH HHS/United States
- 75N98023D00003/OD/NIH HHS/United States
- R01 HL122477/HL/NHLBI NIH HHS/United States
- 75N92021D00004/WH/WHI NIH HHS/United States
