. 2024 Jul;43(14):2908-2928.
doi: 10.1038/s44318-024-00125-1. Epub 2024 Jun 4.

PARP14 is regulated by the PARP9/DTX3L complex and promotes interferon γ-induced ADP-ribosylation

Affiliations

PARP14 is regulated by the PARP9/DTX3L complex and promotes interferon γ-induced ADP-ribosylation

Victoria Chaves Ribeiro et al. EMBO J. 2024 Jul.

Abstract

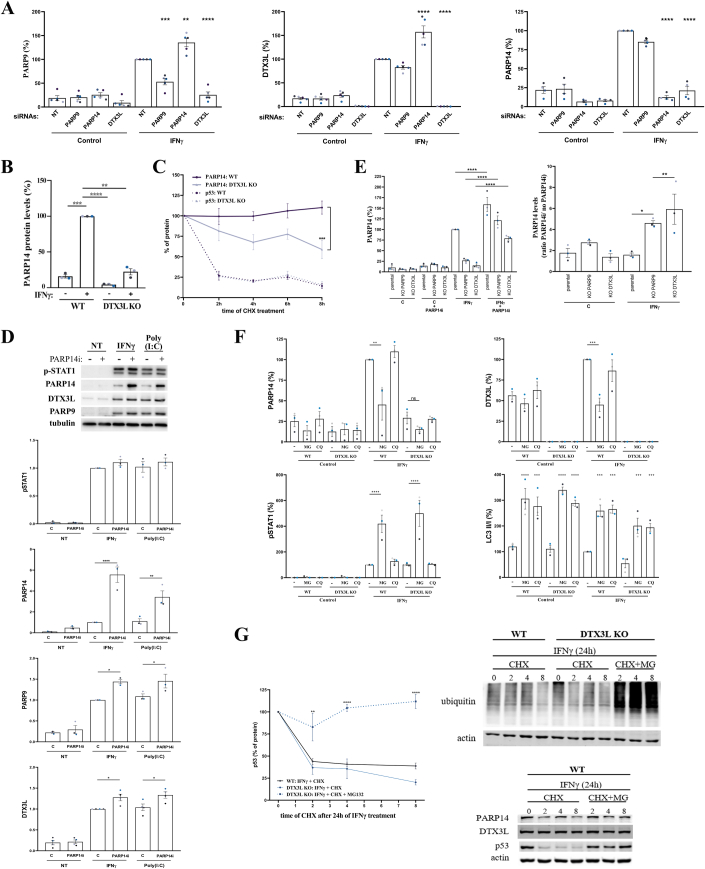
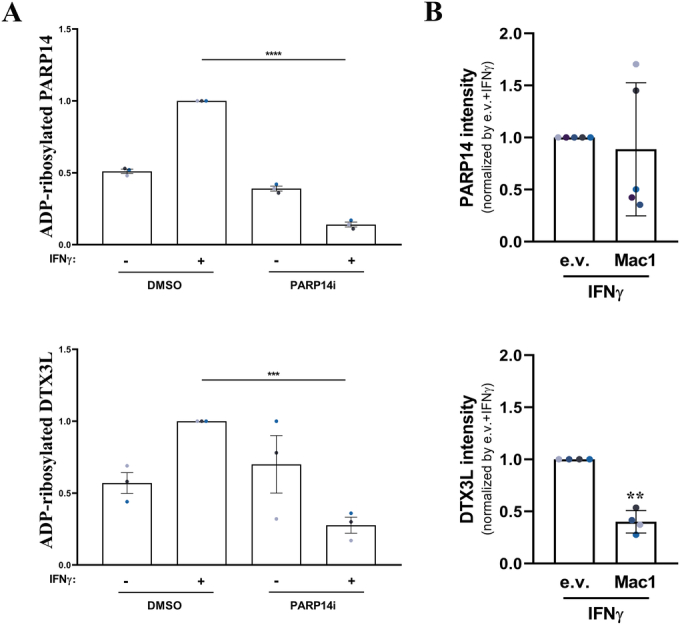
Protein ADP-ribosylation plays important but ill-defined roles in antiviral signalling cascades such as the interferon response. Several viruses of clinical interest, including coronaviruses, express hydrolases that reverse ADP-ribosylation catalysed by host enzymes, suggesting an important role for this modification in host-pathogen interactions. However, which ADP-ribosyltransferases mediate host ADP-ribosylation, what proteins and pathways they target and how these modifications affect viral infection and pathogenesis is currently unclear. Here we show that host ADP-ribosyltransferase activity induced by IFNγ signalling depends on PARP14 catalytic activity and that the PARP9/DTX3L complex is required to uphold PARP14 protein levels via post-translational mechanisms. Both the PARP9/DTX3L complex and PARP14 localise to IFNγ-induced cytoplasmic inclusions containing ADP-ribosylated proteins, and both PARP14 itself and DTX3L are likely targets of PARP14 ADP-ribosylation. We provide evidence that these modifications are hydrolysed by the SARS-CoV-2 Nsp3 macrodomain, shedding light on the intricate cross-regulation between IFN-induced ADP-ribosyltransferases and the potential roles of the coronavirus macrodomain in counteracting their activity.

Keywords: ADP-Ribosylation; Coronavirus; Innate Immunity; Interferon; PARP.


Conflict of interest statement

The authors declare no competing interests.

Figures

Figure 1
Figure 1. IFNγ treatment induces mono-ADP-ribosylation on acidic residues.
(A, B) Representative immunofluorescence microscopy images of A549 cells treated or not with 500 U/mL of IFNγ for 24 h, co-stained using the indicated ADPr-specific reagents. Regions marked with a white box are enlarged in the top right corner. Scale bar: 10 μm. (C) Representative immunofluorescence microscopy images of pan-ADP-ribose (MABE1016) staining in RPE-1 cells treated with vehicle control, 100 U/mL IFNγ for 24 h or 600 µM hydrogen peroxide for 10 min. After cell fixation and permeabilisation, samples were either treated with PBS or 1 M hydroxylamine pH 7.0 for 1 h. Scale bar: 30 μm. (D) Quantification of pan-ADP-ribose signal contained in cytosolic puncta or nuclei in RPE-1 cells treated as in (C). Mean ± SEM (n = 3) ****p < 0.0001. Source data are available online for this figure.
Figure 2
Figure 2. PARP14 promotes IFN-induced ADP-ribosylation.
(A) Representative immunofluorescence microscopy images and (B) quantification of pan-ADP-ribose (MABE1016) signal contained in cytosolic puncta in A549 cells transfected with indicated siRNAs, treated with vehicle control or 100 U/mL IFNγ for 24 h. (C) Representative immunofluorescence microscopy images and (D) quantification of pan-ADP-ribose (MABE1016) signal contained in cytosolic puncta in A549 cells treated with vehicle control, 100 U/mL IFNγ or transfected with 0.1 μg/mL poly(I:C) for 24 h, co-treated or not with 100 nM PARP14 inhibitor. Mean ± SEM (n = 3–6, as indicated). *p < 0.05, **p < 0.01, ***p < 0.001 and ****p < 0.0001. Scale bar: 20 μm. Source data are available online for this figure.
Figure 3
Figure 3. PARP9, DTX3L and PARP14 co-localise with cytosolic ADP-ribosylation sites and co-precipitate.
(A) Representative immunofluorescence microscopy images of A549 cells treated or not with 200 U/mL IFNγ for 24 h, co-stained for pan-ADP-ribose (eAf1521-Fc) and PARP14. (B) Representative immunofluorescence microscopy images of A549 cells treated or not with 500 U/mL IFNγ for 24 h, co-stained for pan-ADP-ribose (eAf1521-Fc) and PARP9. (A, B) Regions marked with a white box are enlarged in the top right corner. Scale bar: 10 μm. (C) Representative immunofluorescence confocal microscopy images of HeLa cells not transfect (NT) or transfected with YFP-empty vector (YFP-e.v.) or YFP-PARP14, treated with 200 U/mL IFNγ for 24 h, co-stained for pan-ADP-ribose (eAF1521-Fc) and PARP9. Regions marked with a white box are enlarged in the top right corner. Scale bar: 10 μm. (D) Representative immunoblot against indicated proteins in input lysates and GFP pulldown samples (IP) from HEK293FT cells transfected with empty GFP vector control (e.v.), GFP-DTX3L or GFP-DTX3L-M2 constructs, treated with vehicle control or 100 U/mL IFNγ for 24 h. (E) Representative immunoblot against indicated proteins in input lysates and GFP pulldown samples (IP) from HEK293FT cells transfected with YFP-empty vector (YFP-e.v.) or YFP-PARP14 constructs, treated with vehicle control or 200 U/mL IFNγ for 24 h. Source data are available online for this figure.
Figure 4
Figure 4. The PARP9/DTX3L complex regulates PARP14 protein stability.
(A) Representative image of immunoblots for PARP9, DTX3L and PARP14 protein levels relative to tubulin loading control in A549 cells transfected with indicated siRNAs and treated with vehicle control or 100 U/ml IFNγ for 24 h. (B) Representative image of immunoblots for PARP14 protein levels relative to tubulin loading control in RPE-1 WT or DTX3L KO cells treated with vehicle control or 100 U/mL IFNγ for 24 h. (C) Quantification of relative PARP14 mRNA levels by RT-qPCR in RPE-1 WT or DTX3L KO cells 24 h after treatment with vehicle control, 100 U/mL IFNγ or transfection with 0.1 μg/mL poly(I:C). (D) Representative image of immunoblots for indicated proteins in RPE-1 WT or DTX3L KO cells treated with 50 μg/mL cycloheximide (CHX) for indicated times. (E) Representative immunoblot for PARP14 protein levels and tubulin loading control in RPE-1 WT, PARP9 KO or DTX3L KO cells treated with vehicle controls or 100 U/mL IFNγ and/or 100 nM PARP14i for 24 h, as indicated. (F) Representative image of immunoblots for indicated proteins in RPE-1 WT or DTX3L KO cells treated with vehicle controls (-) or 100 U/mL IFNy, 20 μM chloroquine (CQ) and/or 10 μM MG132 (MG) for 24 h, as indicated. (G) Representative image (left) and quantification (right) of immunoblots for PARP14, DTX3L and p53 protein levels and tubulin loading control in RPE-1 WT or DTX3L KO cells treated with 100 U/mL IFNy for 24 h and subsequently treated with 50 μg/mL cycloheximide (CHX) or co-treated with 50 μg/mL cycloheximide (CHX) and 10 μM MG132 (MG) for the indicated times. (H) Representative image of immunoblots for indicated proteins in total cell lysates (T), cytoplasmic fractions (C) or nuclear fractions (N) obtained from RPE-1 WT, PARP9 KO or DTX3L KO cells treated with vehicle control or 100 U/mL IFNy for 24 h. Mean ± SEM (n = 3–5, as indicated). *p < 0.05, **p < 0.01, ***p < 0.001 and ****p < 0.0001. Source data are available online for this figure.
Figure 5
Figure 5. PARP14 promotes auto-ADP-ribosylation and macrodomain-sensitive DTX3L trans-ADP-ribosylation.
(A) Representative immunoblots for PARP14, DTX3L and PARP9 in whole cell lysates (input) and in material bound to GST-Af1521-G42E or GST-Af1521-WT beads from RPE-1 WT or DTX3L KO cells treated with 100 U/mL IFNγ and/or 100 nM PARP14 inhibitor, as indicated. (B) Representative fluorescent immunoblots for ADP-ribosylated proteins (red) and either PARP14 (left) or DTX3L (right) (both in green) in samples from A549 cells treated with vehicle control or 100 U/mL IFNγ for 24 h and/or 100 nM PARP14 inhibitor, as indicated. (C) Representative immunoblots for PARP14 and DTX3L in whole cell lysates (input) and in material bound to GST-Af1521-G42E or GST-Af1521-WT beads from A549 cells transduced with either empty vector (e.v.) or SARS-CoV-2 Nsp3 macrodomain 1 (Mac1) lentiviral constructs, treated with vehicle control or 100 U/mL IFNγ for 24 h, as indicated. (D) Schematic representation of the proposed model. The PARP9/DTX3L complex regulates PARP14 protein levels and PARP14 catalyses ADP-ribosylation of itself, DTX3L and likely other targets. The SARS-CoV-2 Nsp3 macrodomain can hydrolyse this modification on PARP14 and DTX3L. Created with BioRender.com. Source data are available online for this figure.
Figure EV1
Figure EV1. IFNγ-induced ADP-ribosylation is hydroxylamine-sensitive.
(related to figure 1). (A) Representative image (left) and quantification (right) of immunoblot analyses for mono-ADP-ribose (43647 HRP-coupled) levels relative to tubulin loading control in RPE-1 cells treated with vehicle control or 200 U/mL IFNγ for 24 h. After cell lysis, indicated samples were incubated with 1 M hydroxylamine pH 7.0 for 1 h. For quantification, the 75 kDa saturated band was excluded from analysis and the signal intensity relative to tubulin loading control was normalised to IFNγ-treated cells. Mean ± SEM (n = 3, from three separate experiments). *p < 0.05.
Figure EV2
Figure EV2. IFNγ-induced ADP-ribosylation is dependent on the PARP9/DTX3L complex and PARP14.
(related to figure 2). (A) Quantification of relative PARP7, PARP8, PARP10, PARP11, PARP12 and PARP13 mRNA levels by RT-qPCR in A549 cells transfected with the indicated siRNAs, normalised to siNT transfected cells. Mean ± SEM (n = 2, from two separate experiments). siRNA efficiencies for PARP9, DTX3L and PARP14 are shown in Fig. 4A (B) Representative immunofluorescence microscopy images of pan-ADP-ribose (MABE1016) signal in A549 cells transfected with the indicated siRNAs, treated with vehicle control or 100 U/mL IFNγ for 24 h. Scale bar: 20 μm. siNT control is shown in Fig. 2A (C) Representative immunoblot for mono-ADP-ribose (43647 HRP-coupled) and actin loading control in A549 cells transfected with the indicated siRNAs, treated with vehicle control or 200 U/mL IFNγ for 24 h. (D) Representative images (upper) and quantification (lower) of immunoblot analyses for STAT1 phospho-Y701 (p.STAT1) levels relative to tubulin loading control in A549 cells transfected with the indicated siRNAs, treated with vehicle control or 100 U/mL IFNγ for 24 h, normalised to IFNγ-treated siNT cells. Mean ± SEM (n = 3, from three separate experiments).
Figure EV3
Figure EV3. Antibody validation, IP controls and co-localization of DTX3L with PARP14 and ADP-ribose.
(related to figure 3). (AC) PARP14, PARP9 and DTX3L antibody validation. (A) Representative immunofluorescence microscopy images (upper) and quantification (lower) of PARP14 signal in the cytoplasm (lower left) and nuclei (lower right) in A549 cells transfected with indicated siRNAs, treated with vehicle control or 100 U/mL IFNγ for 24 h. (B) Representative immunofluorescence microscopy images of PARP9 staining in RPE-1 WT or PARP9 knockout RPE-1 cells treated with vehicle control or 100 U/mL IFNγ for 24 h. (C) Representative immunofluorescence microscopy images of DTX3L staining in RPE-1 WT or DTX3L knockout RPE-1 cells treated with 100 U/mL IFNγ for 24 h. White arrows indicate the specific DTX3L cytoplasmic dots. Scale bar: 10 μm. (D) Representative immunofluorescence microscopy images of A549 cells treated or not with 500 U/mL IFNγ for 24 h, co-stained for pan-ADP-ribose (eAF1521-Fc) and DTX3L. Regions marked with a white box are enlarged in the top right corner. Scale bar: 10 μm. (E) Representative immunofluorescence confocal microscopy images of HeLa cells not transfect (NT) or transfected with YFP-empty vector (YFP-e.v.) or YFP-PARP14, treated with 200 U/mL IFNγ for 24 h, co-stained for pan-ADP-ribose (eAF1521-Fc) and DTX3L. Regions marked with a white box are enlarged in the top right corner. Scale bar: 10 μm. (F, G) Ponceau S staining of membranes to confirm equal loading and transfer of proteins used in Fig. 3D (F) and 3E (G).
Figure EV4
Figure EV4. The PARP9/DTX3L complex regulates PARP14 protein stability.
(related to figure 4). (A) Quantification of immunoblot analyses (as shown in Fig. 4A) for PARP9, DTX3L and PARP14 protein levels relative to tubulin loading control in A549 cells transfected with indicated siRNAs and treated with vehicle control or 100 U/ml IFNγ for 24 h, normalised to IFNγ-treated siNT cells. (B) Quantification of immunoblot analyses (as shown in Fig. 4B) for PARP14 protein levels relative to tubulin loading control in RPE-1 WT or DTX3L KO cells treated with vehicle control or 100 U/mL IFNγ for 24 h, normalised to IFNγ-treated WT cells. (C) Quantification of immunoblot analyses (as shown in Fig. 4D) for PARP14 and p53 in RPE-1 WT or DTX3L KO cells treated with 50 μg/mL cycloheximide (CHX) for the indicated times, normalised to untreated controls. (D) Representative image and quantification of immunoblot analyses for pSTAT1, PARP14, PARP9 and DTX3L levels relative to tubulin loading control in A549 cells, 24 h after treatment with vehicle control, 100 U/mL IFNγ, transfection with 0.1 μg/mL poly(I:C) and/or 100 nM PARP14i, normalised to IFNγ-treated cells. (E) Quantification of immunoblot analyses (as shown in Fig. 4E) for PARP14 protein in RPE-1 WT, PARP9 KO or DTX3L KO cells treated with vehicle control or 100 U/mL IFNy and/or 100 nM PARP14i for 24 h, as indicated. PARP14 levels relative to tubulin loading control, normalised to IFNγ-treated WT cells (left) and the ratio between the PARP14i treated and respective non-treated samples (right) are shown. (F) Quantification of immunoblot analyses (shown in Fig. 4F) for PARP14, DTX3L, STAT1 phospho-Y701 (p-STAT1) levels and LC3II/LC3I ratio relative to tubulin loading control in RPE-1 WT or DTX3L KO cells treated with vehicle controls or 100 U/mL IFNy, and 20 μM chloroquine (CQ) or 10 μM MG132 as indicated, for 24 h, normalised to IFNγ-treated WT cells. (G) Quantification of immunoblot analyses for p53 in RPE-1 WT or DTX3L KO (left) and representative image of immunoblot analyses for ubiquitin (upper right) and PARP14, DTX3L, p53 and actin loading control (lower right) in RPE-1 WT cells treated with 50 μg/mL cycloheximide (CHX) and 10 μM MG132 for the indicated times after treatment with 100 U/mL IFNγ for 24 h, normalised to untreated samples of each cell line. Mean ± SEM (n = 3–5, as indicated). *p < 0.05, **p < 0.01, ***p < 0.001 and ****p < 0.0001.
Figure EV5
Figure EV5. ADP-ribosylation of PARP14 and DTX3L in response to IFNγ is sensitive to Mac1 expression.
(related to figure 5). (A) Quantification of immunoblot analyses for fluorescently co-stained mono-ADP-ribose (43647 mouse Fc-conjugated) and either PARP14 (upper) or DTX3L (lower) in A549 cells treated with vehicle control or 100 U/mL IFNγ for 24 h and/or 100 nM PARP14 inhibitor, as indicated. Graphs show the ratio between the mono-ADP-ribose band at the respective molecular weight and the total protein levels, normalised to the IFNγ-treated sample. (B) Quantification of PARP14 (upper) and DTX3L (left) immunoblot bands of GST-Af1521 pulldown in A549 cells transduced with an empty vector (e.v.) or FLAG-tagged SARS-CoV-2 Nsp3 macrodomain (Mac1) lysates, 24 h after treatment with 100 U/mL IFNγ. Mean ± SEM (n = 3–5, as indicated). ***p < 0.001 and ****p < 0.0001.

Similar articles

Cited by

References

    1. Abraham R, Hauer D, McPherson RL, Utt A, Kirby IT, Cohen MS, Merits A, Leung AKL, Griffin DE. ADP-ribosyl-binding and hydrolase activities of the alphavirus nsP3 macrodomain are critical for initiation of virus replication. Proc Natl Acad Sci USA. 2018;115:E10457–E10466. doi: 10.1073/pnas.1812130115. - DOI - PMC - PubMed
    1. Ashok Y, Vela-Rodríguez C, Yang C, Alanen HI, Liu F, Paschal BM, Lehtiö L. Reconstitution of the DTX3L-PARP9 complex reveals determinants for high-affinity heterodimerization and multimeric assembly. Biochem J. 2022;479:289–304. doi: 10.1042/BCJ20210722. - DOI - PubMed
    1. Bachmann SB, Frommel SC, Camicia R, Winkler HC, Santoro R, Hassa PO. DTX3L and ARTD9 inhibit IRF1 expression and mediate in cooperation with ARTD8 survival and proliferation of metastatic prostate cancer cells. Mol Cancer. 2014;13:125. doi: 10.1186/1476-4598-13-125. - DOI - PMC - PubMed
    1. Bonfiglio JJ, Leidecker O, Dauben H, Longarini EJ, Colby T, San Segundo-Acosta P, Perez KA, Matic I. An HPF1/PARP1-based chemical biology strategy for exploring ADP-ribosylation. Cell. 2020;183:1086–1102.e1023. doi: 10.1016/j.cell.2020.09.055. - DOI - PubMed
    1. Buch-Larsen SC, Hendriks IA, Lodge JM, Rykær M, Furtwängler B, Shishkova E, Westphall MS, Coon JJ, Nielsen ML. Mapping physiological ADP-ribosylation using activated ion electron transfer dissociation. Cell Rep. 2020;32:108176. doi: 10.1016/j.celrep.2020.108176. - DOI - PMC - PubMed

LinkOut - more resources