. 2024 Jul;43(14):2929-2953.
doi: 10.1038/s44318-024-00126-0. Epub 2024 Jun 4.

PARP14 and PARP9/DTX3L regulate interferon-induced ADP-ribosylation

Affiliations

PARP14 and PARP9/DTX3L regulate interferon-induced ADP-ribosylation

Pulak Kar et al. EMBO J. 2024 Jul.

Erratum in

Abstract

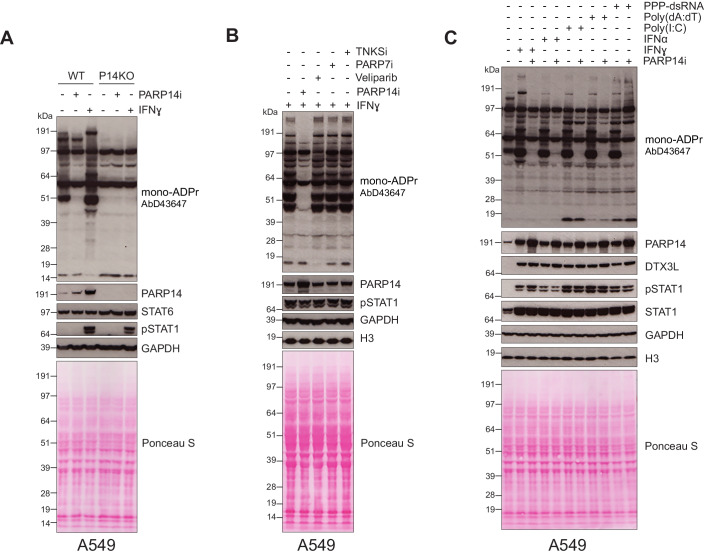
PARP-catalysed ADP-ribosylation (ADPr) is important in regulating various cellular pathways. Until recently, PARP-dependent mono-ADP-ribosylation has been poorly understood due to the lack of sensitive detection methods. Here, we utilised an improved antibody to detect mono-ADP-ribosylation. We visualised endogenous interferon (IFN)-induced ADP-ribosylation and show that PARP14 is a major enzyme responsible for this modification. Fittingly, this signalling is reversed by the macrodomain from SARS-CoV-2 (Mac1), providing a possible mechanism by which Mac1 counteracts the activity of antiviral PARPs. Our data also elucidate a major role of PARP9 and its binding partner, the E3 ubiquitin ligase DTX3L, in regulating PARP14 activity through protein-protein interactions and by the hydrolytic activity of PARP9 macrodomain 1. Finally, we also present the first visualisation of ADPr-dependent ubiquitylation in the IFN response. These approaches should further advance our understanding of IFN-induced ADPr and ubiquitin signalling processes and could shed light on how different pathogens avoid such defence pathways.

Keywords: ADP-ribosylation; Immune Response; Interferon Response; SARS-CoV2; Ubiquitin.


Conflict of interest statement

MN is an employee and shareholder of Ribon Therapeutics. EP is an employee of Vertex Pharmaceuticals and may own stock or stock options in that company. All other authors declare that they have no competing interests.

Figures

Figure 1
Figure 1. Immunity responses induce PARP14-dependent ADP-ribosylation.
(A) A549WT and PARP14 knockout cells untreated or treated with 0.5 μM PARP14i (RBN012759) or with IFNɣ (100 ng/mL). Cell lysates were examined by western blot with the indicated antibodies. (B) A549 WT cells were treated with 0.5 μM PARP14i, 100 nM PARP7i, 1 μM Veliparib or 1 μM TNKSi and stimulated with IFNɣ (100 ng/mL). Cell lysates were examined by western blot with the indicated antibodies. (C) A549 WT cells were treated with IFNɣ (100 ng/mL), IFNα (1000 U/mL), poly(dA:dT), poly(I:C), or 5′ triple phosphate dsRNA (PPP-dsRNA) in the presence or absence of 0.5 μM PARP14i. Cell lysates were examined by western blot with the indicated antibodies. For all western blots, pSTAT1 levels were used as a positive control for immune response activation. GAPDH was used as a loading control. Source data are available online for this figure.
Figure 2
Figure 2. PARP14 increases cytoplasmic ADPr after IFNɣ stimulation.
(A) Widefield images showing A549 WT or PARP14 KO cells untreated or treated with IFNɣ in the presence or absence of PARP14i (0.5 μM). Cells were stained with Hoechst (Blue) and ADPr (poly/mono-ADPr antibody, CST #83732) (Green). Scale bar = 20 μm. (B) Mean intensity of cytoplasmic signal from (A) measured in arbitrary units (A.U). The red line indicates mean grey values. (C) Confocal images showing A549 WT cells untreated or treated with IFNɣ (100 ng/mL) in the presence or absence of PARP14i (0.5 μM). Cells were stained with Hoechst (Blue), mono-ADPr (AbD43647 IgG-coupled antibody) (Green) and PARP14 (Magenta). Scale bar = 20 μm. (D) Confocal images showing A549 PARP14 KO cells untreated or treated with IFNɣ (100 ng/mL). Cells were stained with Hoechst (Blue), mono-ADPr (AbD43647 IgG-coupled antibody) (Green) and PARP14 (Magenta). Scale bar = 20 μm. (E) Normalised intensity of cytoplasmic mono-ADPr signal from (C). Fluorescence intensity was normalised to WT cells in the absence of IFNɣ or PARP14i. Red line indicates mean values. (F) Normalised intensity of PARP14 cytoplasmic signal from (C, D). Fluorescence intensity was normalised to WT cells in the absence of IFNɣ or PARP14i. Red line indicates mean grey values. (G) Confocal images showing A549 WT cells untreated or treated with IFNɣ (100 ng/mL) in the presence or absence of PARP14i (0.5 μM). Cells were stained with Hoechst (Blue), mono-ADPr (AbD43647 IgG-coupled antibody) (Green) and PARP9 (Magenta). Scale bar = 20 μm. (H) Normalised intensity of cytoplasmic PARP9 signal from (G). Fluorescence intensity was normalised to WT cells in the absence of IFNɣ or PARP14i. Red line shows the mean. (I) Widefield images showing A549 WT cells expressing GFP or YFP-Nsp3 Mac1 treated with IFNɣ (100 ng/mL). Cells were stained with Hoechst (Blue), GFP/YFP (Green) and ADPr (poly/mono-ADPr antibody, CST #83732) (Red). Scale bar = 20 μm. (J) Mean intensity of cytoplasmic signal from (I) measured in arbitrary units (A.U). Red line indicates mean grey values. For all graphs, statistical analysis was determined using a Kruskal Wallis test with Bonferroni correction followed by post-hoc Dunn’s test. Asterisks indicate statistical significance (ns: not significant, ****p < 0.0001). Data information: Graphs in (B), (E), (F), (H) and (J) show individual cell measurements with a minimum of 108 cells per condition. The red line indicates the mean. For (E), (F) and (H), the intensity measurement was normalised to the mean intensity for WT cells without PARP14i or IFNɣ treatment. Data are representative of a minimum of three independent replicates. Source data are available online for this figure.
Figure 3
Figure 3. PARP9/DTX3L regulate PARP14-dependent ADPr.
(A) Schematic domain representation of PARP14, PARP9 and DTX3L. (B) AlphaFold prediction of PARP14 (blue), DTX3L (turquoise) and PARP9 (purple) interaction. DTX3L KH domains 2–5 are highlighted in orange. (C) A549 WT, PARP14 KO and DTX3L-depleted cells untreated or treated with 0.5 μM PARP14i or with IFNɣ (100 ng/mL). Cell lysates were examined by western blot with the indicated antibodies. (D) The relative gene expression analysis of PARP14 in unstimulated and IFNɣ (100 ng/mL) stimulated A549 cells as determined by RT-qPCR, normalized to the expression of HPRT1. Error bars indicate average S.D. from three independent replicates. Asterisks indicate statistical significance compared with the control, as determined by Welch’s t-test (ns: not significant, siCTRL vs siDTX3L +IFNɣ p = 0.3852). (E) U2OS WT, PARP14 KO and DTX3L KO cells were treated with 0.5 μM PARP14i or with IFNɣ (100 ng/mL). Cell lysates were examined by western blot with the indicated antibodies. (F) U2OS WT or DTX3L KO cells were treated with IFNɣ (100 ng/mL), IFNα (1000 U/mL) poly(dA:dT), poly(I:C), or 5′ triple phosphate dsRNA (PPP-dsRNA) in the presence or absence of 0.5 μM PARP14i. Cell lysates were examined by western blot with the indicated antibodies. (G) U2OS, A549 and RPE1 cells depleted or not of DTX3L, PARP9 or PARP14 were treated with IFNɣ (100 ng/mL). Cell lysates were examined by western blot with the indicated antibodies. For all western blots, pSTAT1 levels were used as a positive control for immune response activation. GAPDH was used as a loading control. Source data are available online for this figure.
Figure 4
Figure 4. PARP14, PARP9 and DTX3L regulate ADPr and ubiquitin foci formation.
(A) Widefield images showing A549 WT cells deleted of PARP9, DTX3L or PARP14 in the absence or presence of IFNɣ. Cells were stained with Hoechst (Blue), mono-ADPr (AbD43647 IgG-coupled antibody) (Green). (B) Widefield images showing A549 WT cells depleted of PARP9, DTX3L or PARP14, treated with IFNɣ (100 ng/mL). Cells were stained with Hoechst (Blue), poly/mono ADPr (poly/mono-ADPr antibody, CST #83732) (Green) and ubiquitin (Santa Cruz, sc-8017) (Magenta). Zoom shows magnified cells as indicated by white box. For all images, scale bar = 20 μm. (C) Quantification of number of ubiquitin foci that also show staining for ADPr from (B). Statistical analysis was determined using a Kruskal Wallis test with Bonferroni correction followed by post-hoc Dunn’s test. Asterisks indicate statistical significance compared to control (**p < 0.01; ****p < 0.0001). Data information: Graph in (C) shows number of foci per individual cell. Between 279 and 466 cells per condition were analysed. The red line indicates the mean foci per cell (siCTRL: 0.266; siPARP9: 1.688; siDTX3L: 0.182; siPARP14: 0.019). Data are representative of a minimum of three (A) or five (B, C) independent replicates. Source data are available online for this figure.
Figure 5
Figure 5. DTX3L inhibits PARP14 activity in vitro.
(A) PARP14 WWE-ART automodification reaction with 32P-NAD+, followed by subsequent addition of the indicated proteins. (B) PARP14 FL auto-ADP-ribosylation reaction performed with 32P-NAD+ and increasing amount of PARP9/DTX3L or DTX3L. (C) PARP14-DTX3L core interaction module as predicted using AlphaFold. The interaction is mediated by PARP14 KH8-WWE-ART and DTX3L KH2 domain. (D) Surface representation of PARP14 KH8-WWE-ART coloured according to its sequence conservation. Bound DTX3L KH2-KH3 is showed as cartoon. (E) PARP14 FL and PARP14 KH8-WWE-ART auto-ADP-ribosylation reaction performed with 32P-NAD+ in the presence of DTX3L FL or DTX3L RD. (F) Mutations on the interaction interface between PARP14 KH8 and DTX3L KH2 domain. (G) Auto-ADP-ribosylation reaction of PARP14 FL, PARP14 KH8-WWE-ART, and PARP14 KH8mut-WWE-ART performed with 32P-NAD+ in the presence of DTX3L FL or DTX3L FL mutant. Each experiment has been completed in triplicate.
Figure EV1
Figure EV1. PARP14 is auto-ADPr upon immune stimulation and this regulates its stability.
(A) A549 cells were treated with 0.5 μM PARP14i (RBN012759) and/or with IFNɣ (100 ng/mL). Cell lysates were examined by western blot with the indicated antibodies. (B) A549 cells were treated with 0.5 μM PARP14i (RBN012759) and/or with IFNɣ (100 ng/mL). Cell lysates were subjected to immunoprecipitation with Protein G beads conjugated with indicated antibodies. The ADPr signal was analysed using western blotting. (C) A549 cells depleted or not of PARP14 or PARP12 were treated with IFNɣ (100 ng/mL) where indicated. Cell lysates were examined by western blot with the indicated antibodies. (D) Relative gene expression of PARP12 for (C) in unstimulated and IFNɣ (100 ng/mL) stimulated A549 cells was determined by RT-qPCR. Gene expression levels were normalized to the expression of GAPDH. Error bars indicate average S.D. from three independent replicates. Asterisks indicate statistical significance compared with the control, as determined by Welch’s t-test (ns: not significant, **p < 0.01, ***p < 0.001 Two-tailed P value, siCTRL vs siPARP12 -IFNɣ p = 0.002, siCTRL vs siPARP12 +IFNɣ p = 0.0006). (E) U2OS cells were transfected with the indicated plasmids in the presence or absence of 0.5 μM PARP14i or expression of FLAG-SARS2 Mac1. The levels of YFP-tagged PARP14 in cell lysates were assessed using an anti-GFP antibody. (F) U2OS cells were transfected with indicated plasmids in the presence or absence of PARP14 inhibitor (0.5 μM). Cells were lysed 12, 24, 32 or 48 h after transfection and analysed by western blot using the indicated antibodies. For all blots, pSTAT1 antibody was used as a positive control for stimulation of immune response. GAPDH or tubulin were used as a loading control. Source data are available online for this figure.
Figure EV2
Figure EV2. PARP14, PARP9 and DTX3L increase after IFNɣ stimulation.
(A) A549 cells were treated or not with IFNɣ (100 ng/mL). Cell lysates were analysed by western blot using the indicated antibodies. GAPDH was used as a loading control. pSTAT1 indicates induction of the interferon response. (B) Confocal images showing A549 cells untreated or treated with IFNɣ (100 ng/mL) in the presence or absence of PARP14i (0.5 μM). Cells were stained with Hoechst (Blue), mono-ADPr (AbD43647 IgG-coupled) (Green) and PARP14 (Abcam, ab224352) (Magenta). Scale bars, 20 μm. (C) Normalised intensity of cytoplasmic PARP14 signal from (B). Fluorescence intensity was normalised to WT cells in the absence of IFNɣ or PARP14i. The red line indicates mean intensity. Statistical analysis was determined using a Kruskal Wallis test with Bonferroni correction followed by post hoc Dunn’s test. Asterisks indicate statistical significance (****p < 0.0001). Data are representative of two independent replicates. Source data are available online for this figure.
Figure EV3
Figure EV3. PARP9/DTX3L regulate PARP14-dependent ADPr.
(A) Predicted aligned error (PAE) plot of PARP14 (553–1801)/DTX3L (230–515)/PARP9 (66–830) model. Inter-domain interaction between PARP14 KH8-WWE-ART and DTX3L KH2-3 is indicated in cyan dashed box. Inter-domain interaction between PARP9 KH-ART and DTX3L KH4-5 is indicated in yellow dashed box. There are also notable intra-domain contacts within each protein: PARP14 KH-WWE, PARP9 KH-ART, PARP9 tandem macrodomains, DTX3L KH2-3, and DTX3L KH4-5. The relative orientations of other domains with high PAE score are uncertain. (B) U2OS DTX3L KO cells were treated with 0.5 μM PARP14i and/or 100 ng/mL IFNɣ. Cell lysates were examined by western blot with the indicated antibodies. (C) U2OS, A549 and RPE1 cells depleted or not of DTX3L, PARP9 or PARP14 were treated with poly(I:C). Cell lysates were examined by western blot with the indicated antibodies. For all blots, pSTAT1 antibody was used as a positive control for stimulation of immune response. (D) 293T cells were transfected with YFP-tagged PARP14 MD1 mutant alone or co-transfected with indicated plasmids. Cell lysates were collected 24 h after transfection and examined with the western blot using indicated antibodies. GAPDH or tubulin were used as a loading control in all blots. Source data are available online for this figure.
Figure EV4
Figure EV4. PARP14, PARP9 and DTX3L regulate ADPr and ubiquitin foci formation.
(A) Confocal images showing A549 WT cells deleted of PARP9, DTX3L or PARP14 in the absence of IFNɣ. Cells were stained with Hoechst (Blue), ADPr (poly/mono-ADPr antibody, CST #83732) (Green) and ubiquitin (Magenta). (B) Widefield images showing A549 WT cells depleted of PARP9, DTX3L or PARP14, untreated or IFNɣ-treated (100 ng/mL). Cells were stained with Hoechst (Blue), mono-ADPr (AbD43647 IgG-coupled antibody) (Green) and ubiquitin (Abcam, ab134953) (Magenta). For all images, scale bar = 20 μm. Data information: Data are representative of a minimum of five (A) or three (B) independent replicates. Source data are available online for this figure.
Figure EV5
Figure EV5. DTX3L inhibits PARP14 activity in vitro.
(A) PARP14 FL auto-ADP-ribosylation reaction performed with biotin-NAD+ and increasing amount of PARP9/DTX3L. (B) Predicted aligned error plot of PARP14 KH8-WWE-ART (residue 1451–1801) and DTX3L KH2-3 (residue 230–370) model.

Similar articles

Cited by

References

    1. Abraham R, Hauer D, McPherson RL, Utt A, Kirby IT, Cohen MS, Merits A, Leung AKL, Griffin DE (2018) ADP-ribosyl–binding and hydrolase activities of the alphavirus nsP3 macrodomain are critical for initiation of virus replication. Proc Natl Acad Sci USA 115:E10457–E10466 - PMC - PubMed
    1. Abraham R, McPherson Robert L, Dasovich M, Badiee M, Leung Anthony KL, Griffin Diane E (2020) Both ADP-ribosyl-binding and hydrolase activities of the alphavirus nsP3 macrodomain affect neurovirulence in mice. mBio 11, 10.1128/mbio.03253-03219 - PMC - PubMed
    1. Aguiar RCT, Takeyama K, He C, Kreinbrink K, Shipp MA (2005) B-aggressive lymphoma family proteins have unique domains that modulate transcription and exhibit poly(ADP-ribose) polymerase activity. J Biol Chem 280:33756–33765 - PubMed
    1. Ahel I, Ahel D, Matsusaka T, Clark AJ, Pines J, Boulton SJ, West SC (2008) Poly(ADP-ribose)-binding zinc finger motifs in DNA repair/checkpoint proteins. Nature 451:81–85 - PubMed
    1. Ahmed SF, Buetow L, Gabrielsen M, Lilla S, Chatrin C, Sibbet GJ, Zanivan S, Huang DT (2020) DELTEX2 C-terminal domain recognizes and recruits ADP-ribosylated proteins for ubiquitination. Sci Adv 6:eabc0629 - PMC - PubMed

LinkOut - more resources