. 2024 Jun 4;7(1):686.
doi: 10.1038/s42003-024-06396-y.

Tibetan Plateau grasslands might increase sequestration of microbial necromass carbon under future warming

Affiliations

Tibetan Plateau grasslands might increase sequestration of microbial necromass carbon under future warming

Qinwei Zhang et al. Commun Biol. .

Abstract

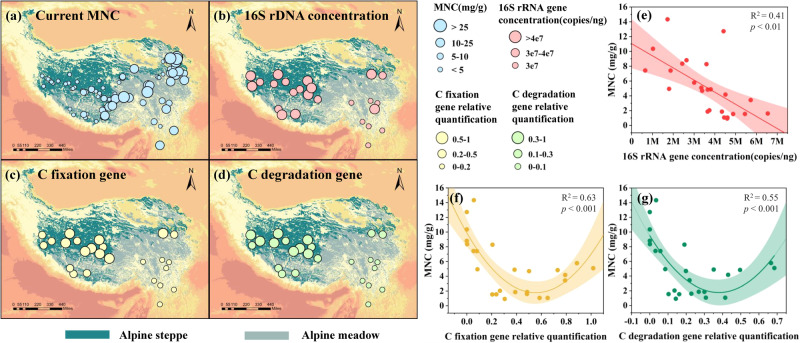
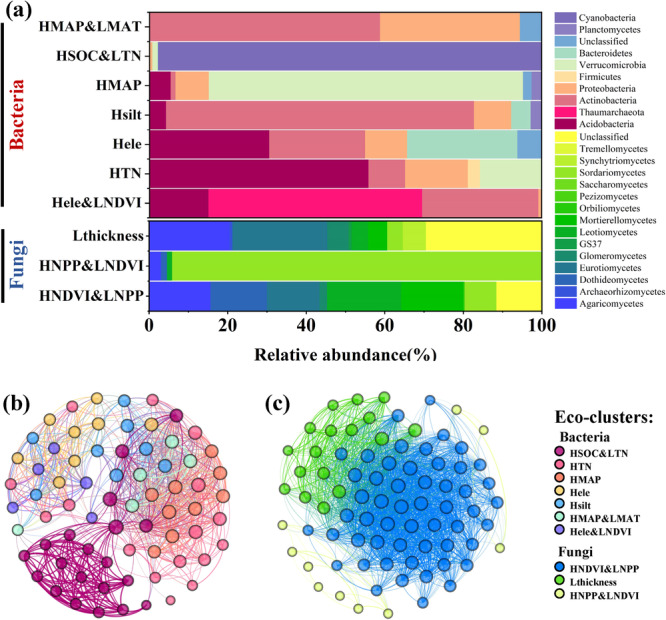
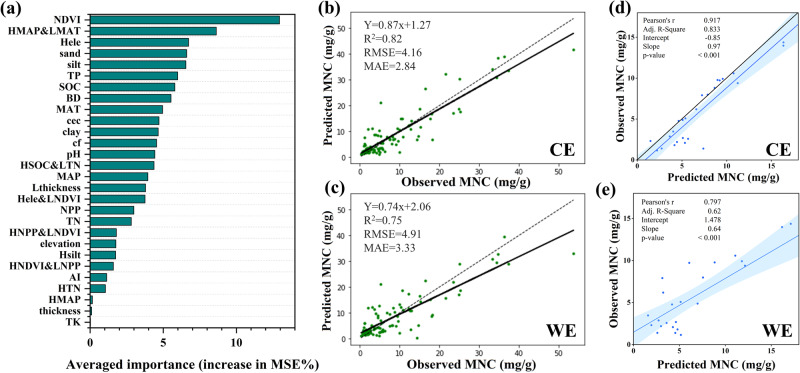
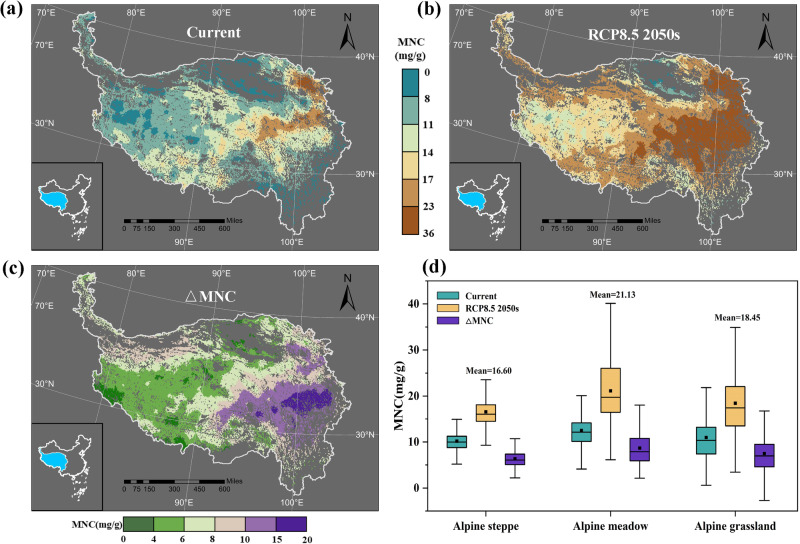
Microbial necromass carbon (MNC) can reflect soil carbon (C) sequestration capacity. However, changes in the reserves of MNC in response to warming in alpine grasslands across the Tibetan Plateau are currently unclear. Based on large-scale sampling and published observations, we divided eco-clusters based on dominant phylotypes, calculated their relative abundance, and found that their averaged importance to MNC was higher than most other environmental variables. With a deep learning model based on stacked autoencoder, we proved that using eco-cluster relative abundance as the input variable of the model can accurately predict the overall distribution of MNC under current and warming conditions. It implied that warming could lead to an overall increase in the MNC in grassland topsoil across the Tibetan Plateau, with an average increase of 7.49 mg/g, a 68.3% increase. Collectively, this study concludes that alpine grassland has the tendency to increase soil C sequestration capacity on the Tibetan Plateau under future warming.


Conflict of interest statement

The authors declare no competing interests.

Figures

Fig. 1
Fig. 1. Relationship between MNC and microbial related genes in the Tibetan Plateau.
a Spatial distributions of MNC (n = 96), (b) 16S rRNA gene concentration (n = 25), (c, d) C fixation and degradation gene, and (eg) their association with the current MNC in the topsoil across the Tibetan Plateau alpine grassland (n = 25). The M in the x-axis in (e) represents a million. The relative quantification of (f) and (g) represents the ratio of gene relative quantification to 16S rRNA gene relative quantification.
Fig. 2
Fig. 2. Abundances and compositions of defined eco-clusters and their network of interactions.
a Percentage of OTUs in each bacteria eco-cluster at the phylum level and fungi eco-cluster at the class level (n = 172). HMAP&LMAT: high MAP and low MAT, HSOC&LTN: high SOC and low TN, HMAP: high MAP, Hsilt: high silt, Hele: high elevation, HTN: high TN, Hele&LNDVI: high elevation and low NDVI, HNDVI&LNPP: high NDVI and low NPP, Lthickness: low thickness, HNPP&LNDVI: high NPP and low NDVI. b Bacteria network diagram with bacteria phylotypes as nodes and their Spearman correlation coefficient as edges. c Fungi network diagram with fungi phylotypes as nodes and their Spearman correlation coefficient as edges. The density of the node aggregation represents the proximity of the phylotypes. Each node represents a phylotype, and each color represents an eco-cluster.
Fig. 3
Fig. 3. RF analysis results and model validation.
a Importance ranking of RF analysis between MNC and environmental variables (n = 96). b CE model and (c) WE model K-fold cross validation result (n = 96). d CE model and (e) WE model hold-out validation result (n = 25). The degree of the linear fit of the points in (d, e) shows the relationship between observed and predicted MNC on a linear scale. RMSE root mean square error, MSE mean square error. NDVI normalized difference vegetation index, TP total phosphorus, BD bulk density, MAT mean annual temperature, cec cation exchange capacity, cf gravel content greater than 2 mm, MAP mean annual precipitation, NPP net primary productivity, TN total nitrogen, AI aridity index, TK total potassium.
Fig. 4
Fig. 4. Projected distribution of topsoil MNC in grasslands across the Tibetan Plateau.
a Current, (b) under RCP8.5 in the 2050 s, and (c) their D-values distribution. d Comparison of topsoil MNC in the alpine steppe (n = 4717), alpine meadow (n = 6033), and alpine grassland (n = 10,157) (current vs. RCP8.5 in 2050 s) and their D-values. The alpine grassland map was derived from China’s Vegetation Atlas (Editorial Committee for Vegetation Map of China, 2001). The grassland consists of meadows and steppes. The horizontal line and square black dots in each box represent the median and mean, respectively. The different colors in the box line chart denote the different periods (green: current, yellow: under RCP8.5 in 2050 s), and purple represents their D-values.

Similar articles

References

    1. Bossio DA, et al. The role of soil carbon in natural climate solutions. Nat. Sustain. 2020;3:391–398. doi: 10.1038/s41893-020-0491-z. - DOI
    1. Liang C, Amelung W, Lehmann J, Kästner M. Quantitative assessment of microbial necromass contribution to soil organic matter. Glob. Change Biol. 2019;25:3578–3590. doi: 10.1111/gcb.14781. - DOI - PubMed
    1. Liang C, Schimel JP, Jastrow JD. The importance of anabolism in microbial control over soil carbon storage. Nat. Microbiol. 2017;2:17105. doi: 10.1038/nmicrobiol.2017.105. - DOI - PubMed
    1. Zhang X, et al. Aridity and NPP constrain contribution of microbial necromass to soil organic carbon in the Qinghai-Tibet alpine grasslands. Soil Biol. Biochem. 2021;156:108213. doi: 10.1016/j.soilbio.2021.108213. - DOI
    1. He M, et al. Depth-dependent drivers of soil microbial necromass carbon across Tibetan alpine grasslands. Glob. Change Biol. 2022;28:936–949. doi: 10.1111/gcb.15969. - DOI - PubMed

Publication types