. 2024 Jul;25(7):1193-1206.
doi: 10.1038/s41590-024-01856-3. Epub 2024 Jun 4.

Cell shape sensing licenses dendritic cells for homeostatic migration to lymph nodes

Affiliations

Cell shape sensing licenses dendritic cells for homeostatic migration to lymph nodes

Zahraa Alraies et al. Nat Immunol. 2024 Jul.

Abstract

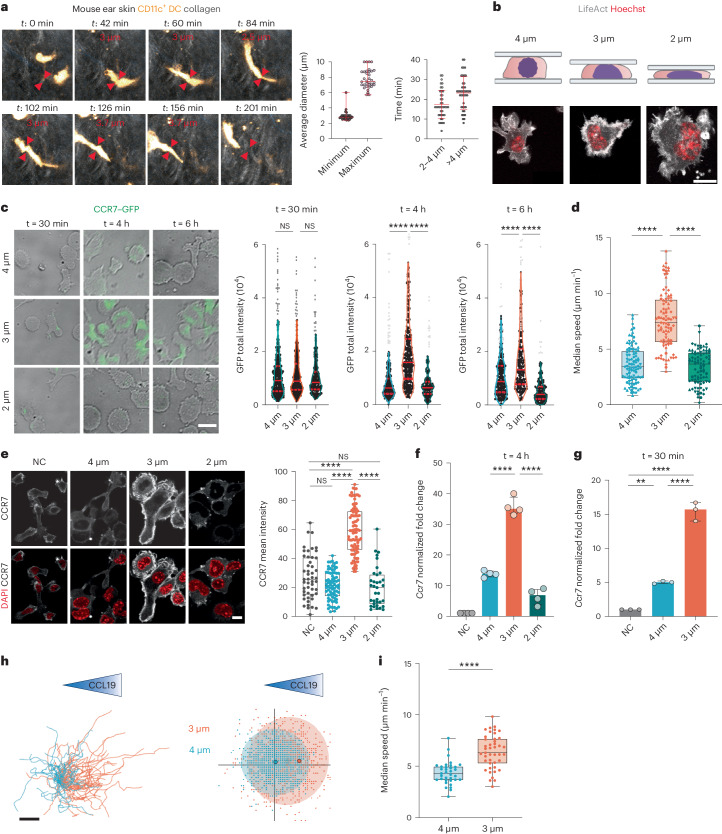
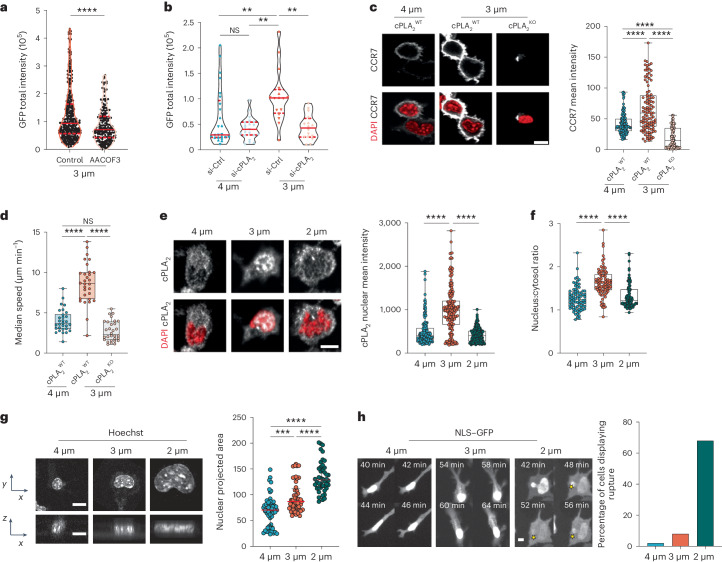
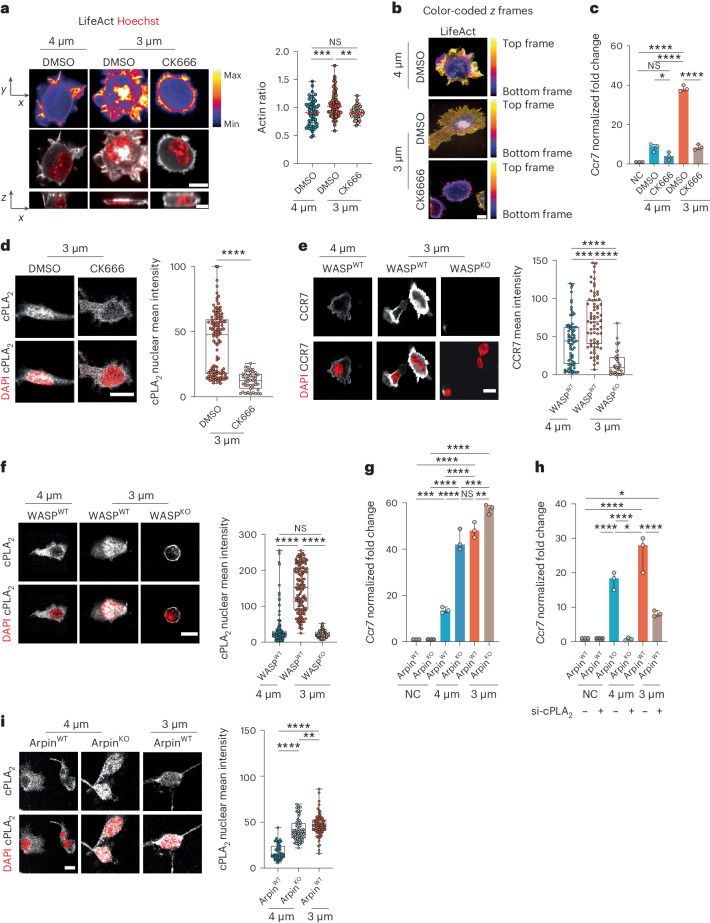
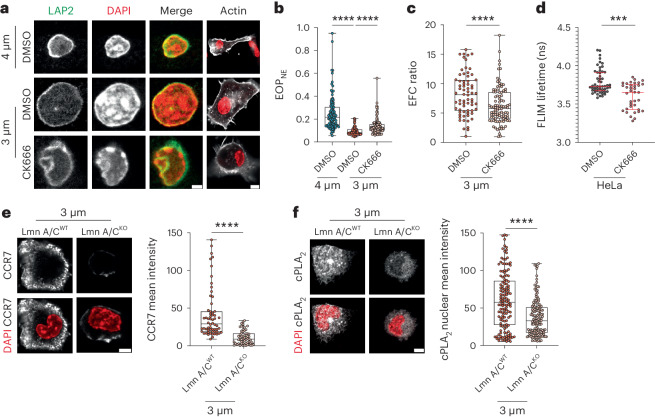
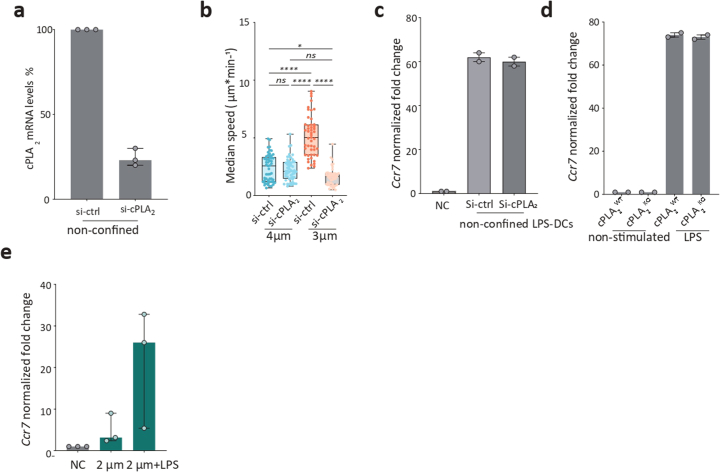
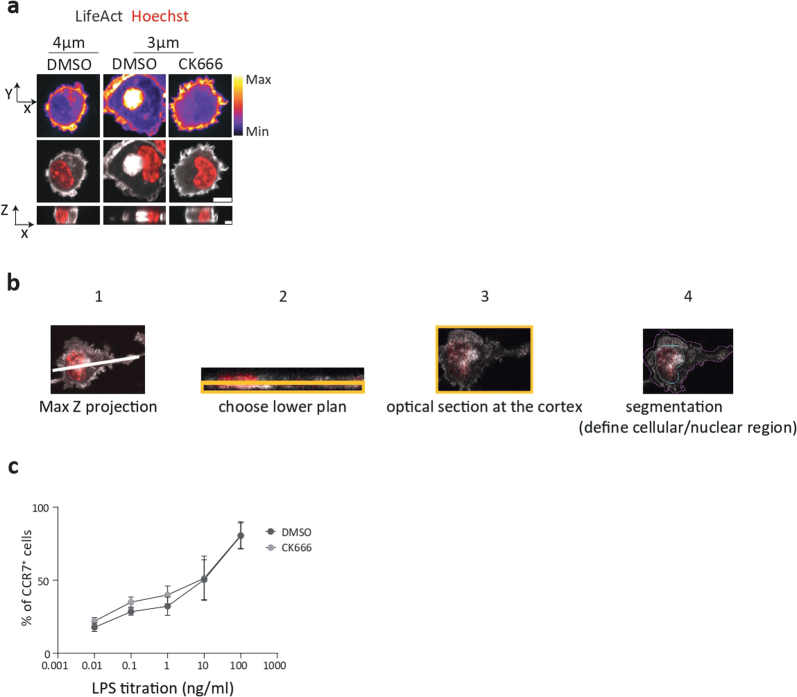
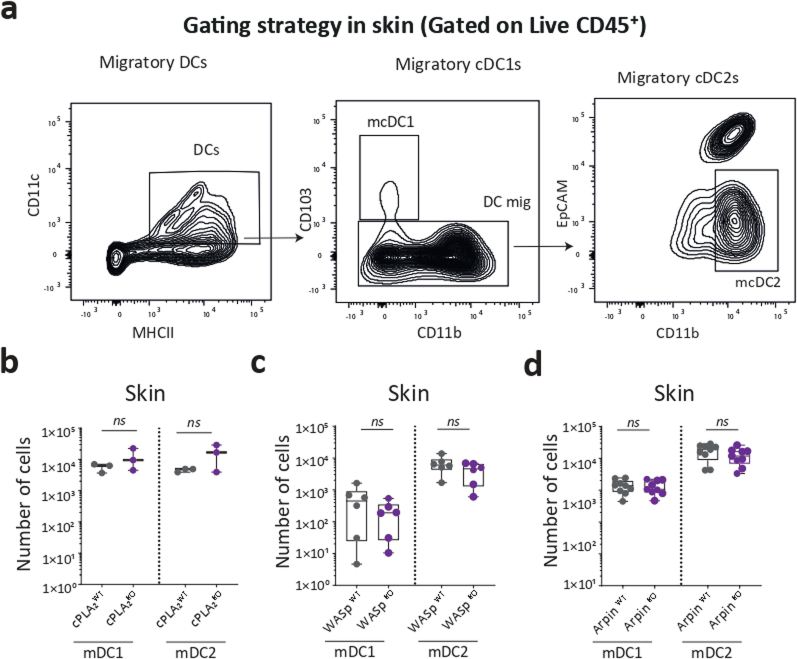
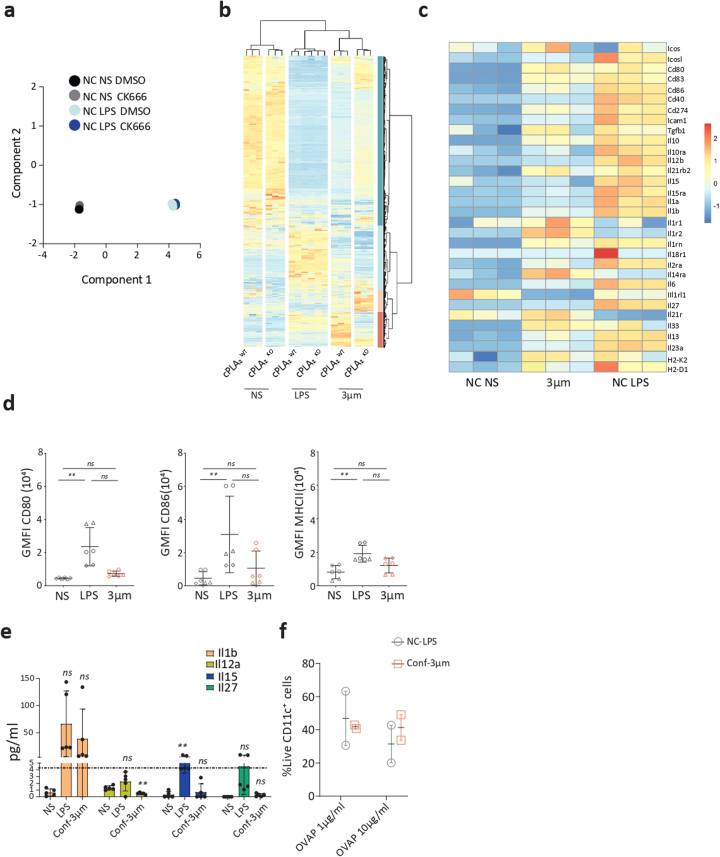
Immune cells experience large cell shape changes during environmental patrolling because of the physical constraints that they encounter while migrating through tissues. These cells can adapt to such deformation events using dedicated shape-sensing pathways. However, how shape sensing affects immune cell function is mostly unknown. Here, we identify a shape-sensing mechanism that increases the expression of the chemokine receptor CCR7 and guides dendritic cell migration from peripheral tissues to lymph nodes at steady state. This mechanism relies on the lipid metabolism enzyme cPLA2, requires nuclear envelope tensioning and is finely tuned by the ARP2/3 actin nucleation complex. We also show that this shape-sensing axis reprograms dendritic cell transcription by activating an IKKβ-NF-κB-dependent pathway known to control their tolerogenic potential. These results indicate that cell shape changes experienced by immune cells can define their migratory behavior and immunoregulatory properties and reveal a contribution of the physical properties of tissues to adaptive immunity.


Conflict of interest statement

The authors declare no competing interests.

Figures

Fig. 1
Fig. 1. CCR7 upregulation in immature DCs is shape sensitive.
a, Left, migrating CD11c+ DCs in an ear explant. Arrows highlight cell deformation events. Center, minimum to maximum range of median cell diameter (n = 34 cells). Right, average time spent by each cell at their minimum diameter (mean ± s.d.; n = 43 cells). b, Top, schematic of cells under confinement (created with BioRender.com). Bottom, representative images of live DCs expressing LifeAct–GFP (gray) and DNA (red); scale bar, 10 µm. c, Left, representative images of CCR7–GFP-expressing DCs; scale bar, 10 µm. Right, violin plot (median and quartiles) of total GFP intensity. Outliers were calculated using a ROUT test (Q = 1%) represented in gray (N = 4 independent experiments; left, n = 348 cells in 4 µm, n = 314 cells in 3 µm, n = 211 cells in 2 µm; middle, n = 201 cells in 4 µm, n = 206 cells in 3 µm, n = 176 cells in 2 µm; right, n = 215 cells in 4 µm, n = 187 cells in 3 µm, n = 180 cells in 2 µm). Data were analyzed by Kruskal–Wallis test; ****P < 0.0001; NS, not significant (P > 0.999). d, Box plot with minimum to maximum range of median speed (N = 4 independent experiments; n = 96 cells in 4 µm, n = 89 cells in 3 µm, n = 85 cells in 2 µm). Data were analyzed by Kruskal–Wallis test; ****P < 0.0001. e, Left, representative images of DCs showing CCR7 expression (gray) and nuclei (red). A maximum z projection is shown; scale bar, 10 µm. Right, box plot with minimum to maximum range (N = 2 independent experiments; n = 49 nonconfined cells, n = 74 cells in 4 µm, n = 89 cells in 3 µm, n = 35 cells in 2 µm). Data were analyzed by Kruskal–Wallis test; ****P < 0.0001; NS, P > 0.999; NC, nonconfined. f, Expression of Ccr7. Data are shown as mean ± s.d. (N = 4 independent experiments). Data were analyzed by Kruskal–Wallis test; ****P < 0.0001. g, Expression of Ccr7 after 30 min of confinement. Data are shown as mean ± s.d. (N = 3 independent experiments). Data were analyzed by Kruskal–Wallis test; **P = 0.0021; ****P < 0.0001. h, Left, cell trajectories; scale bar, 100 µm. Middle, representation of cell step. Data are representative of two independent experiments (n = 33 cells in 4 µm; n = 43 cells in 3 µm). i, Box plot with minimum to maximum range of mean speed. Data were analyzed by one-way Mann–Whitney test; ****P < 0,0001. Data are representative of two independent experiments (n = 33 cells in 4 µm; n = 43 cells in 3 µm). Source data
Fig. 2
Fig. 2. CCR7 upregulation in response to shape sensing depends on cPLA2 and an intact nuclear envelope.
a, GFP intensity in DCs treated with the cPLA2 inhibitor AACOF3 (25 µM) or control. The violin plot shows median values and quartiles (N = 3, n = 348 cells in the 3-µm control, n = 225 cells treated with AACOF3). Data were analyzed by one-way Mann–Whitney test; ****P < 0.0001. b, Expression of CCR7–GFP in Pla2g4a-knockdown (si-cPLA2) and control (si-Ctrl) DCs. The violin plot shows median values and quartiles (N = 2, n = 25 cells in si-Ctrl at 4 µm (80% of cells), n = 21 cells in si-cPLA2 at 4 µm (75% of cells), n = 16 cells in si-Ctrl at 3 µm (75% of cells), n = 16 cells in si-cPLA2 at 3 µm (76% of cells)). Data were analyzed by one-way analysis of variance (ANOVA) with a Kruskal–Wallis multiple comparison analysis; **P = 0.0059; **P = 0.0039. c, Left, representative images of cPLA2WT and cPLA2KO DCs. CCR7 is in gray, and nuclei are in red; scale bar, 10 µm. Right, box plot with minimum to maximum range of CCR7 intensity (N = 3, n = 114 cells in cPLA2WT at 4 µm, n = 105 cells in cPLA2WT at 3 µm, n = 86 cells in cPLA2KO at 3 µm). Data were analyzed by Kruskal–Wallis test; ****P < 0.0001. d, Box plot showing the minimum to maximum range of median speed of cPLA2WT and cPLA2KO DCs (N = 2, n = 30 cells in all positions). Data were analyzed by Kruskal–Wallis test; ****P < 0.0001; NS, P > 0.999. e, Left, representative images of confined DCs. cPLA2 is in gray, and nuclei are in red; scale bar, 10 µm. Right, box plot showing the minimum to maximum range of cPLA2 intensity (N = 3, n = 165 cells in 4 µm, n = 178 cells in 3 µm, n = 230 cells in 2 µm). Data were analyzed by Kruskal–Wallis test; ****P < 0.0001. f, Nucleus-to-cytosolic ratio of cPLA2 expression. The box plot shows the minimum to maximum range (N = 3, n = 165 cells in 4 µm, n = 178 cells in 3 µm, n = 230 cells in 2 µm). Data were analyzed by Kruskal–Wallis test; ****P < 0.0001. g, Left, projection of cell nuclei; scale bar, 10 µm. Right, box plot showing the median and interquartile range of the nucleus area (N = 3, n = 55 cells in 4 µm, n = 49 cells in 3 µm, n = 44 cells in 2 µm). Data were analyzed by Kruskal–Wallis test; ****P < 0.0001; ***P < 0.0006. h, Left, images of DCs transduced with NLS–GFP. Yellow stars indicate nuclear envelope rupture. Right, percentage of DCs displaying rupture events (n = median of 3 independent experiments). Source data
Fig. 3
Fig. 3. ARP2/3 activity tunes the sensitivity of the cPLA2-dependent shape-sensing DC response.
a, Top, representative images of LifeAct–GFP DCs treated with CK666 (30 µM) or untreated. Middle, images of LifeAct–GFP (gray) and nuclei (red); scale bar 10 µm. Bottom, single resliced image; scale bar, 20 µm. Right, median with range of LifeAct nucleus-to-cytosol ratio (N = 3; n = 55 cells in 4 µm (DMSO), n = 70 cells in 3 µm (DMSO), n = 42 cells in 3 µm (CK666)). Data were analyzed by ordinary one-way ANOVA; ***P = 0.0007; **P = 0.0016. b, Color-coded z frames of untreated LifeAct DCs and cells treated with 30 µM CK666. c, Expression of Ccr7 (mean ± s.d.; N = 3). Data were analyzed by ordinary one-way ANOVA; ****P < 0.0001; *P = 0.0465; NS, P > 0.999. d, Left, representative images of DCs treated with 30 µM CK666 or untreated cells. cPLA2 is in gray, and nuclei are in red; scale bar, 10 µm. Right, box plot showing the minimum to maximum range of cPLA2 intensity (N = 2; n = 121 cells in DMSO (3 µm), n = 64 cells in CK666 (3 µm)). Data were analyzed by one-way Mann–Whitney test; ****P < 0.0001. e, Left, representative images of WASpWT/WASpKO DCs. CCR7 is in gray, and nuclei are in red; scale bar, 10 µm. Right, box plot showing the minimum to maximum range of CCR7 intensity (N = 2; n = 70 cells in WASpWT at 4 µm, n = 70 cells in WASpWT at 3 µm, n = 38 cells in WASpKO at 3 µm). Data were analyzed by Kruskal–Wallis test; ****P < 0.0001; ***P < 0.0002. f, Left, representative images of WASpWT/WASpKO DCs. cPLA2 is in gray, and the nuclei are in red; scale bar, 10 µm. Right, box plot showing the minimum to maximum range of cPLA2 intensity (N = 3; n = 150 cells in WASpWT at 4 µm, n = 145 cells in WASpWT at 3 µm, n = 149 cells in WASpKO at 3 µm). Data were analyzed by Kruskal–Wallis test; ****P < 0.0001. g, Expression of Ccr7 in ArpinWT/ArpinKO DCs. Data are shown as mean ± s.d. (N = 3) and were analyzed by ordinary one-way ANOVA; ****P < 0.0001; ***P = 0.0002; **P = 0.0015; NS, P > 0.999. h, Expression of Ccr7 in ArpinWT/ArpinKO DCs (N = 3). Data were analyzed by ordinary one-way ANOVA; ****P < 0.0001; *P = 0.0134. i, Left, representative images of ArpinWT/ArpinKO DCs. cPLA2 is in gray, and nuclei are in red; scale bar, 10 µm. Right, box plot showing the minimum to maximum range of cPLA2 intensity (N = 2; n = 59 cells in ArpinWT at 4 µm, n = 87 cells in ArpinKO at 4 µm, n = 75 cells in ArpinWT at 3 µm). Data were analyzed by ordinary one-way ANOVA; ****P < 0.0001; **P = 0.0043. Source data
Fig. 4
Fig. 4. ARP2/3 activity mediates DC shape sensing by unfolding the nuclear envelope and increasing its tension.
a, Representative images of DCs treated with 30 µM CK666 or untreated. LAP2 and DAPI are in gray on the left. Merged images of DAPI (red) and LAP2 (green) and of DAPI (red) and phalloidin (gray) are shown on the right; scale bars, 2 µm (left merge) and 10 µm (right merge). Images are representative of N = 2 samples. b, EOPNE of confined DCs treated with 30 µM CK666 or untreated DCs. Box plots show the minimum to maximum range (N = 3; n = 100 cells in 4 µm (DMSO), n = 93 cells in 3 µm (DMSO), n = 97 cells in 3 µm (CK666)). Data were analyzed by ordinary one-way ANOVA; ****P < 0.0001. c, EFC of confined DCs treated with 30 µM CK666 or untreated DCs. Box plots show the minimum to maximum range (N = 3; n = 68 cells in 3 µm (DMSO), n = 97 cells in 3 µm (CK666)). Data were analyzed by one-way Mann–Whitney test; ****P < 0.0001. d, Nuclear envelope tension sensor FLIM measurements in HeLa cells after treatment with 30 µM CK666. Data are shown as median values with the interquartile range (N = 3; n = 53 cells (control), n = 47 cells (CK666)). Data were analyzed by one-way Mann–Whitney test; ***P < 0.0001. e, Left, representative images of DCs from LmnA/CWT and LmnA/CKO DCs. CCR7 is in gray, and the nuclei are in red; scale bar, 5 µm. Right, box plots showing the minimum to maximum range of CCR7 intensity (N = 3; n = 54 cells (LmnA/CWT), n = 60 cells (LmnA/CKO)). Data were analyzed by ordinary one-way ANOVA; ****P < 0.0001. f, Left, representative images of DCs from LmnA/CWT and LmnA/CKO DCs. cPLA2 is in gray, and the nuclei are in red; scale bar, 5 µm. Right, box plot showing the minimum to maximum range of cPLA2 intensity (N = 3; n = 141 cells (LmnA/CWT), n = 144 cells (LmnA/CKO)). Data were analyzed by unpaired t-test with a Welch’s correction; ****P < 0.0001. Source data
Fig. 5
Fig. 5. Steady-state migration of skin migratory cDC2s is cell shape sensitive.
a, Schematic representation of the work flow. The picture of the mouse was created using BioRender.com. b, Gating strategy to quantify DCs in skin draining lymph nodes (dLNs). Top, representative example of the data in cPLA2WT inguinal lymph nodes. Bottom, representative example of the data obtained in cPLA2KO inguinal lymph nodes. Briefly, after gating on live cells, immune cells were identified as CD45high; CD11c and MHC class II were then used to differentiate lymph node-resident DCs (MHC class IIlowCD11chigh) from migratory (mig) DCs (MHC class IIhighCD11chigh). Among migratory DCs, migratory cDC1s (mcDC1) were identified as CD11blowCD103high, and migratory cDC2s (mcDC2) were identified as CD11bhighEPCAMlow. c, Box plots showing the minimum to maximum range in log scale of the number of migratory DCs in cPLA2WT and cPLA2KO mice (N = 3 independent experiments, where each dot is one mouse). Data were analyzed by one-way Mann–Whitney U-test; *P = 0.0221. d, Box plots showing the minimum to maximum range in log scale of the number of migratory DCs in WASpWT and WASpKO mice (N = 3 independent experiments, where each dot is one mouse). Data were analyzed by ordinary one-way Mann–Whitney U-test; **P = 0.0059. e, Box plots showing the minimum to maximum range in log scale of the number of migratory DCs in ArpinWT and ArpinKO (N = 3 independent experiments, where each dot is one mouse). Data were analyzed by ordinary one-way Mann–Whitney U-test; *P = 0.04. Source data
Fig. 6
Fig. 6. cPLA2 reprograms DC transcription in an IKKβ–NF-κB-dependent manner.
ad, Bulk RNA-seq analysis of cPLA2WT and cPLA2KO DCs; NC NS, nonconfined nonstimulated. a, Multidimensional scaling (MDS) of the samples. Sample groups under different confinement conditions are represented by different forms. Each dot represents a biological replicate; dim, dimension; FC, fold change. b, Pie charts showing proportions of differentially expressed genes in cells under confined conditions compared to nonconfined cells (false discovery rate < 0.05 and log2 (fold change) of <–1.0 or >1.0). Top, number of upregulated genes in confinement in cPLA2WT and cPLA2KO DCs (5,695 genes). Bottom, number of downregulated genes in confinement in both cPLA2WT and cPLA2KO DCs (4,666 genes). c, Ccr7 estimated gene counts in the different samples/conditions. d, Heat map of genes harboring a similar expression pattern as Ccr7. e, Heat map of the genes moving with Ccr7 expression in response to treatment with CK666 (30 µM). f, Heat map of all differentially expressed genes in response to treatment with CK666 (30 µM) in confined and nonconfined DCs. g, Heat map showing normalized expression of some IFN-stimulated genes in the CD11b+ cDC2 subset from the dermis and their migratory counterparts in the cutaneous draining lymph node of healthy mice (GSE49358 microarray study from Tamoutounour et al.). h, Ccr7 expression in response to treatment with BI605906 (30 µM). Data are shown as mean ± s.d. (N = 2, n = 6) and were analyzed by ordinary one-way ANOVA; ****P < 0.0001. i, Ccr7 expression in cells from IkbkbWT or IkbkbKO mice. Data are shown as mean ± s.d. (N = 2, n = 6) and were analyzed by ordinary one-way ANOVA; ****P < 0.0001. j, Top, representative images of cPLA2WT and cPLA2KO DCs. NF-κB (P65) is in gray, and the nuclei are in red; scale bar, 10 µm. Bottom, box plot showing the minimum to maximum range of NF-κB (P65) intensity (N = 2, n = 55 cells in 4 µm (cPLA2WT), n = 63 cells in 3 µm (cPLA2WT), n = 34 cells in 4 µm (cPLA2KO)). Data were analyzed by Kruskal–Wallis test; ****P < 0.0001. k, Left, representative images of DCs treated with the IKKβ inhibitor BI605906 (30 µM) and nontreated control DCs. cPLA2 is in gray, and nuclei are in red; scale bar, 12 µm. Right, box plot showing the minimum to maximum range of cPLA2 intensity (N = 2, n = 29 cells (DMSO), n = 23 cells (BI605906)). Data were analyzed by ordinary one-way ANOVA; *P = 0.0175. Source data
Fig. 7
Fig. 7. cPLA2-dependent transcriptional reprogramming in response to shape sensing shapes DC properties.
a, MDS of samples. b, Heat map of cPLA2-related genes. c, Top, representative images of untreated control cPLA2KO DCs and cPLA2KO DCs treated with 2.5 µg ml–1 PGE2 for 30 min in the presence or absence of BI605906 (30 µM) before confinement. CCR7 is in gray, and nuclei are in red; scale bar, 10 µm; Gaussian blur of 0.5 µm. Right, box plot showing the minimum to maximum range of CCR7 intensity (N = 3; n = 87 cells in 3 µm (control), n = 99 cells in 3 µm (PGE2), n = 87 cells in 3 µm (PGE2 + BI605906)). Data were analyzed by Kruskal–Wallis test; ****P < 0.0001; **P = 0.0026. Bottom, representative images of nonconfined untreated DCs or DCs treated with 2.5 µg ml–1 PGE2 for 30 min in the presence or absence of BI605906 (30 µM). NF-κB (P65) is in gray, and nuclei are in red; scale bar, 10 µm; Gaussian blur of 0.5 µm. Right, box plot showing the minimum and maximum range of NF-κB intensity (N = 3; n = 133 cells (control), n = 191 cells (PGE2), n = 138 cells (PGE2 + BI605906)). Data were analyzed by Kruskal–Wallis test; ****P < 0.0001. d, Pathway analysis of differentially expressed genes in confined versus LPS-treated DCs; arrow width corresponds to the enrichment score from the significantly enriched (P < 0.05) genes. e, Heat map of genes in the ‘regulation of helper T cell differentiation’ pathway marked in blue in d. f, Antigen presentation assays with T cells incubated with DCs activated with LPS or confined at a height of 3 µm. Left, percentage of CD69+CD4+ T cells among live cells after 18 h of incubation with OVA peptide II (OVAp). Right, Percentage of CFSECD4+ OT-II T cells among live cells after 3 days of incubation with OVA peptide II. Data are shown as mean ± s.e.m. of duplicate measures of each independent experiment (N = 5). Data were analyzed by multiple unpaired Student’s t-tests; ***P = 0.0001; ****P < 0.0001. g, Transcription factor analysis of the different conditions. Transcription factor activity estimation used the TRUUST database, which predicts transcription factor activity and assigns a score. Arrow thickness corresponds to the enrichment score of each transcription factor. Source data
Extended Data Fig. 1
Extended Data Fig. 1. GFP quantification approach.
(a) Quantification approach to quantify GFP intensity in each cells. (b) Quantification of cell viability in different confinement conditions and during different time points, using propidium iodide (c) representative images of immature DCs confined for 4 h at the height of 3 µm from C57BL/6 J (WT) or GFP/GFP mice (Ccr7KO), CCR7 was visualized using immunostaining (in orange) and the nucleus stained with DAPI (in cyan) scale bar 5 µm. Source data
Extended Data Fig. 2
Extended Data Fig. 2. cPLA2 activity is not necessary for LPS-induced Ccr7 up regulation.
(a) median with interquartile range of cPLA2 gene expression upon its knock down, N = 3, n = 9 (b) Box plot with min to max range of median speed of cPLA2 KD or control DCs. N = 3, n = 53 cells in cPLA2 Ctrl4µm, n = 53 cells in cPLA2 KD 4µm, n = 49 cells in cPLA2 Ctrl 3 µm, n = 44 cells in cPLA2 KD 3 µm. one way ANOVA with Kruskal-Wallis multiple analysis test, ****:P < 0.0001, *: P = 0.0315, ns: not significant P = 0.0813. (c) RT-qPCR data of Ccr7 gene expression shows no difference in Ccr7 expression in cPLA2 KD or control cells activated with the microbial component LPS, median with interquartile range of 2 independent experiments, n = 6 (d) RT-qPCR data of Ccr7 gene expression in cPLA2 WT and KO DCs activated with LPS activated with LPS. median with interquartile range of 3 independent experiments. (e) RT- qPCR data of Ccr7 gene expression in cells confined at 2 µm activated with LPS after confinement, median with interquartile range of 3 independent experiments, n = 9. Source data
Extended Data Fig. 3
Extended Data Fig. 3. Arp2/3 branched actin is not important for CCR7 upregulation upon LPS.
(a) Second example: Upper panel: representative XY images of DCs expressing LifeAct-GFP (false colors), Middle panel: XY images of LifeAct-GFP DCs (in grey) stained with NucBlue (DNA, red) treated or not with CK666 (30 µM), scale bar 10 µ. lower panel: XZ view, single confocal frame from resliced images, scale bar 20 µ. (b) Quantification approach of LifeAct-GFP intensity in cells under confinement: 1- choose Z-stack lower plan (since cells don’t always touch the upper plan). 2 optical section at the surface cortex. 3-Segmentation to define cell and nuclear contour at the surface. 4- Measurement of LifeAct-GFP ratio: Actin Ratio= Nuclear surface mean actin intensity/cell surface mean actin intensity (ratio <1 => actin is mostly cortical). (c) FACS analysis of CCR7+ DCs activated by different concentration of LPS and treated with CK666 (30 µM) or DMSO. N = 3 independent experiments. Source data
Extended Data Fig. 4
Extended Data Fig. 4. Gating strategy for DC quantification in the skin.
(a) Gating strategy to quantify DCs in the skin of different mice at steady-state: after gating on live cells, immune cells were identified as CD45high; CD11c and MHCII were then used to differentiate lymph node-resident DCs (MHCII low, CD11chigh) from migratory DCs (MHCIIhigh, CD11chigh). Among migratory cDCs, mDC1s were identified as CD11bhigh, CD103low and mDC2s as CD11bhigh, EPCAMlow. (b) Box plots with min to max range in Log scale of the number of DCs in the skin of cPLA2WT and cPLA2KO mice, N = 2 independent experiments, n = 3 mice (where each dot is a mouse).Mann-Whitney U-test ns: non-significant. (c) Box plots with min to max range in Log scale of the number of migratory DCs in the skin of WASp WT and WASp KO mice, N = 2 independent experiments, n = 6 mice (where each dot is a mouse).Mann-Whitney U-test, ns: non-significant. (d) Box plots with min to max range in Log scale showing the number of migratory DCs in the skin of Arpin WT and KO mice, N = 3 independent experiments, n = 9 mice (where each dot is a mouse). Mann-Whitney U-test, ns: non-significant. Source data
Extended Data Fig. 5
Extended Data Fig. 5. Transcriptional changes in DC in response to confinement are cPLA2-dependent.
(a) Multidimensional scaling (MDS) of non-confined DCs stimulated or not with LPS and treated or not with CK666 (b) Heatmap of all the differentially expressed genes in cPLA2 WT and KO cells in all the different conditions (c) Heat map of examples of cytokines and costimulatory and MHC-I genes in DCs in response to confinement or LPS (d) FACS analysis of some immune-activating genes expressed by DCs not-stimulated (NS) controls or in response to LPS or confinement at 3 µm height. Graphs of Mean with SD showing geometric mean intensity of CD80, CD86, and MHCII. N = 3 each condition was done in duplicates, Kruskal-Wallis test CD80 plot: ** p = 0.003, ns: not significant p = 0.1547. CD86 plot: **: p = 0.0083, ns: not significant p = 0.4684. MHCII plot: **: p = 0.0041, ns: not significant p = 0.2886 (e) cytokine secretion analysis by luminex of some cytokines in the supernatant of LPS or confined DCs 48h after the confinement or the LPS activation. Graph of Mean with SD of 5 independent experiments, each condition was done in triplicates. 2 way ANOVA test **: p = 0.0039, ns: not significant p = 0.1186, p = 0.3014, p = 0.3329, p = 0.7488, p = 0.1212, p = 0.0922 respectively(f) percentage of live DCs CD11c high after 48 hour of confinement and incubation with OTII T-cells. Graph: mean with SEM, n = 6, N = 2 independent experiments, each condition was done in duplicates. Source data
Extended Data Fig. 6
Extended Data Fig. 6. The Arp2/3 cPLA2 pathway induces a tolerogenic signature in the confined DCs.
(a, b) statistical analysis used to determine genes with log FC > 1 and P value < 0.05 is detailed in the methods section. (a)Example of the top 30 genes that are upregulated in the confined DCs which their expression depends on cPLA2 and Arp2/3 activity. (b) Reactom pathway analysis of the genes upregulated in DCs in response to shape sensing in an Arp2/3- cPLA2- dependent manner. Source data
Extended Data Fig. 7
Extended Data Fig. 7. A model figure.
A model figure representing cell shape sensing pathway in patrolling dendritic cells, created with Inkscape. Source data

Similar articles

Cited by

References

    1. Parsons JT, Horwitz AR, Schwartz MA. Cell adhesion: integrating cytoskeletal dynamics and cellular tension. Nat. Rev. Mol. Cell Biol. 2010;11:633–643. doi: 10.1038/nrm2957. - DOI - PMC - PubMed
    1. Muncie JM, Weaver VM. The physical and biochemical properties of the extracellular matrix regulate cell fate. Curr. Top. Dev. Biol. 2018;130:1–37. doi: 10.1016/bs.ctdb.2018.02.002. - DOI - PMC - PubMed
    1. Hughes CE, Nibbs RJB. A guide to chemokines and their receptors. FEBS J. 2018;285:2944–2971. doi: 10.1111/febs.14466. - DOI - PMC - PubMed
    1. Förster R, Davalos-Misslitz AC, Rot A. CCR7 and its ligands: balancing immunity and tolerance. Nat. Rev. Immunol. 2008;8:362–371. doi: 10.1038/nri2297. - DOI - PubMed
    1. Weber M, et al. Interstitial dendritic cell guidance by haptotactic chemokine gradients. Science. 2013;339:328–332. doi: 10.1126/science.1228456. - DOI - PubMed