. 2024 Jul;133(1):21-32.
doi: 10.1038/s41437-024-00689-y. Epub 2024 Jun 4.

The structure of the TH/INS locus and the parental allele expressed are not conserved between mammals

Affiliations

The structure of the TH/INS locus and the parental allele expressed are not conserved between mammals

Trent Newman et al. Heredity (Edinb). 2024 Jul.

Abstract

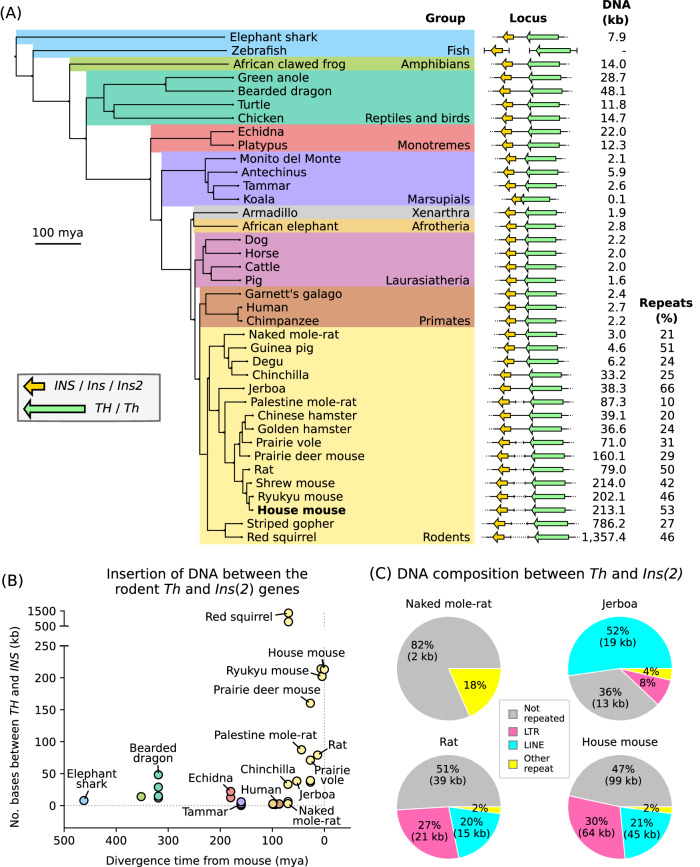
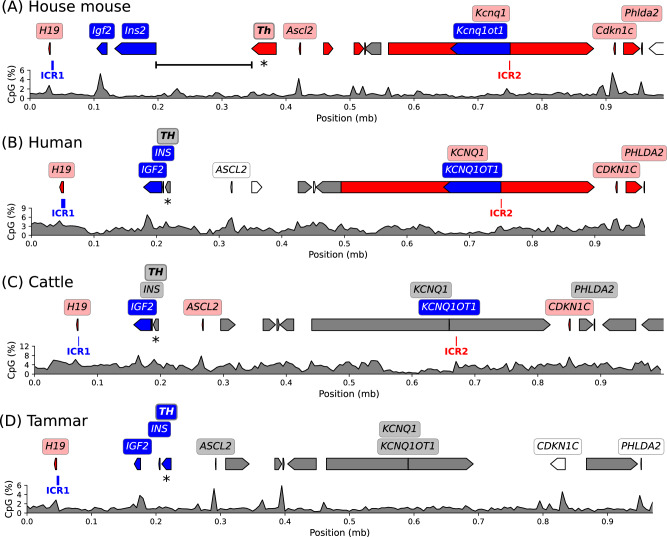
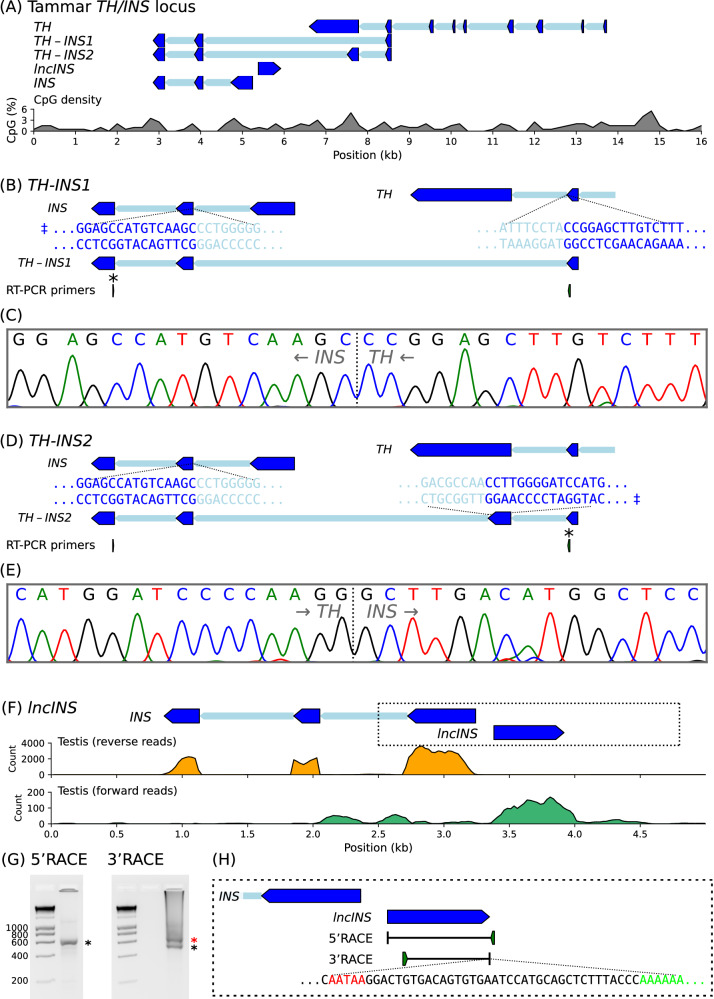
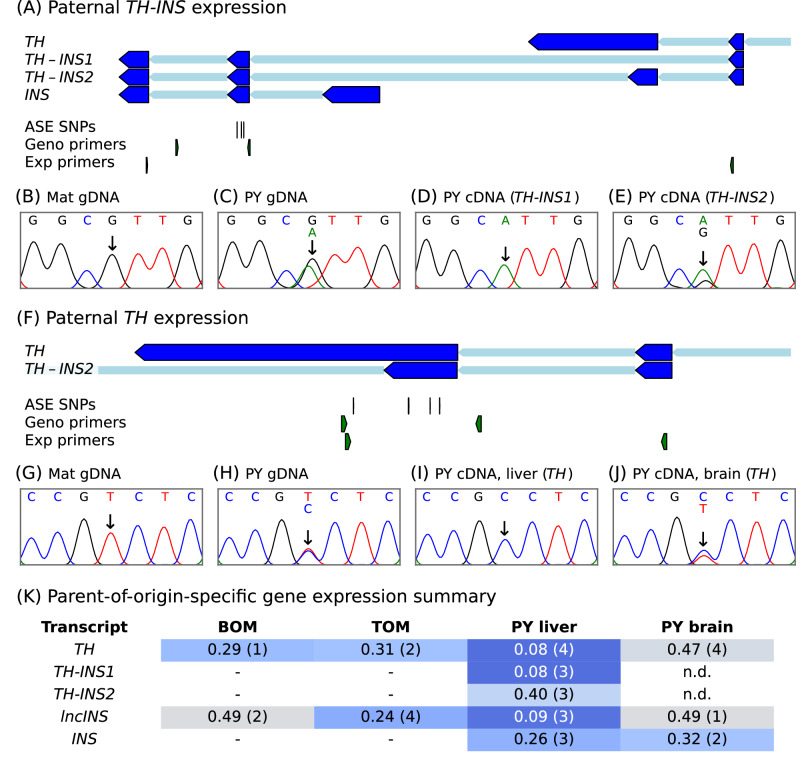
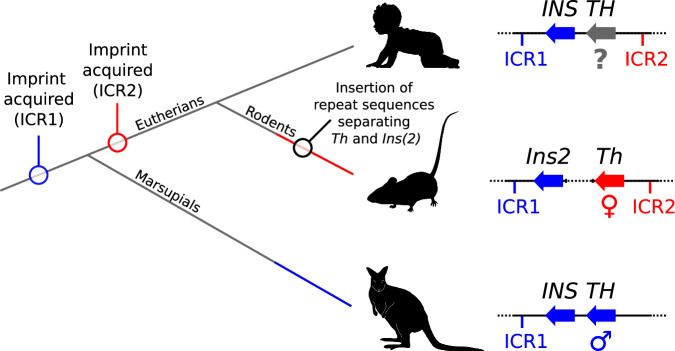
Parent-of-origin-specific expression of imprinted genes is critical for successful mammalian growth and development. Insulin, coded by the INS gene, is an important growth factor expressed from the paternal allele in the yolk sac placenta of therian mammals. The tyrosine hydroxylase gene TH encodes an enzyme involved in dopamine synthesis. TH and INS are closely associated in most vertebrates, but the mouse orthologues, Th and Ins2, are separated by repeated DNA. In mice, Th is expressed from the maternal allele, but the parental origin of expression is not known for any other mammal so it is unclear whether the maternal expression observed in the mouse represents an evolutionary divergence or an ancestral condition. We compared the length of the DNA segment between TH and INS across species and show that separation of these genes occurred in the rodent lineage with an accumulation of repeated DNA. We found that the region containing TH and INS in the tammar wallaby produces at least five distinct RNA transcripts: TH, TH-INS1, TH-INS2, lncINS and INS. Using allele-specific expression analysis, we show that the TH/INS locus is expressed from the paternal allele in pre- and postnatal tammar wallaby tissues. Determining the imprinting pattern of TH/INS in other mammals might clarify if paternal expression is the ancestral condition which has been flipped to maternal expression in rodents by the accumulation of repeat sequences.


Conflict of interest statement

The authors declare no competing interests.

Figures

Fig. 1
Fig. 1. Accumulation of DNA between Th and Ins(2) orthologues over evolutionary time in the rodent lineage.
A The number of bases between the TH/Th and INS/Ins/Ins2 genes is given for different species and the relationships of those species are placed in terms of either their phylogenetic grouping or (B) the species divergence relative to the house mouse. Divergence times, millions of years ago (mya), are those indicated by TimeTree. Illustration of the gene locus (A) is not to scale. C The percent of the rodent DNA segment between Th and Ins(2) comprised of different classes of repeated elements is shown for the naked mole-rat, jerboa, rat and house mouse.
Fig. 2
Fig. 2. Parent-of-origin-specific expression in the broader ICR1/ICR2 imprinted region.
The genomic context of the orthologous TH/INS locus is shown for the (A) house mouse, (B) human, (C) cattle and (D) tammar wallaby. The colour of the gene indicates parental expression; blue is paternal, red is maternal, grey is unknown, white is biallelic. The paternally-methylated ICR1 position is indicated in blue, the maternally-methylated ICR2 position is noted in red. The TH gene is marked with an asterisk. The genomic distance between Th and Ins2 is indicated for the mouse (A). The KCNQ1OT1 position in cattle and tammar indicates 500 and 400 bp amplicons that have been detected for this transcript (Ager et al. ; Robbins et al. 2012). Plots below display CpG density as a percentage averaged over 5 kilobase (kb) windows, mb: million base pairs.
Fig. 3
Fig. 3. Organisation of the tammar wallaby TH/INS locus.
A The tammar wallaby TH/INS gene locus showing exons as arrowheads indicating the direction of transcription, introns are thinner shaded regions. The blue colouring reflects the paternal expression pattern. Plot below displays CpG density as a percentage averaged over 200 bp windows. B, D Structure of the chimaeric TH-INS1 and TH-INS2 transcripts noting exonic (dark blue) and intronic (light blue) DNA sequences for the TH exon used and the second INS exon. An asterisk indicates the primer used for sequencing of the RT-PCR product and the double dagger indicates the sequence strand assessed. C, E Sanger sequencing chromatogram showing the junction, indicated by a dotted line, between the TH sequence and the INS sequence. Arrows indicate the direction of transcription. F Identification of an antisense transcript at the INS start site (dotted box) in testis transcriptome data with reads split into forward strand (green) and reverse strand (orange). Amplification of the antisense lncRNA was performed by (G) 5′ and 3′ RACE using adult testis cDNA. One of the two 3′RACE products (black asterisks) was isolated which encoded (H) a non-coding transcript with polyadenylation signal (red) and poly-A tail (green). The sequence of the larger 3′RACE product (red asterisks) was not confirmed.
Fig. 4
Fig. 4. Paternal transcription of TH/INS in the tammar wallaby.
A, F Primer and SNP positions for allele-specific expression (ASE) analysis of TH-INS and TH. The blue colour of the exons reflects the paternal expression pattern. The TH-INS genotyping primer set (Geno primers) had at least one intronic primer; the cDNA expression primer set (Exp primers) had an intron-spanning primer. BE, GJ Parent-of-origin-specific transcription of TH-INS and TH. Sanger sequencing chromatograms showing the presence of (B, G) the homozygous maternal genotype, (C, H) the heterozygous SNP in PY gDNA, and (D, E, I, J) the allele present in PY cDNA. K Tabular summary of parent-of-origin-specific gene expression for the different RNA species detected from the TH/INS locus. A mean “mat:pat ratio” value closer to 0 indicates paternal expression (blue shading) while values closer to 0.5 indicate biallelic expression (grey shading). The number of animals is in brackets. “n.d.” indicates not detected. Placenta tissues taken from fetal stage samples, liver and brain taken from PY stage samples. BOM bilaminar omphalopleure, TOM trilaminar omphalopleure. See also, Supplementary Fig. 1 and Supplementary Table 3.
Fig. 5
Fig. 5. The possible evolutionary path leading to a change in the parental origins of TH/Th expression.
(Left) Cladogram indicating the acquisition of ICR1 in the therian ancestor, acquisition of ICR2 in the eutherian ancestor and the separation of Th and Ins(2) in the rodent lineage. Maternal Th expression in the rodent lineage is indicated by the branch having a red colour. Paternal TH expression in the marsupial lineage is indicated by the branch having a blue colour. The unknown parent-of-origin-specific expression of TH in non-rodent eutherians and ancestral therians is indicated by the grey line colour. (Right) Simplified diagram of the TH/INS region highlighting the unknown parental origin of expression (grey) of TH in non-rodent eutherians, maternal expression (red) of Th in the mouse and paternal expression (blue) of TH in the wallaby. Also indicated is the acquisition of the paternally-methylated (blue) ICR1 and maternally-methylated (red) ICR2. The larger distance between Th and Ins2 in the mouse is indicated by a dotted line between the genes. Species silhouettes include Homo sapiens sapiens by Andrew A. Farke (CC BY 3.0), Murinae by Katy Lawler (CC BY 4.0) and Notamacropus eugenii by Geoff Shaw (CC BY 4.0), courtesy of https://www.phylopic.org.

Similar articles

Cited by

  • PRKACB is a novel imprinted gene in marsupials.
    Newman T, Bond DM, Ishihara T, Rizzoli P, Gouil Q, Hore TA, Shaw G, Renfree MB. Newman T, et al. Epigenetics Chromatin. 2024 Sep 28;17(1):29. doi: 10.1186/s13072-024-00552-8. Epigenetics Chromatin. 2024. PMID: 39342354 Free PMC article.

References

    1. Ager EI, Pask AJ, Gehring HM, Shaw G, Renfree MB. Evolution of the CDKN1C-KCNQ1 imprinted domain. BMC Evolut Biol. 2008;8:1–14. doi: 10.1186/1471-2148-8-163. - DOI - PMC - PubMed
    1. Ager E, Suzuki S, Pask A, Shaw G, Ishino F, Renfree MB. Insulin is imprinted in the placenta of the marsupial, Macropus eugenii. Develop Biol. 2007;309:317–328. doi: 10.1016/j.ydbio.2007.07.025. - DOI - PubMed
    1. Autuoro JM, Pirnie SP, Carmichael GG. Long noncoding RNAs in imprinting and X chromosome inactivation. Biomol. 2014;4:76–100. - PMC - PubMed
    1. Barlow DP, Bartolomei MS. Genomic imprinting in mammals. Cold Spring Harb Perspect Biol. 2014;6:a018382–a018382. doi: 10.1101/cshperspect.a018382. - DOI - PMC - PubMed
    1. Bartolomei MS, Ferguson-Smith AC. Mammalian genomic imprinting. Cold Spring Harb Perspect Biol. 2011;3:a002592. doi: 10.1101/cshperspect.a002592. - DOI - PMC - PubMed

Publication types