. 2024 Aug;4(8):1043-1052.
doi: 10.1038/s43587-024-00647-7. Epub 2024 Jun 4.

Epigenetic and proteomic signatures associate with clonal hematopoiesis expansion rate

Affiliations

Epigenetic and proteomic signatures associate with clonal hematopoiesis expansion rate

Taralynn M Mack et al. Nat Aging. 2024 Aug.

Abstract

Clonal hematopoiesis of indeterminate potential (CHIP), whereby somatic mutations in hematopoietic stem cells confer a selective advantage and drive clonal expansion, not only correlates with age but also confers increased risk of morbidity and mortality. Here, we leverage genetically predicted traits to identify factors that determine CHIP clonal expansion rate. We used the passenger-approximated clonal expansion rate method to quantify the clonal expansion rate for 4,370 individuals in the National Heart, Lung, and Blood Institute (NHLBI) Trans-Omics for Precision Medicine (TOPMed) cohort and calculated polygenic risk scores for DNA methylation aging, inflammation-related measures and circulating protein levels. Clonal expansion rate was significantly associated with both genetically predicted and measured epigenetic clocks. No associations were identified with inflammation-related lab values or diseases and CHIP expansion rate overall. A proteome-wide search identified predicted circulating levels of myeloid zinc finger 1 and anti-Müllerian hormone as associated with an increased CHIP clonal expansion rate and tissue inhibitor of metalloproteinase 1 and glycine N-methyltransferase as associated with decreased CHIP clonal expansion rate. Together, our findings identify epigenetic and proteomic patterns associated with the rate of hematopoietic clonal expansion.


Conflict of interest statement

S.J. is on advisory boards for Novartis, AVRO Bio, and Roche Genentech, reports speaking fees and a honorarium from GSK, and is on the scientific advisory board of Bitterroot Bio. P.N. reports grants support from Amgen, AstraZeneca, Apple, Novartis and Boston Scientific, is a paid consultant for Apple, AstraZeneca, Novartis, Genentech, Blackstone Life Sciences and spousal employment at Vertex, all unrelated to the present work. S.J., A.G.B. and P.N. are paid consultants for Foresite Labs and co-founders, equity holders, and on the scientific advisory board of TenSixteen Bio. Stanford University has filed a patent application for the use of PACER to identify therapeutic targets on which S.J., A.G.B. and J.S.W. are inventors (US patent 63/141,333). The patent has been licensed to TenSixteen Bio. A.S. is an employee of Regeneron Pharmaceuticals. B.M.P. serves on the Steering Committee of the Yale Open Data Access Project funded by Johnson & Johnson. E.S. receives grant support from Bayer and GSK. J.Y. & D.D. receive grant support from Bayer. M.C. receives grant support from Bayer and GSK, and consulting and speaking fees from Illumina and AstraZeneca. S.S.R. & L.M.R. are paid consultants for Westat, the Administrative Coordinating Center for the NHLBI Trans-Omics for Precision Medicine (TOPMed) program. The remaining authors declare no competing interests.

Figures

Extended Data Fig. 1:
Extended Data Fig. 1:. Description of CHIP cohort characteristics.
A density plot displaying the distribution of driver gene VAF across the cohort stratified by driver gene as well as the overall driver gene count across the cohort.
Extended Data Fig. 2:
Extended Data Fig. 2:. Epigenetic aging correlation measures.
Correlation in methylation measures. (a) Correlation matrix within measured epigenetic aging data. (b) Correlation matrix within predicted epigenetic aging data. (c) Box plot showing correlation between calculated PRS (n = 297 individuals) (grouped into quartiles) and z-scored measured methylation data. Color denotes a significant association between measured and PRS data. The center line is the median value, with the bounds of the box representing the first through third quartiles and the whiskers representing the minimum and maximum while any remaining points are outliers.
Extended Data Fig. 3:
Extended Data Fig. 3:. Full regression results for inflammation analyses.
Linear regressions of clonal expansion rate with inflammation (full results). (a) Heat map showing associations between clonal expansion rate and PRS for inflammation-related proteins from the Somalogic database stratified by CHIP gene. Significance and direction of effect are denoted by the color of the box. (b) Heat map showing associations between clonal growth and PRS for inflammation-related phenotypes. Significance and direction of effect are denoted by the color of the box.
Extended Data Fig. 4:
Extended Data Fig. 4:. Gene-specific circulating protein regression results.
Linear regressions of clonal expansion rate with predicted protein levels in CHIP gene-specific analyses. Volcano plots showing significantly associated protein PRS from the Somalogic database. Colored points are statistically significant. The color of the point shows the direction of the effect (blue = negative, red = positive). To account for multiple testing, we used a Bonferroni corrected p-value of 2.3 × 10⁻⁵. (a) DNMT3A-specific CHIP (b) TET2-specific CHIP (c) SRSF2/SF3B1/U2AF1-specific CHIP.
Extended Data Fig. 5:
Extended Data Fig. 5:. Sex-stratified circulating protein regression results.
Linear regression analyses of clonal expansion rate with Somalogic protein PRS stratified by biological sex (n = 4,370 individuals). To account for multiple testing, we used a Bonferroni corrected p-value of 0.01.
Extended Data Fig. 6:
Extended Data Fig. 6:. Full results of GSEA analyses.
Hallmark pathways in Gene Set Enrichment Analysis (GSEA). (a) Heat map showing the pathways most implicated in both overall CHIP and gene-specific CHIP. Color denotes the direction of the association. GSEA is a statistical functional enrichment analysis. (b) Protein PRSs contributing to the hallmark pathways most strongly associated with clonal expansion rate. Color denotes the direction of the association.
Extended Data Fig. 7:
Extended Data Fig. 7:. Gene-specific GSEA results.
Gene Set Enrichment Analysis (GSEA) results for CHIP gene-specific analyses. (a) Pathways implicated in the associations between clonal expansion rate and circulating protein PRS in DNMT3A-specific CHIP. (b) TET2-specific CHIP. (c) Pearson’s correlation test between pathways implicated in DNMT3A & TET2-specific CHIP. The translucent error bars around the linear regression line represent 95% confidence intervals.
Fig. 1:
Fig. 1:. A schematic representation of the study design.
PRSs were calculated for traits of interest for individuals in the TOPMed cohort with CHIP mutations using PRScsx, PRScs or PLINK. These scores were then regressed with clonal growth rate (estimated using PACER) to determine whether traits were associated with CHIP progression. Created with BioRender.com. AFR, African; ASN, Asian; EUR, European; HIS, Hispanic.
Fig. 2:
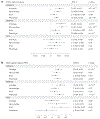
Fig. 2:. Linear regression analyses of clonal expansion rate with DNA methylation aging measures.
a, Associations between clonal expansion rate and measured methylation aging data stratified by CHIP gene mutation (n = 297 individuals). DNAm, DNA methylation. To account for multiple testing, we used a Bonferroni-corrected P value of 0.01. The center value represents the β value and the line shows the 95% confidence intervals (CI). b, Associations between clonal expansion rate and methylation aging data PRSs stratified by CHIP gene mutation (n = 4,370 individuals). To account for multiple testing, we used a Bonferroni-corrected P value of 0.01. The center value represents the β value and the line shows the 95% CI.
Fig. 3:
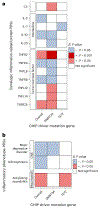
Fig. 3:. Linear regressions of clonal expansion rate with inflammation.
Only P values > 0.05 are shown, full results are reported in Extended Data Fig. 3 and Supplementary Tables 4 & 5. a, Heat map showing associations between clonal expansion rate and PRSs for inflammation-related proteins from the Somalogic database stratified by CHIP gene. IL, interleukin. The significance and direction of effect are denoted by the color of the box. To account for multiple testing, a P value of 0.001 was used. b, Heat map showing associations between clonal growth and PRSs for inflammation-related phenotypes. CNS, central nervous system. The significance and direction of effect are denoted by the color of the box. To account for multiple testing, a P value of 0.002 was used.
Fig. 4:
Fig. 4:. Linear regressions of clonal expansion rate with predicted protein levels.
a, Volcano plot showing significantly associated protein PRSs from the Somalogic database (n = 2,214 proteins). Colored points are statistically significant. The color of the point shows the direction of the effect (blue = negative, red = positive). To account for multiple testing, we used a Bonferroni-corrected P value of 2.3 × 10⁻⁵. b, Forest plot showing the CHIP gene mutation-specific correlations for the significant hits (n = 4,370 individuals). To account for multiple testing, we used a Bonferroni-corrected P value of 2.3 × 10⁻⁵. The center value represents the β value and the line shows the 95% CI. c, GSEA results showing the pathways implicated in the associations between clonal expansion rate and circulating protein PRSs.

References

    1. Heuser M, Thol F & Ganser A Clonal Hematopoiesis of Indeterminate Potential. Dtsch. Ärztebl. Int 113, 317–322 (2016). - PMC - PubMed
    1. Argüelles OC et al. Clonal hematopoiesis associated mutations, cardiovascular events, and all-cause death among patients with acute myeloid leukemia. J. Am. Coll. Cardiol 75, 671–671 (2020).
    1. Miller PG et al. Association of clonal hematopoiesis with chronic obstructive pulmonary disease. Blood 139, 357 (2022). - PMC - PubMed
    1. Genovese G et al. Clonal hematopoiesis and blood-cancer risk inferred from blood DNA sequence. N. Engl. J. Med 371, 2477–2487 (2014). - PMC - PubMed
    1. Jaiswal S et al. Age-Related Clonal Hematopoiesis Associated with Adverse Outcomes. N. Engl. J. Med 371, 2488–2498 (2014). - PMC - PubMed

Substances

LinkOut - more resources