. 2024 Jul;4(7):969-983.
doi: 10.1038/s43587-024-00645-9. Epub 2024 Jun 4.

Cell type mapping of inflammatory muscle diseases highlights selective myofiber vulnerability in inclusion body myositis

Affiliations

Cell type mapping of inflammatory muscle diseases highlights selective myofiber vulnerability in inclusion body myositis

Sven Wischnewski et al. Nat Aging. 2024 Jul.

Abstract

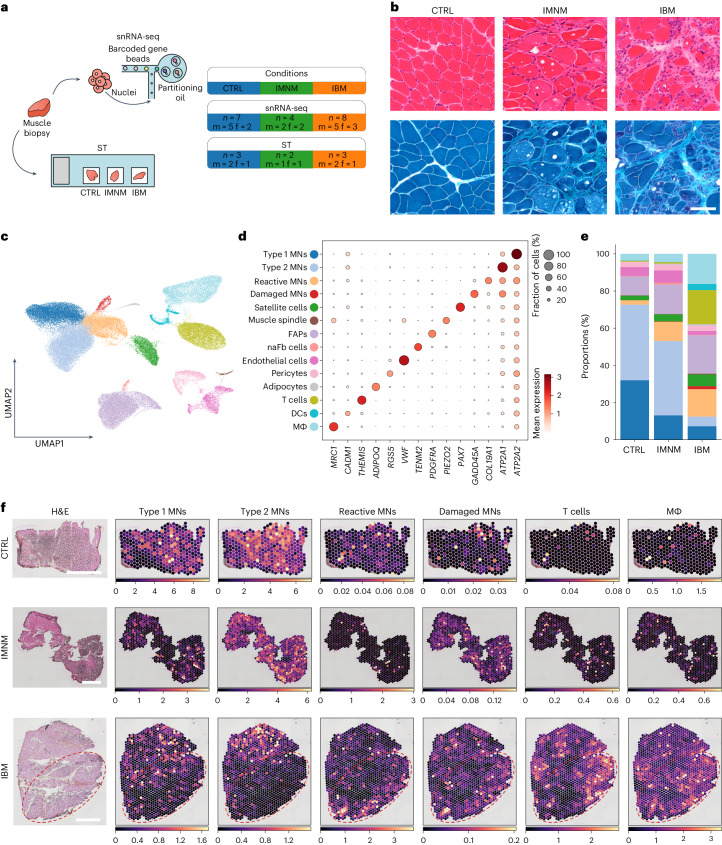
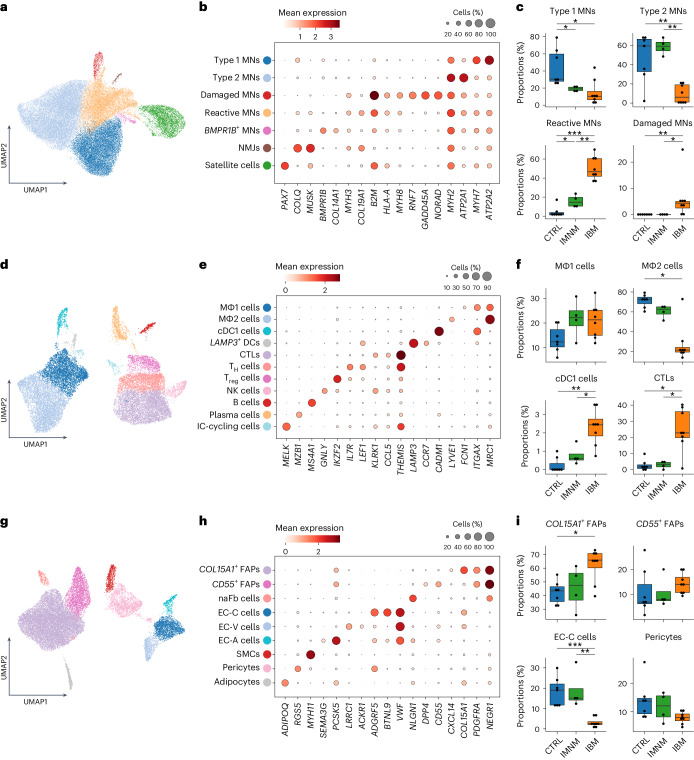
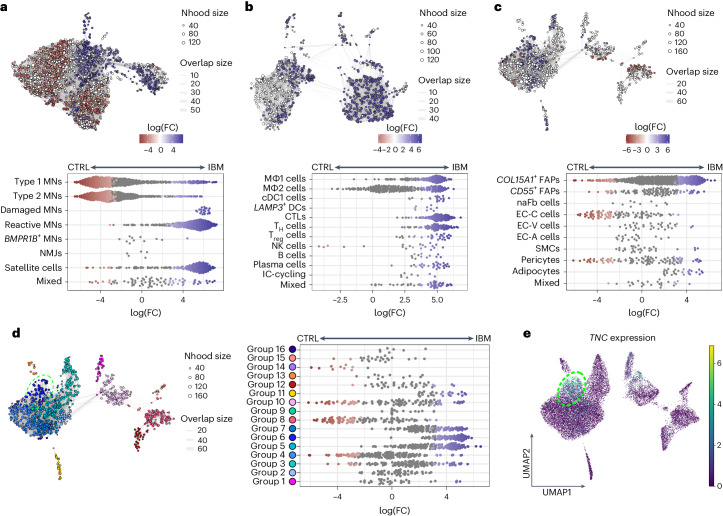
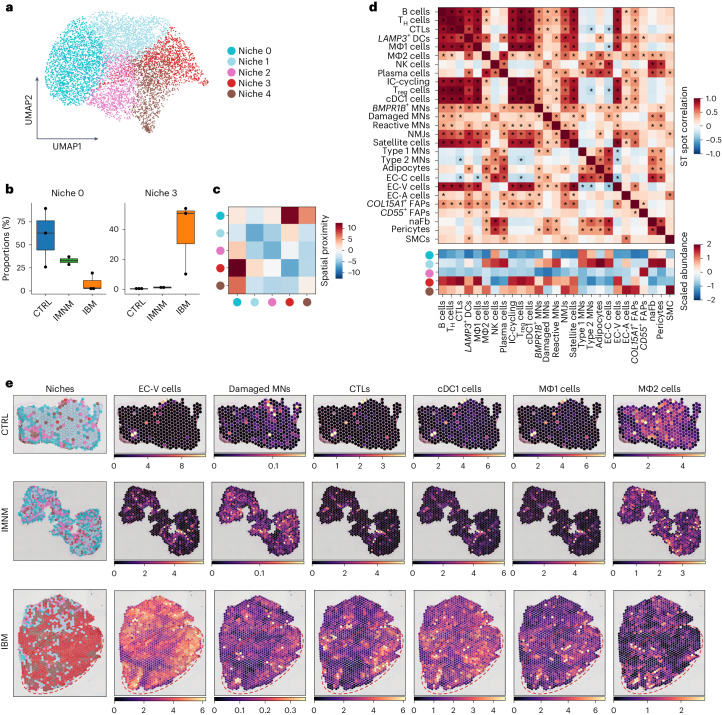
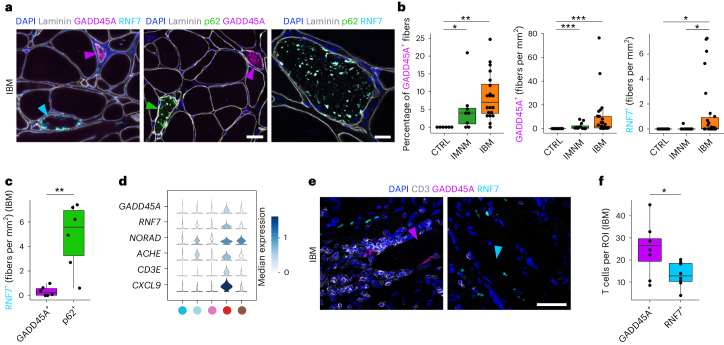
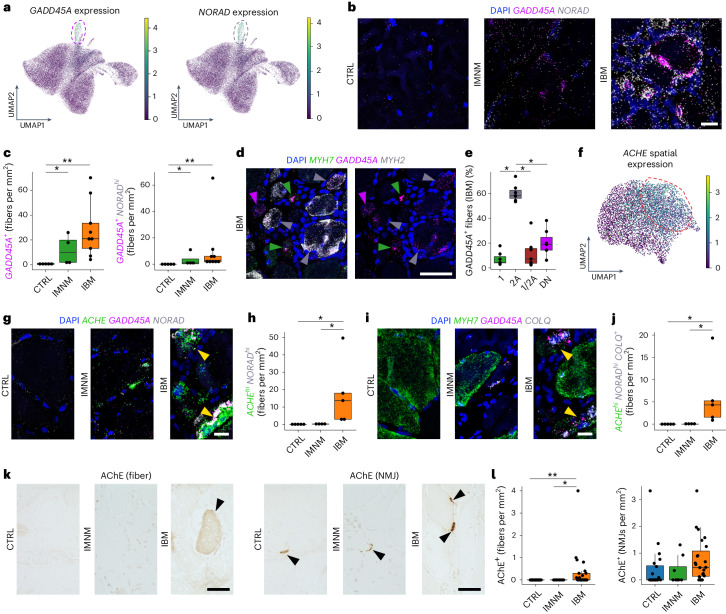
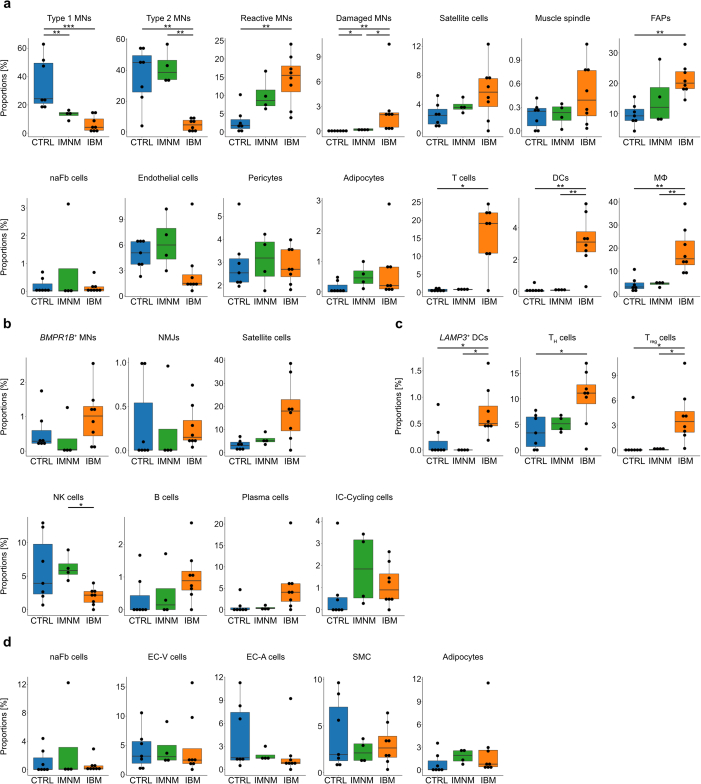
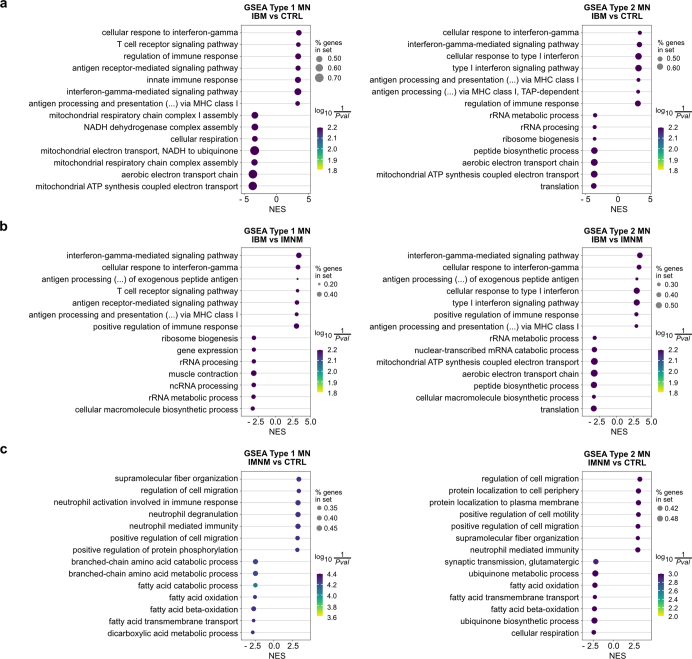
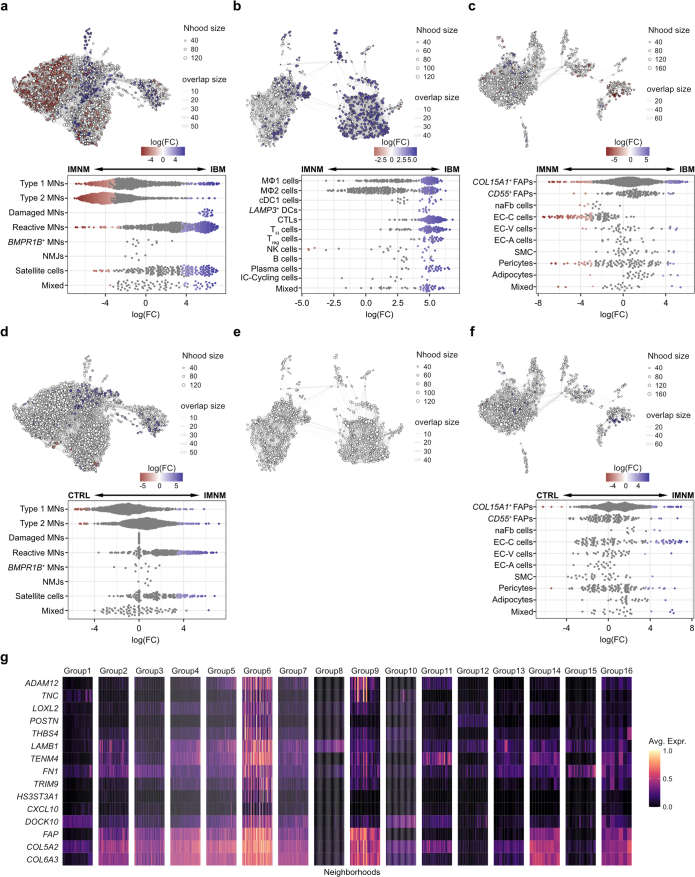
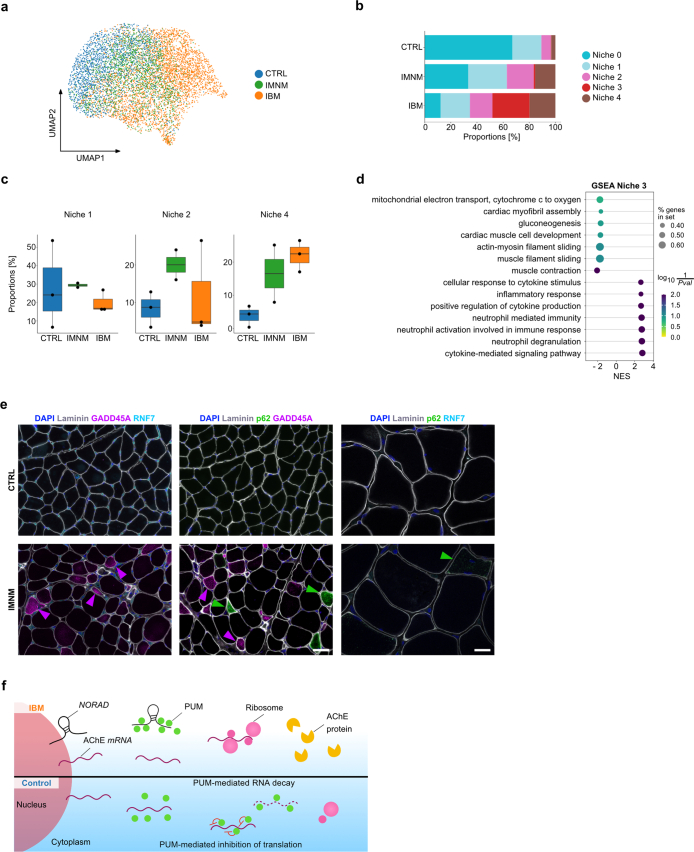
Inclusion body myositis (IBM) is the most prevalent inflammatory muscle disease in older adults with no effective therapy available. In contrast to other inflammatory myopathies such as subacute, immune-mediated necrotizing myopathy (IMNM), IBM follows a chronic disease course with both inflammatory and degenerative features of pathology. Moreover, causal factors and molecular drivers of IBM progression are largely unknown. Therefore, we paired single-nucleus RNA sequencing with spatial transcriptomics from patient muscle biopsies to map cell-type-specific drivers underlying IBM pathogenesis compared with IMNM muscles and noninflammatory skeletal muscle samples. In IBM muscles, we observed a selective loss of type 2 myonuclei paralleled by increased levels of cytotoxic T and conventional type 1 dendritic cells. IBM myofibers were characterized by either upregulation of cell stress markers featuring GADD45A and NORAD or protein degradation markers including RNF7 associated with p62 aggregates. GADD45A upregulation was preferentially seen in type 2A myofibers associated with severe tissue inflammation. We also noted IBM-specific upregulation of ACHE encoding acetylcholinesterase, which can be regulated by NORAD activity and result in functional denervation of myofibers. Our results provide promising insights into possible mechanisms of myofiber degeneration in IBM and suggest a selective type 2 fiber vulnerability linked to genomic stress and denervation pathways.


Conflict of interest statement

The authors declare no competing interests.

Figures

Fig. 1
Fig. 1. Overview of histology, snRNA-seq and ST.
a, Sketch showing experimental design and information on the different groups of patients. b, Histology (H&E and Gömöri’s trichrome) showing representative images of CTRL, IMNM and IBM muscle. Scale bar, 100 µm. c, UMAP visualization of all cells/nuclei present in the snRNA-seq dataset from all conditions (CTRL, n = 7; IMNM, n = 4; IBM, n = 8; nuclei, n = 93,345). d, Dot plot showing marker genes of identified clusters. e, Compositional analysis of snRNA-seq data of CTRL, IMNM and IBM muscle (CTRL, n = 7; IMNM, n = 4; IBM, n = 8). Note, there are substantially increased immune cell populations and a decreased type 2 MN population in IBM. f, Representative images of deconvolution of ST data (CTRLs, n = 3; IMNM, n = 2; IBM, n = 3) showing locations of cell types identified in snRNA-seq of CTRL, IMNM and IBM muscle. Note, red contours highlight areas with low abundance of type II MNs and high abundance of immune cells based on gene expression in IBM. Scale bars, 1 mm. f, female; m, male.
Fig. 2
Fig. 2. Subclustering of MNs, immune, endothelial and stromal cells.
a, UMAP visualization showing all MNs (n = 49,633) present in the snRNA-seq dataset from all conditions. b, Dot plot showing marker genes of MN clusters. c, Compositional analysis of type 1 MNs (P(CTRL-IBM) = 2.1 × 10−2; P(CTRL-IMNM) = 1.8 × 10−2), type 2 MNs (P(CTRL-IBM) = 6.1 × 10−3; P(IMNM-IBM) = 6.1 × 10−3), reactive MNs (P(CTRL-IBM) = 9.3 × 10−4; P(CTRL-IMNM) = 2.4 × 10−2; P(IMNM-IBM) = 6.1 × 10−3) and damaged MNs (P(CTRL-IBM) = 5.2 × 10−3; P(IMNM-IBM) = 1.7 × 10−2) in CTRL, IMNM and IBM (CTRL, n = 7; IMNM, n = 4; IBM, n = 8). d, UMAP visualization showing all immune cells (n = 20,620) present in the snRNA-seq dataset from all conditions. e, Dot plot showing marker genes of immune cell clusters. f, Compositional analysis of MΦ1 cells (P(CTRL-IBM) = 1.0 × 10−1, P(CTRL-IMNM) = 1.4 × 10−1), MΦ2 cells (P(CTRL-IBM) = 1.1 × 10−2), cDC1 cells (P(CTRL-IBM) = 5.4 × 10−3; P(IMNM-IBM) = 2.4 × 10−2) and CTLs (P(CTRL-IBM) = 2.7 × 10−2; P(IMNM-IBM) = 4.2 × 10−2) in CTRLs, IMNM and IBM (CTRLs, n = 7; IMNM, n = 4; IBM, n = 8). g, UMAP visualization showing all endothelial–stromal cells (n = 22,781) present in the snRNA-seq dataset from all conditions. h, Dot plot showing marker genes of identified endothelial–stromal cells. i, Compositional analysis of COL15A1-expressing FAPs (P(CTRL-IBM) = 2.8 × 10−2), CD55-expressing FAPs, EC-C cells (P(CTRL-IBM) = 9.3 × 10−4; P(IMNM-IBM) = 6.1 × 10−3) and pericytes in CTRL, IMNM and IBM (CTRL, n = 7; IMNM, n = 4; IBM, n = 8). Box plots in c, f and i show the median and interquartile range (IQR) of cell/nuclei-type proportions, with whiskers extending to the largest and smallest values within 1.5× the IQR range. Two-tailed, pairwise Wilcoxon’s rank-sum tests with Benjamini–Hochberg correction to account for multiple comparisons or Tukey’s HSD test were performed between conditions in c, f and i. *P < 0.05, **P < 0.01, ***P < 0.001.
Fig. 3
Fig. 3. Differential abundance analysis between CTRLs and IBM.
a, Top, neighborhood graph visualizing the results of differential abundance analysis between CTRL and IBM MNs. Bottom, beeswarm plot showing the log(fold change) (log(FC)) of abundance in neighborhoods between CTRL and IBM MNs. b, Top, neighborhood graph visualizing the results of differential abundance analysis between CTRLs and IBM in immune cells. Bottom, beeswarm plot showing the log(FC) of abundance in neighborhoods between CTRLs and IBM in immune cells. c, Top, neighborhood graph visualizing the results of differential abundance analysis between CTRLs and IBM in endothelial–stromal cells. Bottom, beeswarm plot showing the log(FC) of abundance in neighborhoods between CTRLs and IBM in endothelial–stromal cells. d, Left, neighborhood plot showing the grouping of neighborhoods as shown in c based on the number of shared cells and direction of fold-changes of abundance between CTRLs and IBM in endothelial–stromal cells. Right, beeswarm plot showing log(FC) of abundances of neighborhoods within neighborhood groups in endothelial–stromal cells. e, UMAP visualization showing TNC expression within endothelial–stromal cell subpopulations in CTRL, IMNM and IBM muscle. Note, contours in d and e highlight neighborhoods/cells of group 6. For neighborhood graphs in ad: every node represents a neighborhood, colored by log(FC) between CTRLs (red) and IBM (blue). Neighborhoods with no detected differential abundance (corrected spatial FDR > 0.1) are colored white (ac). The node size correlates with the number of nuclei within a neighborhood (Nhood size) and the graph edge width indicates the number of overlapping cells between adjacent neighborhoods (overlap size). The position of nodes is based on the position of the nuclei shown in the UMAP visualizations in Fig. 2a,d,g. For beeswarm plots in ad: every dot represents a neighborhood, colored by log(FC) between CTRLs (red) and IBM (blue). Neighborhoods with no detected differential abundance (corrected spatial FDR > 0.1) are colored gray. Note, ‘mixed’ indicates that <70% of nuclei within a neighborhood originate from one single cluster.
Fig. 4
Fig. 4. ST reveals IBM-specific inflammatory tissue niche.
a, UMAP visualization showing tissue niches of CTRL, IMNM and IBM muscle (spots, n = 7,462). b, Compositional analysis of tissue niches in CTRLs, IMNM and IBM (CTRLs, n = 3; IMNM, n = 2; IBM, n = 3) showing reduced proportions of myofiber-associated niche 0 in IBM compared with CTRLs and increased proportions of immune cell-associated niche 3 in IBM compared with CTRLs. Box plots show median and IQR of tissue niche proportions, with whiskers extending to the largest and smallest values within the 1.5× IQR. c, Heatmap showing spatial proximity of tissue niches. d, Heatmaps showing the correlation of spatial locations of cell types identified by snRNA-seq (upper heatmap) and scaled abundance of these cell types within tissue niches. |r|: *P > 0.25. e, Tissue niches shown on tissue sections of CTRL, IMNM and IBM muscle in the left column. The right columns show locations of selected cell types identified in snRNA-seq based on deconvolution of ST data (CTRL, n = 3; IMNM, n = 2; IBM, n = 3). Note, the red contours highlight areas with a low abundance of type II MNs in IBM (Fig. 1f).
Fig. 5
Fig. 5. GADD45A-associated myofiber infiltration of T cells in IBM.
a, IHC for laminin, p62, GADD45A and RNF7 in IBM. Note the protein aggregates containing p62 and RNF7 in a myofiber in the right image, and purple arrowheads pointing at GADD45A+ myofibers, a cyan arrowhead at a RNF7+ myofiber and a green arrowhead at a p62+ myofiber. Scale bar, 50 μm (left and middle image), 20 μm (right image). b, Box plots showing quantification of GADD45A+ myofibers and RNF7+ myofibers in CTRLs, IMNM and IBM (left plot: CTRLs, n = 6; IMNM, n = 8; IBM, n = 20, P(CTRL-IBM) = 1.5 × 10−3, P(CTRL-IMNM) = 1.9 × 10−2; middle plot: CTRLs, n = 12; IMNM, n = 12; IBM, n = 28, p(CTRL-IBM) = 3.7 × 10−6, P(CTRL-IMNM) = 1.9 × 10−4; right plot: CTRLs, n = 11; IMNM, n = 12; IBM, n = 26, P(CTRL-IBM) = 1.7 × 10−2, P(IMNM-IBM) = 2.3 × 10−2). c, Box plot showing quantification of RNF7+ myofibers coexpressing GADD45A or p62 in IBM (n = 6, P = 9.1 × 10−3). d, Stacked violin plots showing expression of the damaged MN markers GADD45A, RNF7 and NORAD and ACHE and inflammation markers CD3E and CXCL9 within tissue niches. e, IHC for GADD45A+ and RNF7+ myofibers to CD3+ T cells in IBM muscle with T cells invading a GADD45A+ myofiber. A purple arrowhead points at a GADD45A+ myofiber and a cyan arrowhead at a RNF7+ myofiber. Scale bar, 50 μm. f, Box plot showing the amount of CD3+ T cells around GADD45A+ or RNF7+ myofibers per region of interest (ROI) per IBM sample (n = 8, P = 2.2 × 10−2). Box plots in b, c and f show the median and IQR, with whiskers extending to the largest and smallest values within the 1.5× IQR range. Two-tailed, pairwise Wilcoxon’s rank-sum tests with Benjamini–Hochberg correction to account for multiple comparisons were performed between conditions in b. Two-tailed, paired Student’s t-tests were performed between groups in c and f. *P < 0.05, **P < 0.01, ***P < 0.001.
Fig. 6
Fig. 6. Elevated ACHE expression in IBM is associated with lncRNA NORAD upregulation.
a, UMAP visualization showing GADD45A and NORAD expression within MNs in CTRLs, IMNM and IBM. b, SmFISH for GADD45A and NORAD in CTRLs, IMNM and IBM. c, Quantification of GADD45A+ (P(CTRL-IBM) = 3.0 × 10−3, P(CTRL-IMNM) = 2.4 × 10−2) and GADD45A+ NORADhi myofibers (P(CTRL-IBM) = 9.0 × 10−3, P(CTRL-IMNM) = 2.3 × 10−2) based on smFISH in CTRLs (n = 5), IMNM (n = 4) and IBM (n = 9). d, SmFISH for GADD45A and MYH7 (type 1) and MYH2 (type 2 A) in IBM. The arrowheads indicate GADD45A+ type 1 (green), GADD45A+ type 2A (gray) and MYH7MYH2GADD45A+ (purple) myofibers. e, Proportions of GADD45A expression in different myofiber types in IBM (n = 7) (P(2A-1) = 3.1 × 10−2, P(2A-1/2 A) = 3.1 × 10−2, P(2A-DN) = 3.1 × 10−2). f, UMAP visualization showing spatial ACHE expression in CTRLs, IMNM and IBM. g, SmFISH showing expression of GADD45A, NORAD and ACHE in CTRLs, IMNM and IBM. The yellow arrowheads point at ACHEhiNORADhi myofibers. h, Quantification of ACHEhiNORADhi myofibers in CTRLs (n = 5), IMNM (n = 4) and IBM (n = 5) (P(CTRL-IBM) = 2.4 × 10−2, P(IMNM-IBM) = 2.4 × 10−2). i, SmFISH for GADD45A, MYH7 and COLQ in CTRLs, IMNM and IBMs. The yellow arrowheads indicate COLQ+ myofibers, coexpressing ACHE and NORAD (see g). j, ACHEhiNORADhiCOLQ+ myofiber quantification in CTRLs (n = 5), IMNM (n = 4) and IBM muscles (n = 5) (P(CTRL-IBM) = 2.2 × 10−2, P(IMNM-IBM) = 2.7 × 10−2). k, IHC for AChE+ myofibers and NMJs in IBMs. The black arrowheads point at AChE+ myofibers (left) and NMJs (right), respectively. Scale bar, 50 μm. l, Quantification of AChE+ myofibers and NMJs in CTRLs (n = 20), IMNM (n = 8) and IBM (n = 23) (left: P(CTRL-IBM) = 2.1 × 10−3, P(IMNM-IBM) = 3.2 × 10−2; right: P(CTRL-IBM) = 7.6 × 10−2). Contours in a and f highlight areas with high expression of displayed genes. Box plots in c, e, h, j and l show the median and IQR, with whiskers extending to the largest and smallest values within 1.5× the IQR. Here, two-tailed, pairwise Wilcoxon’s rank-sum (c, h, j and l) or signed-rank (e) tests with Benjamini–Hochberg correction to account for multiple comparisons were performed. *P < 0.05, **P < 0.01. Scale bars, 20 µm (b, g and i), 50 µm (d and k).
Extended Data Fig. 1
Extended Data Fig. 1. Quality control metrics in snRNA-seq analysis.
Scatter plots showing quality control (QC) metrics nFeature_RNA, nCount_RNA, and percentages of mitochondrial encoded genes (%mt), after quality control of every sample included in our snRNA-seq analysis.
Extended Data Fig. 2
Extended Data Fig. 2. Quality control metrics in ST analysis.
a Left column showing H&E histology of the tissue section used for ST. Right column showing the distribution of tissue niches on all sequenced sections. Scale bars = 1 mm. b Scatter plots showing QC metrics nGenes_by_Counts, Total_Counts, and percentages of mitochondrial encoded genes (%mt) for included spatial transcriptomic samples.
Extended Data Fig. 3
Extended Data Fig. 3. Additional compositional analysis of snRNA-seq clusters.
a Box plots showing compositional analysis of all identified cell-types within our dataset shown in Fig. 1c-e. Type 1 MN: p(CTRL-IBM) = 9.3 × 10−4, p(CTRL-IMNM) = 9.1 × 10−3; Type 2 MN: p(CTRL-IBM) = 6.1 × 10−3, p(IMNM-IBM) = 6.1 × 10−3; Reactive MN: p(CTRL-IBM) = 6.5 × 10−3; Damaged MN: p(CTRL-IBM) = 2.4 × 10−3, p(CTRL-IMNM) = 1.6 × 10−2, p(IMNM-IBM) = 1.6 × 10−2; FAPs: p(CTRL-IBM) = 3.7 × 10−3; T cells: p(CTRL-IBM) = 1.1 × 10−2; DC: p(CTRL-IBM) = 5.9 × 10−3, p(IMNM-IBM) = 6.1 × 10−3; MΦ: p(CTRL-IBM) = 3.7 × 10−3, p(IMNM-IBM) = 6.1 × 10−3. b Additional box plots showing compositional analysis of myonuclei in CTRL, IMNM, and IBM. Satellite cells: p(CTRL-IBM) = 6.2 × 10−2. c Additional box plots showing compositional analysis of immune cells in CTRL, IMNM, and IBM. LAMP3+ DC: p(CTRL-IBM) = 2.4 × 10−2, p(IMNM-IBM) = 2.2 × 10−2; TH cells: p(CTRL-IBM) = 1.8 × 10−2; Treg cells: p(CTRL-IBM) = 2.1 × 10−2, p(IMNM-IBM) = 2.1 × 10−2; NK cells: p(IMNM-IBM) = 1.2 × 10−2; Plasma cells: p(CTRL-IBM) = 9.2 × 10−2, p(IMNM-IBM) = 9.2 × 10−2. d Additional box plots showing compositional analysis of endothelial-stromal cells in CTRL, IMNM, and IBM. a-d (CTRL, n = 7; IMNM, n = 4; IBM, n = 8); Box plots show median and interquartile range (IQR) of cell/nuclei type proportions, with whiskers extending to the largest and smallest values within 1.5 × IQR range. Two-tailed pairwise Wilcoxon rank-sum tests with Benjamini-Hochberg correction to account for multiple comparisons or Tukey’s HSD tests were performed here between conditions.
Extended Data Fig. 4
Extended Data Fig. 4. Gene set enrichment analysis (GSEA) of Type 1 and 2 MN between CTRL and IIM samples.
a Dot plots showing the top 7 enriched gene sets based on the normalized enrichment score (NES) in Type 1 and 2 MN comparing IBM with CTRL muscle. b Dot plots showing the top 7 enriched gene sets based on the NES in Type 1 and 2 MN comparing IBM with IMNM muscle. c Dot plots showing the top 7 enriched gene sets based on the NES in Type 1 and 2 MN comparing IMNM with CTRL muscle. % genes in set indicates the proportion of enriched genes within a gene set. The ‘signal_to_noise’ - method was used as statitistical test for data analysis.
Extended Data Fig. 5
Extended Data Fig. 5. Differential abundance analysis between IMNM versus IBM and CTRL versus IMNM.
a Top: Neighborhood graph visualizing results of differential abundance analysis (DAA) between IMNM and IBM in myonuclei. Bottom: Beeswarm plot showing log(fold-changes) (log(FC)) of abundances in neighborhoods between IMNM and IBM in myonuclei. b Top: Neighborhood graph visualizing results of DAA between IMNM and IBM in immune cells. Bottom: Beeswarm plot showing log(FC) of abundances in neighborhoods between IMNM and IBM in immune cells. c Top: Neighborhood graph visualizing results of DAA between IMNM and IBM in endothelial-stromal cells. Bottom: Beeswarm plot showing log(FC) of abundances in neighborhoods between IMNM and IBM in endothelial-stromal cells. d Top: Neighborhood graph visualizing results of DAA between CTRL and IMNM in myonuclei. Bottom: Beeswarm plot showing log(FC) of abundances in neighborhoods between CTRL and IMNM in myonuclei. e Neighborhood graph visualizing results of DAA between CTRL and IMNM in immune cells. f Top: Neighborhood graph visualizing results of DAA between CTRL and IMNM in endothelial-stromal cells. Bottom: Beeswarm plot showing log(FC) of abundances in neighborhoods between CTRL and IMNM in endothelial-stromal cells. g Heatmap visualizing average expression of selected marker genes of Group6. For neighborhood graphs in a - f: Nodes represent neighborhoods, colored by log(FC) between IMNM (red) and IBM (blue) (ac) or CTRL (red) and IMNM (blue) (d - f). Neighborhoods with no detected differential abundance (corrected spatialFDR > 0.1) are colored white (a - f). Node size correlates to the numbers of nuclei within a neighborhood (Nhood size) and graph edge width indicates the number of overlapping cells between adjacent neighborhoods (overlap size). Node positions are based on positions of nuclei as shown in Fig. 2a, d, g. For beeswarm plots in a – d, and f: Every dot represents a neighborhood, colored by log(FC) between IMNM (red) and IBM (blue) (ac) or CTRL (red) and IMNM (blue) (d and f). Neighborhoods with no detected differential abundance (corrected spatialFDR > 0.1) are colored grey. ‘Mixed’ indicates < 70% of nuclei within a neighborhood originate from one cluster.
Extended Data Fig. 6
Extended Data Fig. 6. Additional analysis of ST and IHC results between CTRL and IIM samples.
a UMAP visualization showing ST spots colored by condition. b Bar plot showing compositional analysis of tissue niches in CTRL, IMNM and IBM muscle. c Box plots showing compositional analysis of tissue niches in CTRL (n = 3), IMNM (n = 2), and IBM (n = 3). Box plots show median and interquartile range (IQR) of tissue niche proportions, with whiskers extending to the largest and smallest values within 1.5 x IQR range. d Dot plot showing the top 7 up- and downregulated gene sets based on the NES in Niche 3 compared to all the other niches. % genes in set indicates the proportion of enriched genes within a gene set. The ‘signal_to_noise’ - method was used as statitistical test for data analysis. e Immunohistochemistry (IHC) showing expression of Laminin, p62, GADD45A, and RNF7 in CTRL and IMNM muscle on the protein level. Note purple arrowheads pointing at GADD45A+ myofibers, and green arrowheads pointing at p62+ myofibers. Scale bar (left and middle image) = 50 μm, scale bar (right image) = 20 μm. f Sketch showing links between genomic stress and functional denervation in IBM.

References

    1. Greenberg SA. Inclusion body myositis: clinical features and pathogenesis. Nat. Rev. Rheumatol. 2019;15:257–272. doi: 10.1038/s41584-019-0186-x. - DOI - PubMed
    1. Allenbach Y, Benveniste O, Stenzel W, Boyer O. Immune-mediated necrotizing myopathy: clinical features and pathogenesis. Nat. Rev. Rheumatol. 2020;16:689–701. doi: 10.1038/s41584-020-00515-9. - DOI - PubMed
    1. Woo S-H, et al. Piezo2 is the principal mechanotransduction channel for proprioception. Nat. Neurosci. 2015;18:1756–1762. doi: 10.1038/nn.4162. - DOI - PMC - PubMed
    1. Wang H, et al. Comparative transcriptomic profiling of peripheral efferent and afferent nerve fibres at different developmental stages in mice. Sci. Rep. 2018;8:11990. doi: 10.1038/s41598-018-30463-0. - DOI - PMC - PubMed
    1. Silva J-P, et al. Latrophilin 1 and its endogenous ligand Lasso/teneurin-2 form a high-affinity transsynaptic receptor pair with signaling capabilities. Proc. Natl Acad. Sci. USA. 2011;108:12113–12118. doi: 10.1073/pnas.1019434108. - DOI - PMC - PubMed

MeSH terms

LinkOut - more resources