

Constructing a prognostic model for colorectal cancer with synchronous liver metastases after preoperative chemotherapy: a study based on SEER and an external validation cohort
- PMID: 38834909
- PMCID: PMC11564222
- DOI: 10.1007/s12094-024-03513-5
Constructing a prognostic model for colorectal cancer with synchronous liver metastases after preoperative chemotherapy: a study based on SEER and an external validation cohort
Abstract
Background: The combination of preoperative chemotherapy and surgical treatment has been shown to significantly enhance the prognosis of colorectal cancer with liver metastases (CRLM) patients. Nevertheless, as a result of variations in clinicopathological parameters, the prognosis of this particular group of patients differs considerably. This study aimed to develop and evaluate Cox proportional risk regression model and competing risk regression model using two patient cohorts. The goal was to provide a more precise and personalized prognostic evaluation system.
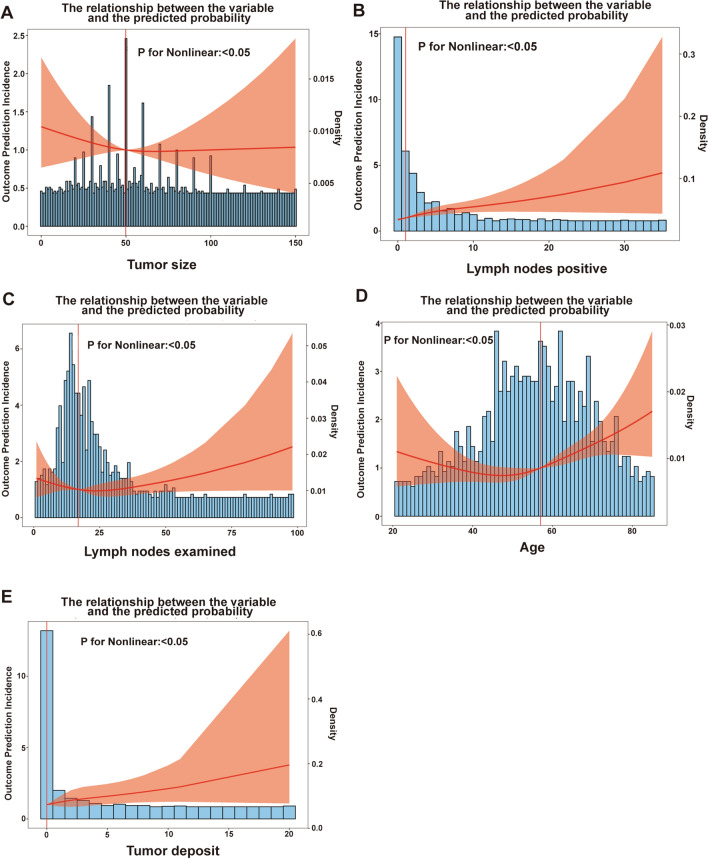
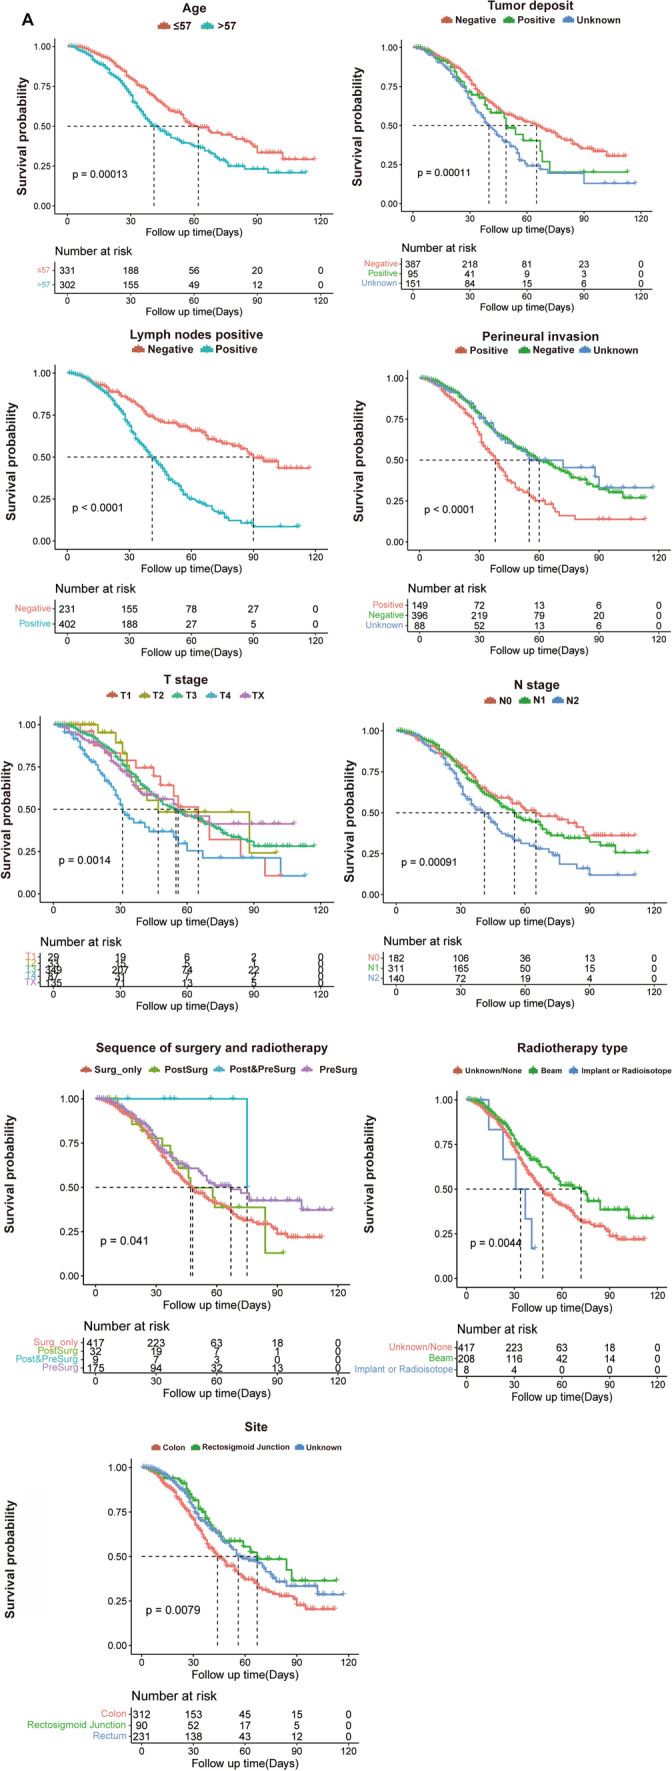
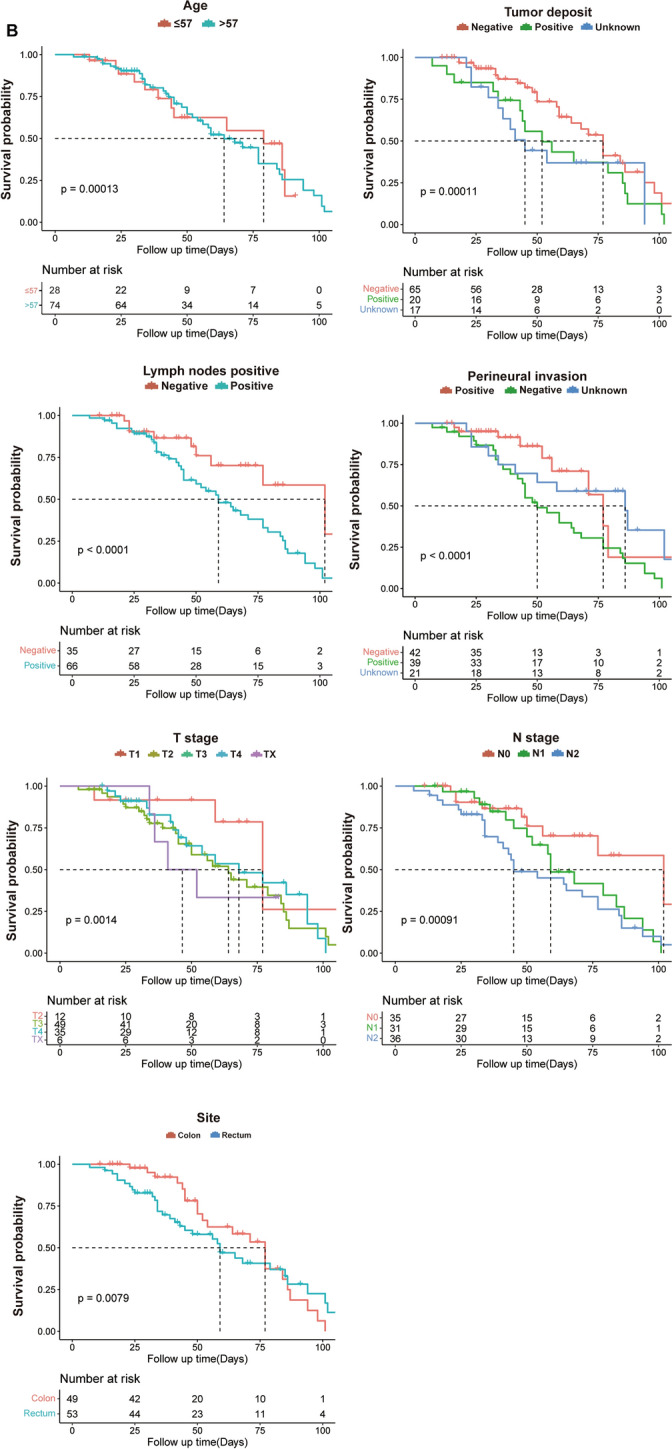
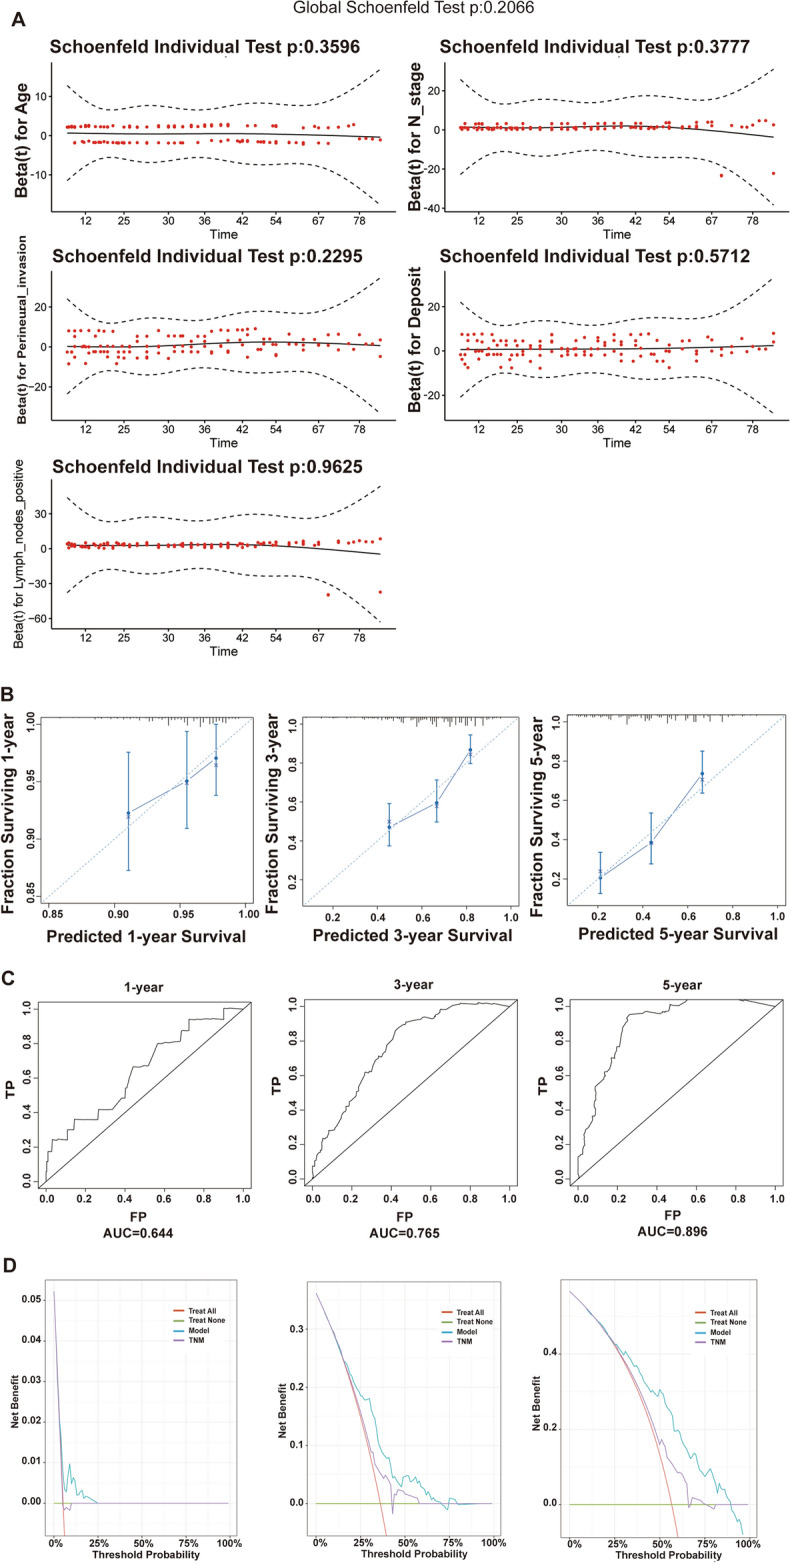
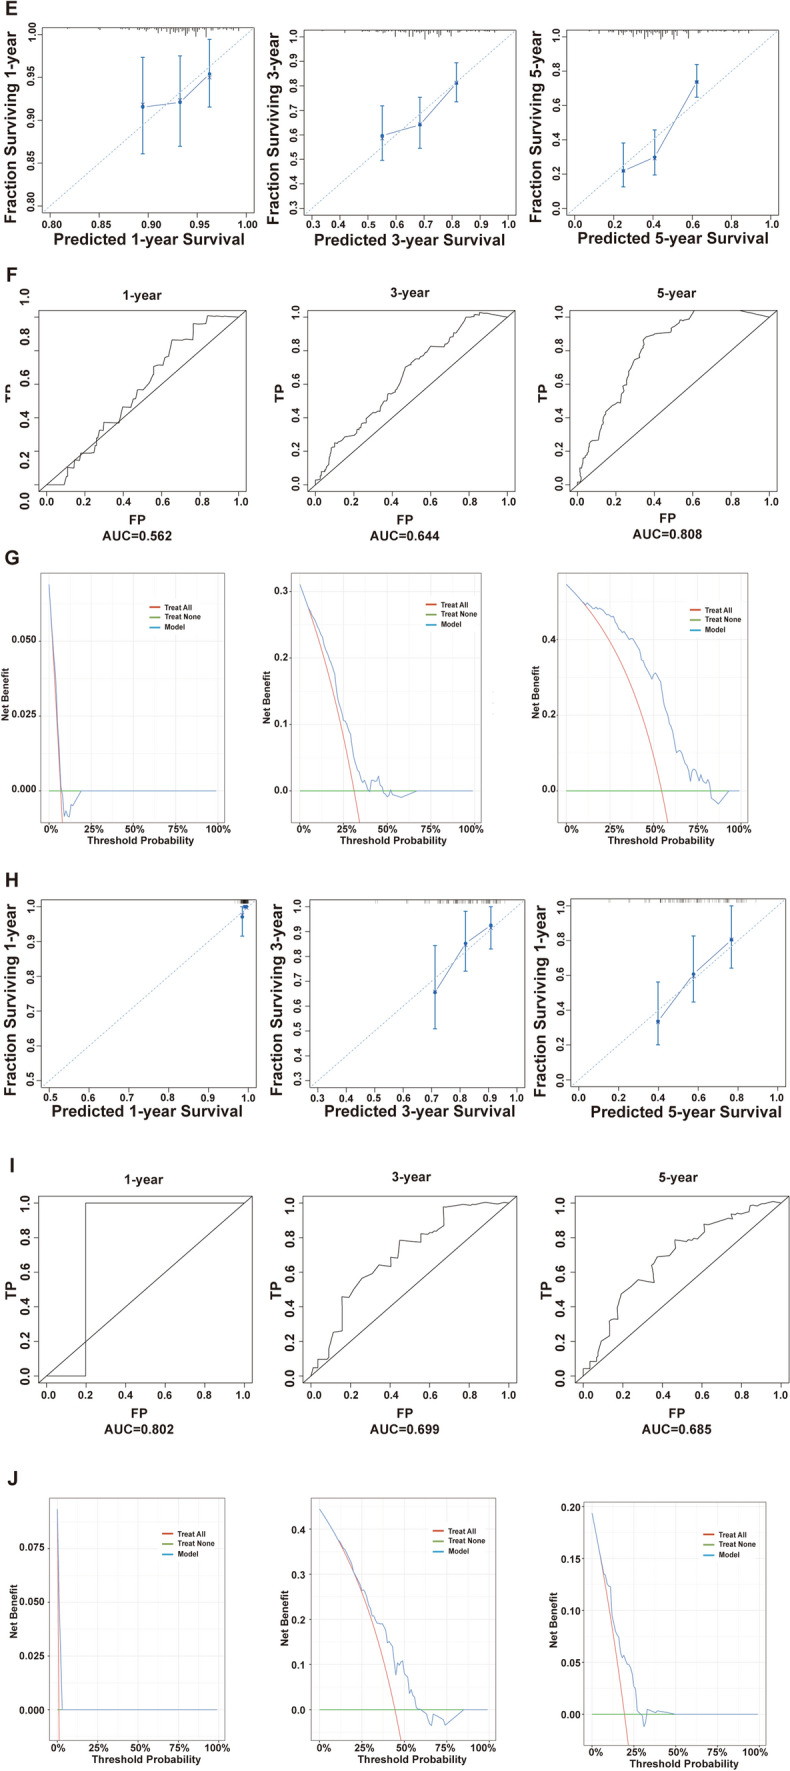
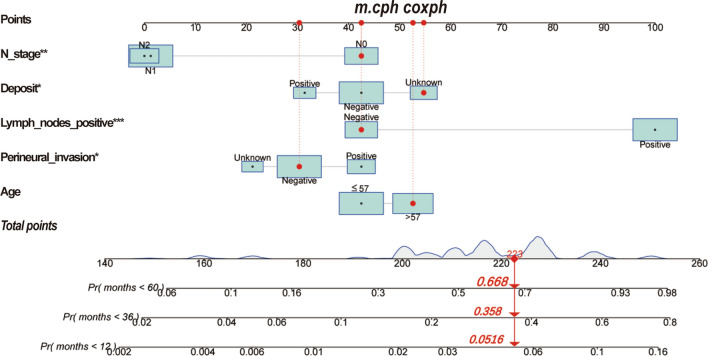
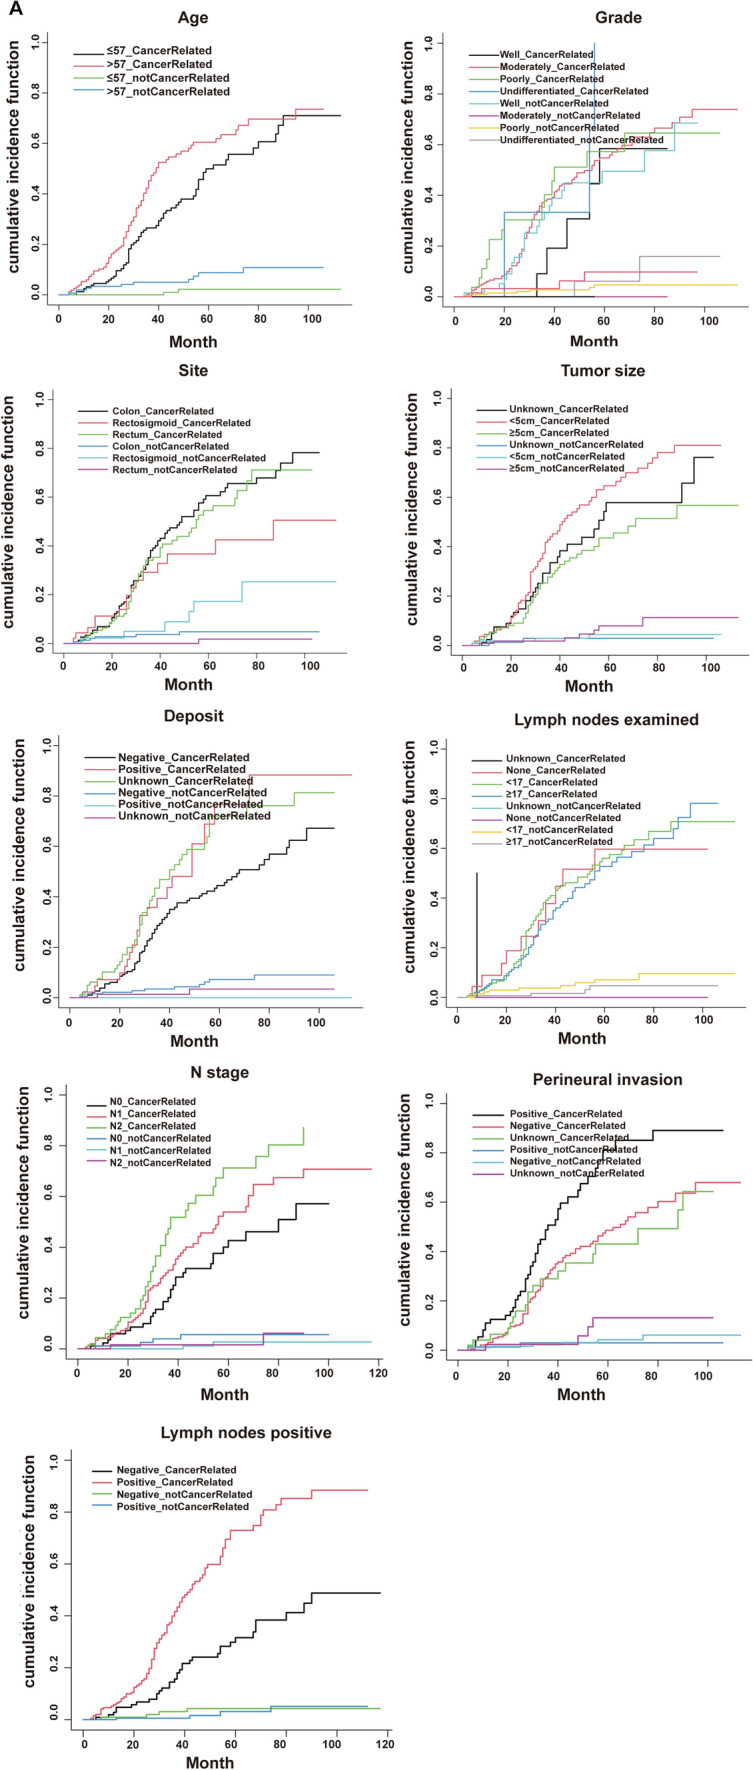
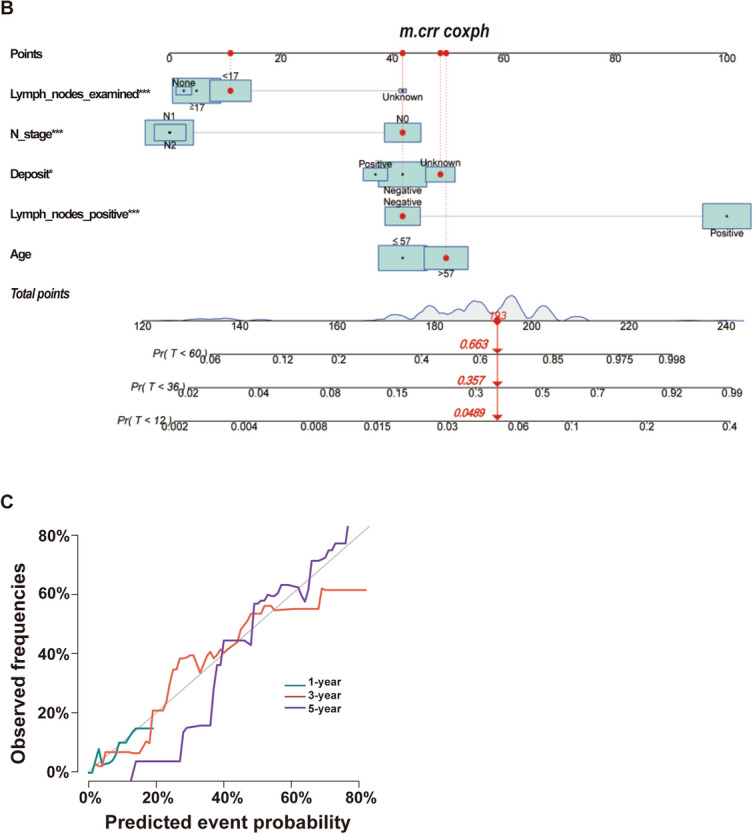
Methods: We collected information on individuals who had a pathological diagnosis of colorectal cancer between 2000 and 2019 from the Surveillance, Epidemiology, and End Results (SEER) Database. We obtained data from patients who underwent pathological diagnosis of colorectal cancer and got comprehensive therapy at the hospital between January 1, 2010, and June 1, 2022. The SEER data collected after screening according to the inclusion and exclusion criteria were separated into two cohorts: a training cohort (training cohort) and an internal validation cohort (internal validation cohort), using a random 1:1 split. Subgroup Kaplan-Meier (K-M) survival analyses were conducted on each of the three groups. The data that received following screening from the hospital were designated as the external validation cohort. The subsequent variables were chosen for additional examination: age, gender, marital status, race, tumor site, pretreatment carcinoembryonic antigen level, tumor size, T stage, N stage, pathological grade, number of tumor deposits, perineural invasion, number of regional lymph nodes examined, and number of positive regional lymph nodes. The primary endpoint was median overall survival (mOS). In the training cohort, we conducted univariate Cox regression analysis and utilized a stepwise regression approach, employing the Akaike information criterion (AIC) to select variables and create Cox proportional risk regression models. We evaluated the accuracy of the model using calibration curve, receiver operating characteristic curve (ROC), and area under curve (AUC). The effectiveness of the models was assessed using decision curve analysis (DCA). To evaluate the non-cancer-related outcomes, we analyzed variables that had significant impacts using subgroup cumulative incidence function (CIF) and Gray's test. These analyses were used to create competing risk regression models. Nomograms of the two models were constructed separately and prognostic predictions were made for the same patients in SEER database.
Results: This study comprised a total of 735 individuals. The mOS of the training cohort, internal validation cohort, and QDU cohort was 55.00 months (95%CI 46.97-63.03), 48.00 months (95%CI 40.65-55.35), and 68.00 months (95%CI 54.91-81.08), respectively. The multivariate Cox regression analysis revealed that age, N stage, presence of perineural infiltration, number of tumor deposits and number of positive regional lymph nodes were identified as independent prognostic risk variables (p < 0.05). In comparison to the conventional TNM staging model, the Cox proportional risk regression model exhibited a higher C-index. After controlling for competing risk events, age, N stage, presence of perineural infiltration, number of tumor deposits, number of regional lymph nodes examined, and number of positive regional lymph nodes were independent predictors of the risk of cancer-specific mortality (p < 0.05).
Conclusion: We have developed a prognostic model to predict the survival of patients with synchronous CRLM who undergo preoperative chemotherapy and surgery. This model has been tested internally and externally, confirming its accuracy and reliability.
Keywords: Preoperative chemotherapy; Prognosis; Risk model; Synchronous CRLM.
© 2024. The Author(s).
Conflict of interest statement
Figures
Similar articles
-
Developing and validation a prognostic model for predicting prognosis among synchronous colorectal cancers patients using combined log odds ratio of positive lymph nodes: a SEER database study.BMC Gastroenterol. 2024 Nov 25;24(1):427. doi: 10.1186/s12876-024-03393-7. BMC Gastroenterol. 2024. PMID: 39587468 Free PMC article.
-
Evaluation of Risk Factors, and Development and Validation of Prognostic Prediction Models for Distant Metastasis in Patients With Rectal Cancer: A Study Based on the SEER Database and a Chinese Population.Cancer Control. 2024 Jan-Dec;31:10732748241303650. doi: 10.1177/10732748241303650. Cancer Control. 2024. PMID: 39579008 Free PMC article.
-
Nomogram based on the log odds of negative lymph node/T stage can predict the prognosis of patients with colorectal cancer: a retrospective study based on SEER database and external validation in China.BMJ Open. 2024 Dec 20;14(12):e083942. doi: 10.1136/bmjopen-2024-083942. BMJ Open. 2024. PMID: 39806584 Free PMC article.
-
Analysis of prognostic factors and risk prediction in brain metastases: a SEER population-based study.Front Oncol. 2025 May 21;15:1523069. doi: 10.3389/fonc.2025.1523069. eCollection 2025. Front Oncol. 2025. PMID: 40469182 Free PMC article.
-
Development and validation of a preoperative systemic inflammation-based nomogram for predicting surgical site infection in patients with colorectal cancer.Int J Colorectal Dis. 2024 Dec 21;39(1):208. doi: 10.1007/s00384-024-04772-y. Int J Colorectal Dis. 2024. PMID: 39707016 Free PMC article. Review.
Cited by
-
A predictive nomogram for predicting liver metastasis in early-onset colon cancer: a population-based study.Transl Cancer Res. 2025 Jan 31;14(1):545-553. doi: 10.21037/tcr-24-1159. Epub 2025 Jan 21. Transl Cancer Res. 2025. PMID: 39974390 Free PMC article.
-
Development of prediction models for liver metastasis in colorectal cancer based on machine learning: a population-level study.Transl Cancer Res. 2024 Nov 30;13(11):5943-5952. doi: 10.21037/tcr-24-1194. Epub 2024 Nov 18. Transl Cancer Res. 2024. PMID: 39697759 Free PMC article.
References
-
- Cervantes A, Adam R, Roselló S, et al. Metastatic colorectal cancer: ESMO clinical practice guideline for diagnosis, treatment and follow-up. Ann Oncol. 2023;34(1):10–32. - PubMed
-
- Hong YS, Song SY, Lee SI, et al. A phase II trial of capecitabine in previously untreated patients with advanced and/or metastatic gastric cancer. Ann Oncol. 2004;15(9):1344–7. - PubMed
-
- De Jong MC, Pulitano C, Ribero D, et al. Rates and patterns of recurrence following curative intent surgery for colorectal liver metastasis: an international multi-institutional analysis of 1669 patients. Ann Surg. 2009;250(3):440–8. - PubMed
-
- Swan PJ, Welsh FK, Chandrakumaran K, et al. Long-term survival following delayed presentation and resection of colorectal liver metastases. Br J Surg. 2011;98(9):1309–17. - PubMed
Publication types
MeSH terms
Grants and funding
- No. Y-BMS2019-038/Beijing Xisike Clinical Oncology Research Foundation
- No. 202003030451/Science and Technology Development Plan Project of Shandong Province
- No. QDFYQN202101007/The Youth Scientific Research Fund of the Affiliated Hospital of Qingdao University
- No. KC2021-JX-0186-145/Beijing Science and Technology Innovation Medical Development Foundation
LinkOut - more resources
Full Text Sources
Medical
