. 2024 Oct;31(10):1589-1600.
doi: 10.1038/s41594-024-01325-3. Epub 2024 Jun 4.

XIST dampens X chromosome activity in a SPEN-dependent manner during early human development

Affiliations

XIST dampens X chromosome activity in a SPEN-dependent manner during early human development

Charbel Alfeghaly et al. Nat Struct Mol Biol. 2024 Oct.

Abstract

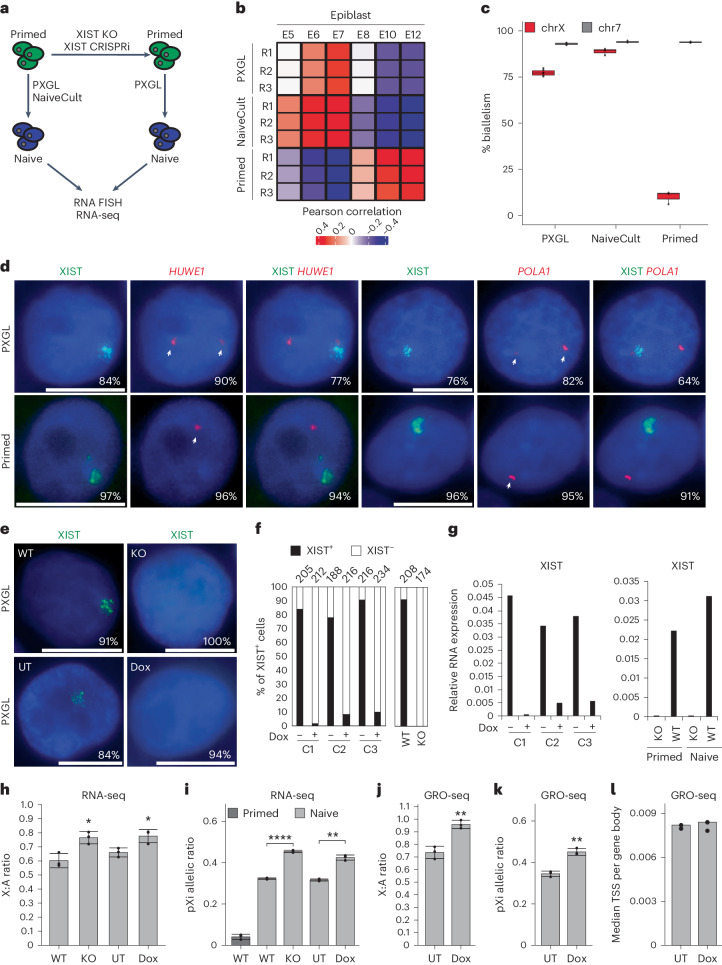
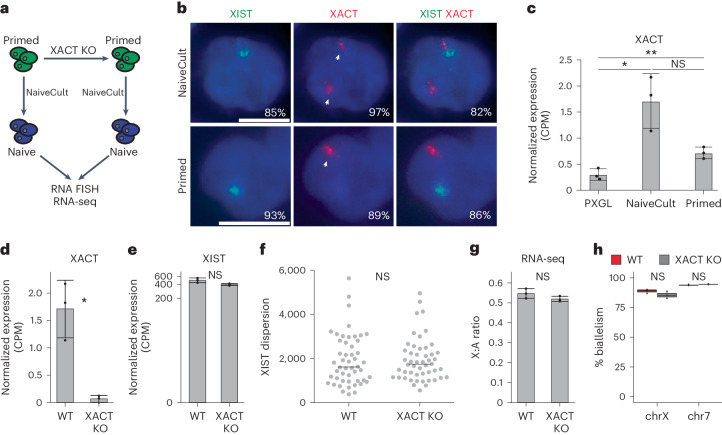
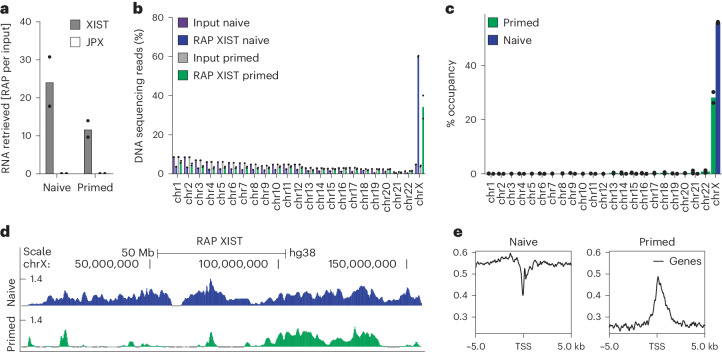
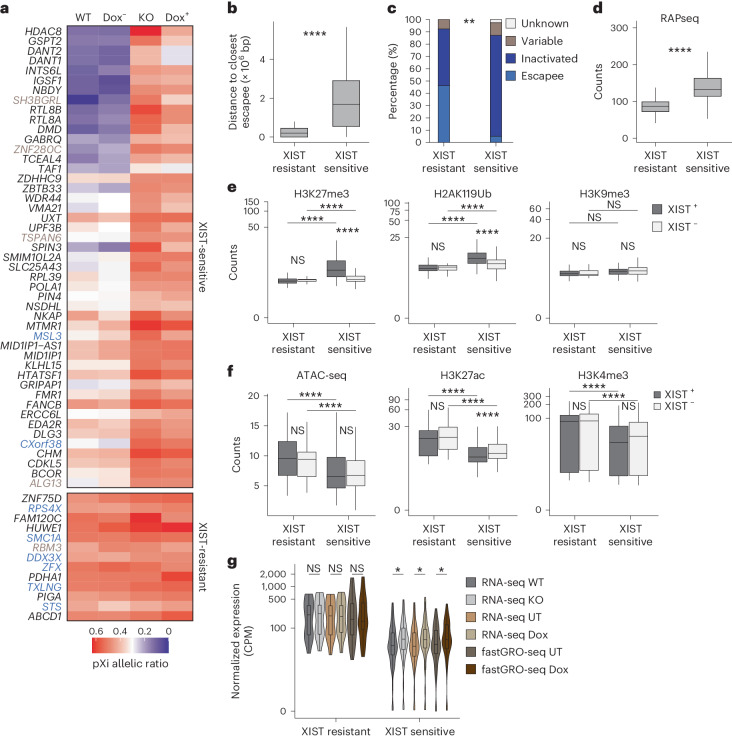
XIST (X-inactive specific transcript) long noncoding RNA (lncRNA) is responsible for X chromosome inactivation (XCI) in placental mammals, yet it accumulates on both X chromosomes in human female preimplantation embryos without triggering X chromosome silencing. The XACT (X-active coating transcript) lncRNA coaccumulates with XIST on active X chromosomes and may antagonize XIST function. Here, we used human embryonic stem cells in a naive state of pluripotency to assess the function of XIST and XACT in shaping the X chromosome chromatin and transcriptional landscapes during preimplantation development. We show that XIST triggers the deposition of polycomb-mediated repressive histone modifications and dampens the transcription of most X-linked genes in a SPEN-dependent manner, while XACT deficiency does not significantly affect XIST activity or X-linked gene expression. Our study demonstrates that XIST is functional before XCI, confirms the existence of a transient process of X chromosome dosage compensation and reveals that XCI and dampening rely on the same set of factors.


Conflict of interest statement

The authors declare no competing interests.

Figures

Fig. 1
Fig. 1. XIST attenuates X chromosome transcription in naive hES cells.
a, Scheme of XIST depletion approach (CRISPR–Cas9 or CRISRPi) in primed H9 hES cells. b, Correlation heatmap generated using epiblast markers specific to each blastocyst stage from human preimplantation and postimplantation embryo single-cell RNA (scRNA)-seq data,. Numbers correspond to the embryonic days (E5 to E12). c, Percentage of biallelically expressed SNPs from X chromosome and chromosome 7 in naive (NaiveCult, n = 3; PXGL, n = 6) and primed (n = 3) H9 hES cells obtained from RNA-seq data. Box plots represent the median (center), first and third quartiles (hinges) and ±1.5 interquartile range (IQR; whiskers). d, Representative RNA FISH images for XIST and two X-linked genes (HUWE1 and POLA1) in naive (PXGL) and primed H9 hES cells. Percentages of cells displaying the representative pattern are indicated. Scale bar = 10 µm. e, Representative RNA FISH images for XIST in naive H9 hES cells with a stable or Dox-inducible XIST repression. Percentages of cells displaying the representative pattern are indicated. Scale bar = 10 µm. f, Quantification of RNA FISH data showing the percentage of cells with XIST signal in XIST WT, XIST KO and three XIST CRISPRi naive H9 clones (C1–C3) treated or not with Dox. g, RT–qPCR analysis of XIST expression in naive XIST CRISPRi clones with or without Dox treatment (left) and in XIST WT and KO naive and primed H9 hES cells (right). Values are normalized to β-actin. h, X:A ratio from RNA-seq data of XIST WT, KO, UT CRISPRi and Dox-treated (Dox) CRISPRi naive H9 cells (n = 3). Data are presented as the mean values ± s.d. of replicates. i, pXi allelic ratio from RNA-seq data of primed (WT) and naive (XIST WT, KO, UT CRISPRi and Dox-treated CRISPRi) H9 hES cells (n = 3). Data are presented as the mean values ± s.d. of replicates. j, X:A ratio from fastGRO-seq data of XIST UT and Dox-treated CRISPRi naive H9 cells (n = 3). Data are presented as the mean values ± s.d. of replicates. k, pXi allelic ratio from fastGRO-seq data of XIST UT and Dox-treated CRISPRi naive H9 cells (n = 3). Data are presented as the mean values ± s.d. of replicates. l, Ratio of the median coverage of reads on the TSS and gene body from fastGRO-seq data from XIST UT (n = 2) and Dox-treated (n = 3) CRISPRi naive H9 hES cells. Unless otherwise specified, P values were calculated by a two-sided unpaired t-test. Levels of significance: not significant (NS; P ≥ 0.05), *P < 0.05, **P < 0.01, ***P < 0.001 and ****P < 0.0001. Source data
Fig. 2
Fig. 2. XACT does not control X chromosome activity in naive hES cells.
a, Scheme of XACT deletion using CRISPR–Cas9 approach in primed H9 hES cells. Primed WT and XACT KO H9 cells were converted to the naive state using NaiveCult protocol. b, Representative RNA FISH images for XIST and XACT in naive (NaiveCult) and primed H9 hES cells. Percentages of cells displaying the representative pattern are indicated. Scale bar = 10 µm. c, XACT expression levels in naive (PXGL and NaiveCult) and primed H9 cells obtained from RNA-seq data (n = 3). Data are presented as the mean values ± s.d. of replicates. d, XACT expression level in XACT WT and KO naive hES cells obtained from RNA-seq data (n = 3). Data are presented as the mean values ± s.d. of replicates. e, XIST expression level in XACT WT and KO naive cells obtained from RNA-seq data (n = 3). Data are presented as the mean values ± s.d. of replicates. f, Distribution of the dispersion of XIST RNA FISH signal in XACT WT and KO naive cells (n = 50 cells per condition examined over one experiment). The horizontal line represents the median dispersion of each group; Wilcoxon P value ≥ 0.05 (NS). g, X:A ratio from RNA-seq data of WT and XACT KO naive H9 cells (n = 3). Data are presented as the mean values ± s.d. of replicates. h, Percentage of biallelically expressed SNPs from the X chromosome and chromosome 7 in XACT WT (n = 3) and KO (n = 3) naive H9 hES cells, obtained from RNA-seq data. Box plots represent the median (center), first and third quartiles (hinges) and ±1.5 IQR (whiskers). Unless otherwise specified, P values were calculated by a two-sided unpaired t-test. Levels of significance: NS (P ≥ 0.05), *P < 0.05, **P < 0.01, ***P < 0.001 and ****P < 0.0001. Source data
Fig. 3
Fig. 3. XIST is broadly distributed on the dampened X chromosome in naive hES cells.
a, Analysis by RT–qPCR of XIST and JPX enrichment after XIST pulldown in naive and primed H9 hES cells. JPX was used as a negative control. Values were normalized to the input (n = 2). b, Percentage of aligned DNA sequencing reads per chromosome after XIST pulldown and in input material in naive and primed H9 hES cells (n = 2). c, Percentage of XIST RAP peak occupancy per chromosome for primed and naive H9 hES cells (n = 2). d, XIST RAP profiles (log2 enrichment over input) on the X chromosome in naive and primed H9 hES cells. e, Profile plots of XIST RAPseq reads over a 10-kb region flanking the TSSs of X-linked genes in naive and primed H9 hES cells. Source data
Fig. 4
Fig. 4. PRC-associated repressive histone modifications accumulate on dampened X chromosome in an XIST-dependent manner in naive hES cells.
a, Mean enrichment of H3K27me3, H2AK119Ub and H3K9me3 per chromosome in naive and primed H9 hES cells (n = 2). All individual data points are shown. Box plots represent the median (center), first and third quartiles (hinges) and ±1.5 IQR (whiskers). BPM, bins per million mapped reads. b, CUT&RUN profiles (log2 enrichment over IgG) for H3K27me3, H2AK119Ub and H3K9me3 on the X chromosome in naive and primed H9 hES cells. c, Percentage of H3K27me3, H2AK119Ub and H3K9me3 peak occupancy per chromosome for primed and naive H9 hES cells. Black and green dotted lines represent the median genomic occupancy. d, Representative immunofluorescence images for H3K27me3 and H2AK119Ub in primed and naive H9 hES cells. Percentages of cells displaying the representative pattern are indicated. Scale bar = 10 µm. e, Representative immunofluorescence images for H3K27me3 coupled with XIST RNA FISH in naive H9 hES cells. Percentages of cells displaying the representative pattern are indicated. Scale bar = 10 µm. f, Immunofluorescence images for H3K27me3 and NANOG in human preimplantation blastocysts (stages B3 to B5). Source data
Fig. 5
Fig. 5. Highly expressed genes escape XIST-mediated dampening.
a, Heat map showing the pXi allelic ratio of XIST-sensitive and XIST-resistant genes in XIST WT, KO, UT CRISPRi (Dox) and Dox-treated CRISPRi (Dox+) naive H9 cells. Constitutive and variable escapees from the Tukiainen study are highlighted in light blue and brown, respectively. b, Distance to closest escapee of XIST-sensitive (n = 47) and XIST-resistant (n = 13) genes. c, Percentage of escapees (constitutive and variable) and inactivated X-linked genes from the Tukiainen study among XIST-sensitive and XIST-resistant genes; chi-square test P value < 0.01 (**). d, XIST RAPseq counts on TSS ± 5 kb of XIST-sensitive (n = 47) and XIST-resistant (n = 13) genes in naive H9 cells. e, H3K27me3, H2AK119Ub and H3K9me3 counts on TSS ± 5 kb of XIST-sensitive (n = 47) and XIST-resistant (n = 13) genes in the presence (XIST WT and UT CRISPRi) or absence (XIST KO and Dox-treated CRISPRi) of XIST in naive H9 hES cells. f, ATAC-seq, H3K27ac and H3K4me3 counts on TSS ± 5 kb of XIST-sensitive (n = 47) and XIST-resistant (n = 13) genes in the presence (XIST WT and UT CRISPRi) or absence (XIST KO and Dox-treated CRISPRi) of XIST in naive H9 hES cells. g, Violin plots showing the log CPM expression level of XIST-sensitive (n = 47) and XIST-resistant (n = 13) genes in XIST WT, KO, UT CRISPRi and Dox-treated CRISPRi naive H9 cells, obtained from RNA-seq and fastGRO-seq data. All box plots represent the median (center), first and third quartiles (hinges) and ±1.5 IQR (whiskers). Unless otherwise specified, P values were calculated by a two-sided unpaired t-test. Levels of significance: NS (P ≥ 0.05), *P < 0.05, **P < 0.01, ***P < 0.001 and ****P < 0.0001. Source data
Fig. 6
Fig. 6. SPEN is involved in XIST-mediated dampening.
a, Expression level of SPEN in naive (PXGL and NaiveCult) and primed H9 cells obtained from RNA-seq data (n = 3). Data are presented as the mean values ± s.d. of replicates; Wilcoxon P value ≥ 0.05 (NS). b, RT–qPCR showing fold enrichment levels of XIST, β-actin and MALAT1 normalized to RPLP0 following RIP of SPEN (n = 3). Data are presented as the mean values ± s.d. of replicates; Wilcoxon P value < 0.05 (*). c, RT–qPCR analysis of SPEN expression after siRNA KD using two different mixes of siRNAs (SPEN1 and SPEN2; n = 3). Values are normalized to β-actin. Data are presented as the mean values ± s.d. of replicates; Wilcoxon P value ≥ 0.05 (NS). d, RT–qPCR analysis of XIST expression after SPEN KD (n = 3). Values are normalized to β-actin. Data are presented as the mean values ± s.d. of replicates; Wilcoxon P value ≥ 0.05 (NS). e, Percentage of biallelically expressed SNPs from X chromosome in scramble (n = 3) and SPEN (n = 3) KD naive H9 cells, obtained from RNA-seq data. Box plots represent the median (center), first and third quartiles (hinges) and ±1.5 IQR (whiskers). f, pXi allelic ratio from RNA-seq data of scramble and SPEN KD naive H9 hES cells (n = 3). Data are presented as the mean values ± s.d. of replicates. g, Heatmap showing the pXi allelic ratio of XIST-sensitive and XIST-resistant gene expression upon SPEN KD in naive H9 hES cells. An increase in pXi allelic ratio (FC > 1.2) from one (*) or both (**) siSPEN mixes is indicated. Unless otherwise specified, P values were calculated by a two-sided unpaired t-test. Levels of significance: NS (P ≥ 0.05), *P < 0.05, **P < 0.01, ***P < 0.001 and ****P < 0.0001. Source data
Extended Data Fig. 1
Extended Data Fig. 1. Characterization of the X chromosome status in naïve XIST KO and XIST CRISPRi clones.
a, Bar plot comparing log2 FC in RNA-seq data between naïve (NaïveCult and PXGL) and primed H9 hESCs (n = 3). Core pluripotency factors and state-specific markers are highlighted. b, X chromosome map showing positions and allelic status of expressed SNPs in naïve (NaiveCult and PXGL) and primed H9 hESCs. c, RNA-FISH data quantification showing percentage of cells with monoallelic or biallelic XIST (green) and/or X-linked genes (HUWE1 and POLA1; red) signals in naïve (PXGL) and primed H9 hESCs. d, Percentage of XIST allelic expression in naïve (NaiveCult and PXGL) and primed H9 hESCs, based from RNA-seq data. e, Top: Gel images of PCR products from WT and XIST-targeted primed H9 hESCs using various screening primers on genomic DNA. Bottom: Schematic of the XIST deletion approach indicating CRISPR sgRNA locations (yellow triangles) and screening primer positions (black arrows). f, Copy number analysis of dCas9Krab and sgRNA insertion in the 3 XIST CRISPRi clones (C1-C3) using qPCR on genomic DNA. Values are normalized to β-actin. g, Expression levels of core and naïve specific pluripotency factors in naïve H9 WT, XIST KO and XIST CRISPRi clones untreated (UT) or treated with Dox, from RNA-seq data (n = 3). Data are presented as mean values +/- SD of replicates. h, PCA plot displaying the first two principal components of the RNA-seq data from naïve (WT, XIST KO, XIST CRISPRi UT and dox-treated) and WT primed H9 hESCs. i, Number of DEGs upon XIST KO (top) and XIST CRISPRi (bottom) repression in naïve H9 cells. j, Median expression values per chromosome in naïve WT, XIST KO and XIST CRISPRi clones UT or treated with Dox, obtained from RNA-seq and fastGRO-seq data (n = 3). Data are presented as mean values +/- SD of replicates. k, Percentage of biallelically expressed X chromosome SNPs in naïve H9 WT, XIST KO, and XIST CRISPRi clones (UT or Dox-treated, n = 3) based on RNA-seq data. Boxplots represent the median (center) first and third quartile (hinges) and ±1.5 × IQR (whiskers). Unless otherwise specified, p-values were calculated by two-sided unpaired t-test. Levels of significance: ns≥0.05; * < 0.05; ** < 0.01; *** < 0.001; **** < 0.0001. Source data
Extended Data Fig. 2
Extended Data Fig. 2. Characterization of XACT KO clones in naïve hESCs.
a, Quantification of RNA-FISH data showing the percentage of cells with monoallelic or biallelic XIST (green) and/or X-linked gene (XACT; red) signals in naïve (NaiveCult) and primed H9 hESCs. b, Top: Electrophoretic gel pictures showing the PCR amplicons obtained with different screening primers on genomic DNA from XACT targeted primed H9 hESCs. Black rectangles represent 3 independent XACT KO clones which were used for subsequent experiments. Bottom: Schematic representation of XACT deletion strategy showing the positions of the CRISPR sgRNAs (yellow triangles) and screening primers used to characterize the clones (black arrows). c, Expression levels of core and naïve specific pluripotency factors in naïve H9 WT and XACT KO, from RNA-seq data (n = 3). Data are presented as mean values +/- SD of replicates. d, PCA displaying the first two principal components of the WT and XACT KO RNA-seq data in naïve and primed H9 hESCs. e, Volcano plot representing the significance versus Log2 fold change for all differentially expressed genes (n = 30, FDR < 0.05, log2FC > |1 | ) upon XACT deletion (n = 3). f, Representative images of XIST and XACT RNA-FISH in WT and XACT KO naïve (NaiveCult) H9 hESCs. Scale bar= 10 µm. Unless otherwise specified, p-values were calculated by two-sided unpaired t-test. Levels of significance: ns≥0.05; * < 0.05; ** < 0.01; *** < 0.001; **** < 0.0001. Source data
Extended Data Fig. 3
Extended Data Fig. 3. Characterization of XIST enrichment on the X chromosome in naïve and primed hESCs.
a, PCA plot displaying the first two principal components of the XIST RAPseq data in naïve (PXGL) and primed H9 hESCs. b, Heatmap showing the Pearson correlation between naïve and primed XIST RAPseq replicates on the X chromosome. c, XIST RAPseq profiles showing the log2 enrichment over the X chromosome in naïve compared to primed H9 hESCs. d, Scatter plots showing the linear regression line and Pearson correlation for the comparison of XIST coverage scores with gene, LINE, retrotransposon, and LTR densities in naïve and primed H9 hESCs. e, Expression levels of XIST from naïve: PXGL (n = 3) and NaiveCult (n = 3), and primed (n = 3) H9 RNA-seq data. Data are presented as mean values +/- SD of replicates. f, CUT&RUN H3K4me3 profiles across the XIST gene in naïve and primed H9. XIST spliced isoforms detected in naïve and primed H9 along with the A-F repeats are shown. Arbitrary name of each isoform (XIST1.1, XIST1.2, etc) is indicated on the left, together with their expression pattern (Primed and/or Naïve). Unless otherwise specified, p-values were calculated by two-sided unpaired t-test. Levels of significance: ns≥0.05; * < 0.05; ** < 0.01; *** < 0.001; **** < 0.0001. Source data
Extended Data Fig. 4
Extended Data Fig. 4. Characterization of the X chromatin landscape in WT, XIST KO and XIST CRISPRi UT and Dox-treated clones in naïve hESCs.
a, Heatmap showing the Pearson correlation between X chromosome H3K27me3, H2AK119Ub, and H3K9me3 CUT&RUN replicates from naïve and primed H9. b, X chromosome H3K27me3 and H2AK119Ub profiles from H9 naïve cells reprogrammed using PXGL or t2iLGO. c, Scatter plots showing the Pearson correlation, for the X chromosome, between our CUT&RUN dataset and the other datasets. d, Scatter plots showing the Pearson correlation between RAP XIST and repressive histone modifications (H3K27me3, H2AK119Ub, H3K9me3) on the X chromosome in naïve and primed H9. e, CUT&RUN profiles (log2 enrichment over IgG) for H3K27me3, H2AK119Ub and H3K9me3 on the X chromosome in naïve WT, XIST KO and XIST CRISPRi H9 cells. f, Representative immunofluorescence images for H3K27me3 and H2AK119Ub in naïve H9 WT, XIST KO, XIST CRISPRi UT or treated with Dox. Percentages of cells with the representative pattern are indicated. Scale bar= 10 µm. g, Quantification of immunofluorescence data showing the percentage of cells with H3K27me3 and H2AK119Ub foci in XIST KO and XIST CRISPRi naïve hESCs. h, H3K27me3 immunofluorescence of one human early blastocyst (B4). i, Quantification of immunofluorescence data from human embryos showing the percentage of cells with 0, 1, 2, or ≥3 H3K27me3 foci. Source data
Extended Data Fig. 5
Extended Data Fig. 5. Genetic and epigenetic features of XIST-sensitive and XIST-resistant genes.
a, Distance to XIST locus of XIST-sensitive (n = 47) and resistant (n = 13) genes. b, Chromosomal map indicating the positions of XIST-sensitive and resistant genes on the X chromosome. The centromere is indicated by a grey rectangle. c, Comparison of MeD-seq methylation scores in TSS (right) and gene body (left) between XIST-sensitive (n = 47) and resistant (n = 13) genes. d, Profile plots of H3K27me3, H2AK119Ub, and H3K9me3 over XIST-sensitive and resistant genes in XIST positive (WT, XIST CRISPRi UT) and XIST negative (XIST KO, Dox-treated XIST CRISPRi) naïve H9 cells. e, Expression levels of XIST-resistant (n = 13) and sensitive (n = 47) genes in human pre-implantation and post-implantation embryos, based from scRNA-seq,. Purple and orange dotted lines indicate the median expression of XIST-resistant and XIST-sensitive genes, respectively. BLASTO: blastocyst; EPI: epiblast; PrE: primitive endoderm; TE: trophectoderm. Numbers correspond to the embryonic days. All boxplots represent the median (center) first and third quartile (hinges) and ±1.5 × IQR (whiskers). Unless otherwise specified, p-values were calculated by two-sided unpaired t-test. Levels of significance: ns≥0.05; * < 0.05; ** < 0.01; *** < 0.001; **** < 0.0001. Source data
Extended Data Fig. 6
Extended Data Fig. 6. Characterization of SPEN expression and KD.
a, Protein abundance level of SPEN from publicly available proteomics data in naïve (n = 3) and primed (eroded) (n = 3) H9 cells. Data are presented as mean values +/- SD of replicates. Wilcoxon p-value = ns≥0.05. b, Expression level in CPM of naïve and core pluripotency factors in control (siScr) and SPEN knockdown naïve H9 (n = 3). Data are presented as mean values +/- SD of replicates. c, Volcano plots representing the significance versus Log2 fold change for all differentially expressed genes (FDR < 0.05, log2FC > |1 | ) upon SPEN KD (n = 3). Upregulated and downregulated X-linked genes are highlighted. d, Venn diagram showing the intersection of differentially expressed genes between siSPEN1 and siSPEN2 datasets. e, Bar plot showing the number of differentially expressed genes on all chromosomes in siSPEN1 and siSPEN2 conditions compared to siScr. f, Percentage of biallelically expressed SNPs from chromosome 7 in siScr (n = 3) and siSPEN (n = 3) naïve H9, obtained from RNA-seq data. g, X/A ratio from RNA-seq data of siRNA SPEN KD in naïve H9 cells (n = 3). Data are presented as mean values +/- SD of replicates. Unless otherwise specified, p-values were calculated by two-sided unpaired t-test. Levels of significance: ns≥0.05; * < 0.05; ** < 0.01; *** < 0.001; **** < 0.0001. Source data

References

    1. Avner, P. & Heard, E. X-chromosome inactivation: counting, choice and initiation. Nat. Rev. Genet.2, 59–67 (2001). - PubMed
    1. Brockdorff, N., Bowness, J. S. & Wei, G. Progress toward understanding chromosome silencing by XIST RNA. Genes Dev.34, 733–744 (2020). - PMC - PubMed
    1. Plath, K., Mlynarczyk-Evans, S., Nusinow, D. A. & Panning, B. XIST RNA and the mechanism of X chromosome inactivation. Annu. Rev. Genet.36, 233–278 (2002). - PubMed
    1. Hadjantonakis, A.-K., Cox, L. L., Tam, P. P. L. & Nagy, A. An X-linked GFP transgene reveals unexpected paternal X-chromosome activity in trophoblastic giant cells of the mouse placenta. Genesis29, 133–140 (2001). - PubMed
    1. Sugimoto, M., Tan, S. S. & Takagi, N. X chromosome inactivation revealed by the X-linked lacZ transgene activity in periimplantation mouse embryos. Int. J. Dev. Biol.44, 177–182 (2000). - PubMed

MeSH terms