. 2024 Oct;31(10):1543-1556.
doi: 10.1038/s41594-024-01320-8. Epub 2024 Jun 4.

Mini-heterochromatin domains constrain the cis-regulatory impact of SVA transposons in human brain development and disease

Affiliations

Mini-heterochromatin domains constrain the cis-regulatory impact of SVA transposons in human brain development and disease

Vivien Horváth et al. Nat Struct Mol Biol. 2024 Oct.

Abstract

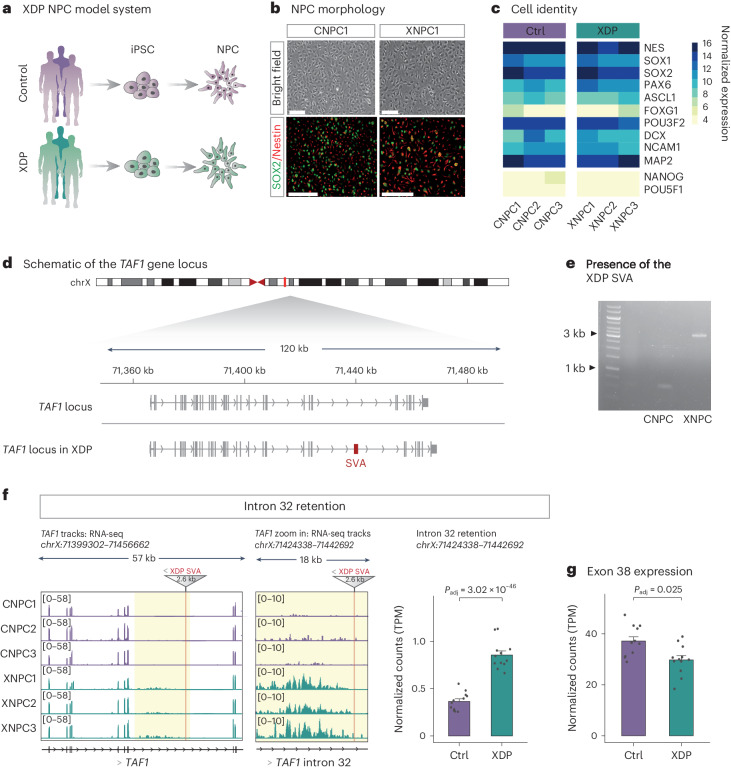
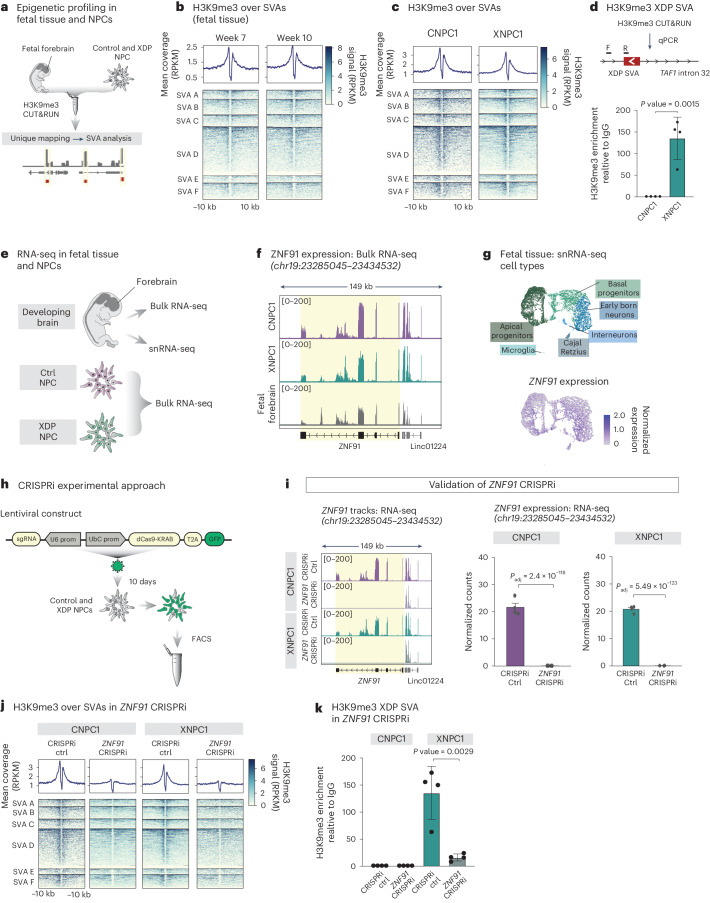
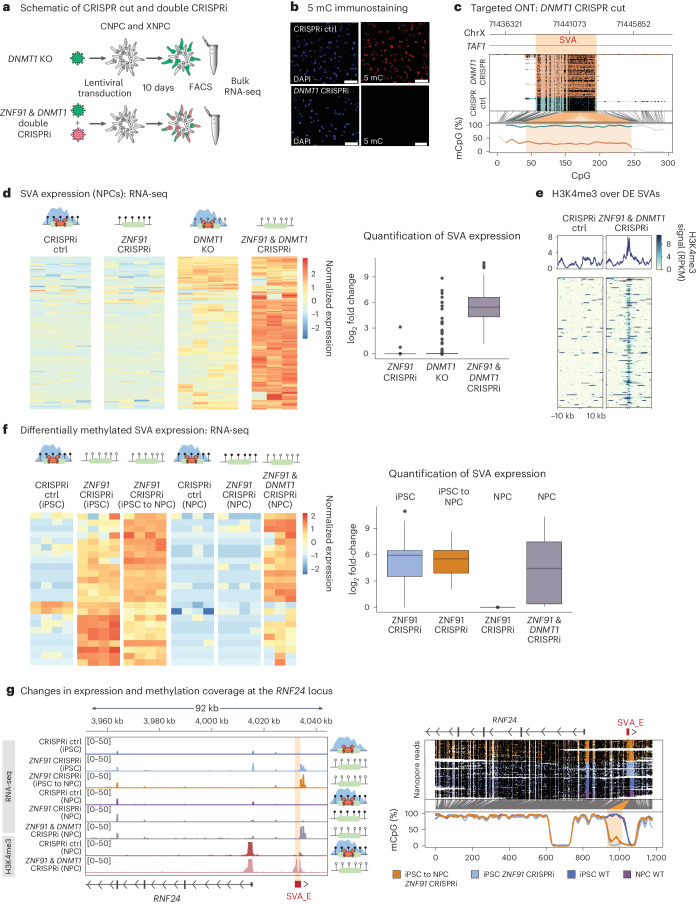
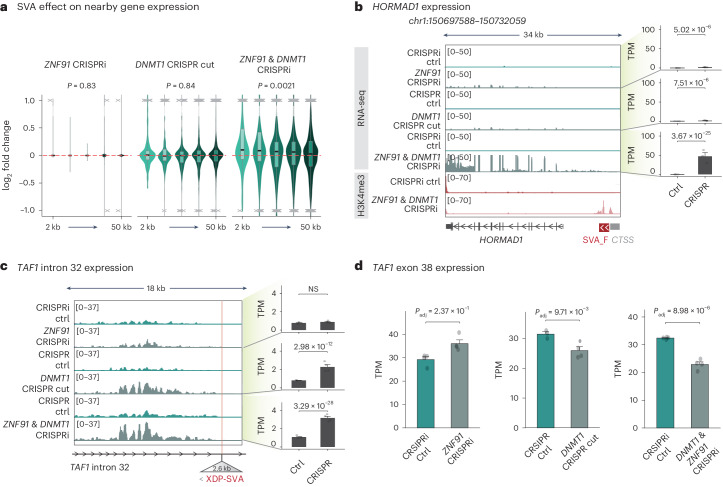
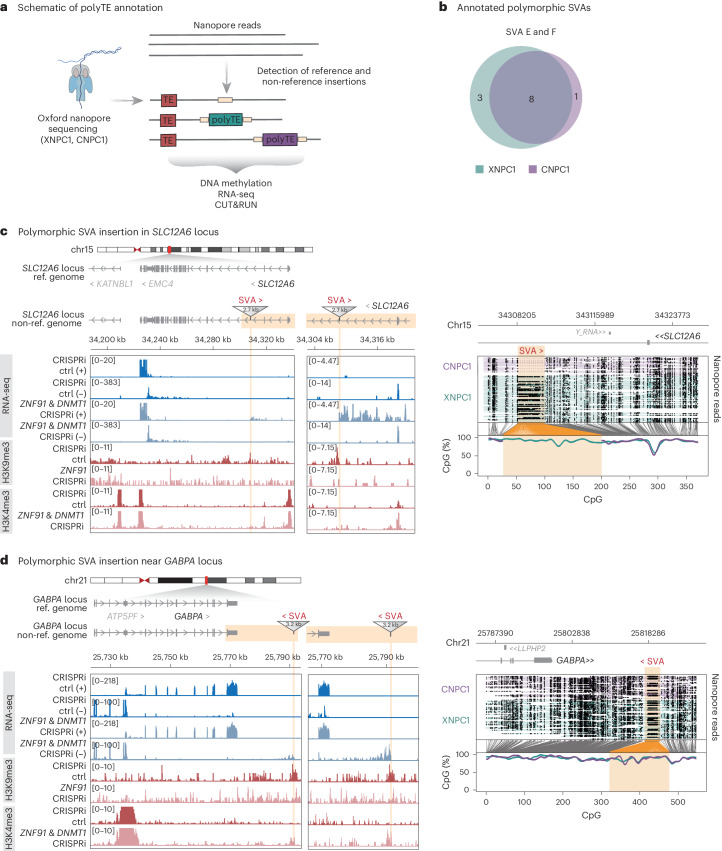
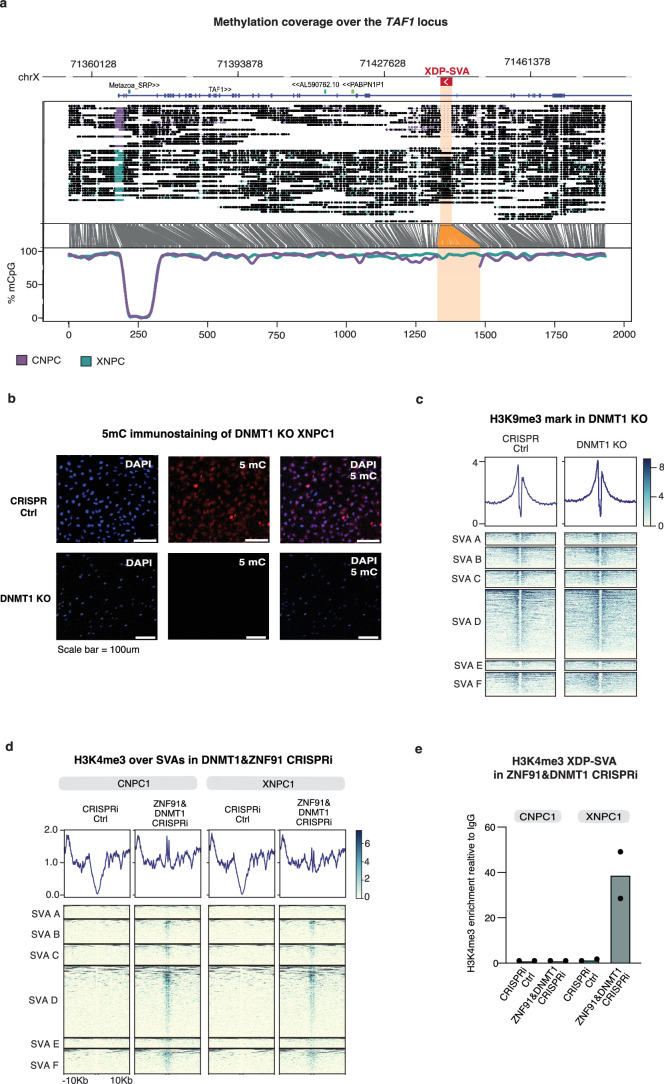
SVA (SINE (short interspersed nuclear element)-VNTR (variable number of tandem repeats)-Alu) retrotransposons remain active in humans and contribute to individual genetic variation. Polymorphic SVA alleles harbor gene regulatory potential and can cause genetic disease. However, how SVA insertions are controlled and functionally impact human disease is unknown. Here we dissect the epigenetic regulation and influence of SVAs in cellular models of X-linked dystonia parkinsonism (XDP), a neurodegenerative disorder caused by an SVA insertion at the TAF1 locus. We demonstrate that the KRAB zinc finger protein ZNF91 establishes H3K9me3 and DNA methylation over SVAs, including polymorphic alleles, in human neural progenitor cells. The resulting mini-heterochromatin domains attenuate the cis-regulatory impact of SVAs. This is critical for XDP pathology; removal of local heterochromatin severely aggravates the XDP molecular phenotype, resulting in increased TAF1 intron retention and reduced expression. Our results provide unique mechanistic insights into how human polymorphic transposon insertions are recognized and how their regulatory impact is constrained by an innate epigenetic defense system.


Conflict of interest statement

The authors declare no competing interests.

Figures

Fig. 1
Fig. 1. Characterization of the XDP NPC model system.
a, Schematic of the generation of XDP NPCs. b, Bright-field images of control (CNPC1) and XDP (XNPC1) NPCs (top). Immunocytochemistry (bottom) of SOX2 (green) and Nestin (red) in control and XDP NPCs. Scale bars, 200 µm. c, Heatmap of NPC marker gene expression in control (n = 3) and XDP (n = 3) NPCs measured using RNA-seq. d, Schematic of the TAF1 gene locus. The polymorphic XDP SVA is depicted in red. e, PCR analysis of genomic DNA identifying the XDP SVA. f, Left, genome browser tracks showing gene expression of the TAF1 gene and a magnification of intron 32 of TAF1, highlighting the characteristic intron retention in XDP NPCs. The XDP SVA and its direction relative to the TAF1 gene are depicted in red. Right, quantification of TAF1 intron 32 retention in control (n = 12) and XDP (n = 12) NPCs. Bars show the normalized mean expression of the group (adjusted P value (Benjamini–Hochberg correction) as calculated by DESeq2 (Wald test, two-sided)). Error bars show the s.e.m. g, Quantification of TAF1 exon 38 expression in control (n = 12) and XDP (n = 12) NPCs. Bars show the normalized mean expression of the group (adjusted P value (Benjamini–Hochberg correction) as calculated by DESeq2 (Wald test, two-sided)). Error bars show the s.e.m. Source data
Fig. 2
Fig. 2. ZNF91 is required for H3K9me3 maintenance at SVAs in NPCs.
a, Schematic of the CUT&RUN approach to profile H3K9me3 at SVAs in NPCs and human fetal forebrain tissue. b, Heatmap showing enrichment of H3K9me3 over SVAs in human fetal forebrain tissue. Genomic regions ±10 kbp upstream and downstream of the element are shown. c, Heatmap showing H3K9me3 enrichment in NPCs. The genomic regions spanning ±10 kbp upstream and downstream of the element are displayed. d, Schematic of the CUT&RUN qPCR approach. Bar plots demonstrating the enrichment of H3K9me3 over the XDP SVA in XDP NPCs (n = 4) and the lack of enrichment in control NPCs (n = 4; two-tailed t-test). Bars show the H3K9me3 enrichment in each replicate and error bars represent the s.d. e, Schematic of RNA-seq and snRNA-seq experiments in NPCs and human fetal forebrain tissue. f, RNA-seq tracks of ZNF91 expression in NPCs and fetal forebrain. g, Top, uniform manifold approximation and projection (UMAP) showing characterized cell types. Bottom, UMAP representing ZNF91 expression in different cell types in the fetal brain. h, Schematic of the CRISPRi approach including the lentiviral construct and experimental design. i, RNA-seq tracks (left) and quantification (right) of ZNF91 expression in control CRISPRi and ZNF91 CRISPRi in control (n = 4) and XDP (n = 4) NPCs. Bars show the normalized mean expression of the group (adjusted P value (Benjamini–Hochberg correction) as calculated by DESeq2 (Wald test, two-sided)). Error bars show the s.e.m. j, Heatmap showing H3K9me3 over SVAs in control CRISPRi and ZNF91 CRISPRi in control and XDP NPCs. k, Bar graphs showing the effect of ZNF91 CRISPRi on H3K9me3 over the XDP SVA in XDP and control NPCs (n = 4 in each group; two-tailed t-test). Bars show the H3K9me3 enrichment in each replicate and error bars represent the s.d. Source data
Fig. 3
Fig. 3. SVAs are covered by DNA methylation in NPCs.
a, Schematic of ONT sequencing experiment to monitor DNA methylation over SVAs. b, Methylation coverage over SVAs in control and XDP NPCs. The different SVA families (A–F) are shown. Box plot centers correspond to the median, hinges correspond to the first or third quartile and whiskers stretch from the first or third quartile + 1.5 interquertile range (IQR; n = 1). c, Methylation coverage over the XDP SVA in control and XDP NPCs. d, Schematic of Cas9-targeted ONT sequencing. e, Targeted ONT sequencing in control CRISPRi and ZNF91 CRISPRi NPCs. The TAF1 XDP SVA locus is shown. f, Schematic of DNA methylation patterns during development in iPS cells and NPCs. ZNF91 CRISPRi in iPS cells and their conversion to NPCs are also shown. g, Violin plot showing DNA methylation over the first quarter (from their TSS) of the differentially expressed SVAs (P value as calculated by Student’s t-test (two-sided)). Box plot centers correspond to the median, hinges correspond to the first or third quartile and whiskers stretch from the first or third quartile + 1.5 IQR (wild-type iPS cell n = 1; wild-type NPC, n = 2; iPS cell and iPS cell to NPC ZNF91 KD, n = 1). h, DNA methylation pattern over an SVA element near the HORMAD1 gene.
Fig. 4
Fig. 4. DNA methylation and H3K9me3 cooperate to silence SVAs in NPCs.
a, Schematic of CRISPR-cut and double CRISPRi experiment in NPCs. b, m5C immunostaining showing the global loss of DNA methylation upon DNMT1 CRISPRi. Scale bars, 100 µm. c, DNA methylation coverage over the XDP SVA in control CRISPR and DNMT1 CRISPR-cut conditions. d, Left, heatmap) showing upregulated SVAs in ZNF91DNMT1 double CRISPRi. The same SVAs are also shown in ZNF91 CRISPRi and DNMT1 KO experiments. Right, box plot showing SVA expression in ZNF91 CRISPRi, DNMT1 KO and ZNF91DNMT1 double CRISPRi. Box plot centers correspond to the median, hinges correspond to the first or third quartile and whiskers stretch from the first or third quartile + 1.5 IQR; outliers are indicated by points (n = 4, except for ZNF91DNMT1 double CRISPRi, where n = 3). e, Heatmap showing H3K4me3 enrichment in control NPCs and NPCs with double KD of ZNF91 and DNMT1. Genomic regions spanning ±10 kbp upstream and downstream of the element are shown. f, Left, heatmap showing the expression level of differentially methylated SVAs. Right, box plot showing the expression of differentially expressed SVAs. Box plot centers correspond to the median, hinges correspond to the first or third quartile and whiskers stretch from the first or third quartile + 1.5 IQR; outliers are indicated by points (n = 4, except for ZNF91DNMT1 double CRISPRi, where n = 3). g, Genome browser tracks showing gene expression (top left), H3K4me3 (bottom left) and DNA methylation (right) pattern over an SVA element near to the RNF24 gene.
Fig. 5
Fig. 5. SVAs have a regulatory influence on nearby genes when heterochromatin marks are lost.
a, Violin plot showing the effect of SVAs on nearby gene expression (2–50 kbp) in ZNF91 CRISPRi, DNMT1 KO and ZNF91DNMT1 double CRISPRi. P value was calculated by a one-way analysis of variance (two-sided). Box plot centers correspond to the median, hinges correspond to the first or third quartile and whiskers extend until the minimum and maximum values; outliers and data points outside of the plot’s axes are indicated by crosses (ZNF91 CRISPRi, n = 6; DNMT1 CRISPR-cut, n = 2; ZNF91DNMT1 double CRISPRi, n = 2). b, Left, genome browser tracks showing HORMAD1 expression and H3K4me3 in ZNF91 CRISPRi, DNMT1 KO and ZNF91DNMT1 double CRISPRi. Right, bar plots showing normalized mean expression of HORMAD1 in ZNF91 CRISPRi, DNMT1 KO and ZNF91DNMT1 double CRISPRi (n = 4). The adjusted P value (Benjamini–Hochberg correction) was calculated by DESeq2 (Wald test, two-sided). Error bars show the s.e.m. c, Left, genome browser tracks showing TAF1 intron 32 expression in ZNF91 CRISPRi, DNMT1 KO and ZNF91DNMT1 double CRISPRi. Right, bar plots showing normalized mean expression of TAF1 intron 32 in ZNF91 CRISPRi, DNMT1 KO and ZNF91DNMT1 double CRISPRi (n = 4). The XDP SVA is depicted in red. The adjusted P value (Benjamini–Hochberg correction) was calculated by DESeq2 (Wald test, two-sided). Error bars show the s.e.m. d, Bar plots showing normalized mean expression of TAF1 exon 38 in ZNF91 CRISPRi, DNMT1 CRISPR-cut and ZNF91DNMT1 double CRISPRi (n = 4). The adjusted P value (Benjamini–Hochberg correction) was calculated by DESeq2 (Wald test, two-sided). Error bars show the s.e.m.
Fig. 6
Fig. 6. Polymorphic SVA insertions are repressed by DNA methylation and H3K9me3.
a, Schematic of ONT sequencing and annotation of polymorphic SVAs. b, Venn diagram showing annotated polymorphic SVA insertions. c, Left, genome browser tracks showing gene expression, H3K9me3 and H3K4me3 over a polymorphic SVA insertion and the nearby gene SLC12A6. Right, ONT sequencing data showing DNA methylation over the annotated polymorphic insertion. d, Left, genome browser tracks showing gene expression, H3K9me3 and H3K4me3 over a polymorphic SVA insertion and the nearby gene GABPA. Right, ONT sequencing data showing DNA methylation over the annotated polymorphic insertion.
Extended Data Fig. 1
Extended Data Fig. 1. The XDP-NPCs display NPC morphology and expression of NPC markers.
a, Brightfield images of XDP-NPCs and Ctrl-NPCs (left). Immunostainings (right) of Sox2 (green) and Nestin (red) in XDP-NPCs and Ctrl-NPCs. b, Genome browser tracks showing RNA-seq, H3K9me3 and H3K4me3 in the TAF1 gene in CRISPRi-Ctrl, ZNF91-CRISPRi, and ZNF91&DNMT1-CRISPRi conditions in CNPC1 and XNPC1. The reads were mapped to the custom genome, where the XDP-SVA is inserted (See Methods). The XDP-SVA is depicted in red.
Extended Data Fig. 2
Extended Data Fig. 2. ZNF91 and TRIM28 orchestrate H3K9me3 deposition over SVAs in NPCs.
a, Heatmap showing igG and H3K9me3 enrichment in Ctrl-NPCs and XDP-NPCs. The genomic regions spanning ±10 kbp from the peak center are displayed. b, Genome browser tracks showing H3K9me3 signal over a region known to be covered by H3K9me3 as a positive control. Tracks are shown for Ctrl-NPC and XDP-NPC for H3K9me3 and igG in control, TRIM28, and ZNF91-CRISPRi. c, Barplots showing igG and H3K9me3 coverage over a positive-control region using CUT&RUN qPCR in Ctrl-NPC and XDP-NPC (n = 1). d, Barplots showing the enrichment of H3K9me3 over the XDP-SVA in XDP-NPCs (n = 4) and the lack of enrichment in Ctrl-NPCs (n = 4, two tailed t-test). A second set of primer pairs were used for this analysis. Bars show H3K9me3 enrichment in each replicate, error bars represent standard deviation. e, Barplots comparing ZNF611 and ZNF91 expression levels in bulk RNA-seq (n = 12) (top). Bars show the normalized mean expression of the group. UMAP representing ZNF611 expression (bottom) in different cell types in the fetal brain (n = 3) f, Barplots showing normalized mean expression of ZNF91 (RNA-seq) in CRISPRi-Ctrl and ZNF91-CRISPRi (n = 4). Padj (BH corrected) as calculated by DESeq2 (Wald test, two-sided). Error bars show the standard error of the mean. g, Heatmaps showing H3K9me3 signal around SVAs in CRISPRi-Ctrl and ZNF91-CRISPRi (n = 2). h, Barplots showing the effect of ZNF91-CRISPRi on H3K9me3 over the XDP SVA in XDP-NPC and Ctrl-NPC (n = 4 in each group, two tailed t-test). A second set of primer pairs were used for this analysis. Bars show H3K9me3 enrichment in each replicate, error bars represent standard deviation. i, Barplots showing normalized mean expression of TRIM28 (RNA-seq) in CRISPRi-Ctrl and TRIM28-CRISPRi in Ctrl-NPC and XDP-NPC (n = 4) Padj (BH corrected) as calculated by DESeq2 (Wald test, two-sided). Error bars show the standard error of the mean. j, Heatmaps showing H3K9me3 signal around SVAs in CRISPRi-Ctrl and TRIM28-CRISPRi (n = 4). When padj = 0e + 00, it is lower than the computational limit. k, Barplots showing the H3K9me3 status of the XDP SVA in CRISPRi-Ctrl and TRIM28-CRISPRi (n = 1). Source data
Extended Data Fig. 3
Extended Data Fig. 3. DNMT1 does not regulate H3K9me3.
a, Methylation coverage over the TAF1 locus in healthy and XDP-NPCs. b, Fluorescent 5mC immunostaining shows successful DNMT1-KO in XNPC1 10 days post transduction. Blue = Dapi, red = 5mC. c, Heatmap showing H3K9me3 around SVAs in a genome-wide scale in Ctrl and DNMT1-KO NPCs. d, Heatmap showing H3K4me3 enrichment in control and ZNF91&DNMT1-CRISPRi in NPCs. Genomic regions spanning ±10 kbp upstream and downstream of the element are shown. e, Bar graphs showing the effect of ZNF91&DNMT1-CRISPRi on H3K4me3 over the XDP SVA in XDP-NPC and Ctrl-NPCs (n = 2 in each group). Source data
Extended Data Fig. 4
Extended Data Fig. 4. ZNF91 independent SVA regulation.
a, Polymorphic SVA loci near GABPA. Genome browser tracks (top) showing gene expression, H3K9me3 and H3K4me3. ONT reads (bottom) showing SVA DNA methylation.

Similar articles

Cited by

References

    1. Lander, E. S. et al. Initial sequencing and analysis of the human genome. Nature409, 860–921 (2001). - PubMed
    1. de Koning, A. P., Gu, W., Castoe, T. A., Batzer, M. A. & Pollock, D. D. Repetitive elements may comprise over two-thirds of the human genome. PLoS Genet.7, e1002384 (2011). - PMC - PubMed
    1. Nurk, S. et al. The complete sequence of a human genome. Science376, 44–53 (2022). - PMC - PubMed
    1. Ostertag, E. M., Goodier, J. L., Zhang, Y. & Kazazian, H. H. SVA elements are nonautonomous retrotransposons that cause disease in humans. Am. J. Hum. Genet.73, 1444–1451 (2003). - PMC - PubMed
    1. Wang, H. et al. SVA elements: a hominid-specific retroposon family. J. Mol. Biol.354, 994–1007 (2005). - PubMed

MeSH terms

LinkOut - more resources