

A novel score for predicting falls in community-dwelling older people: a derivation and validation study
- PMID: 38834944
- PMCID: PMC11151514
- DOI: 10.1186/s12877-024-05064-4
A novel score for predicting falls in community-dwelling older people: a derivation and validation study
Abstract
Background: Early detection of patients at risk of falling is crucial. This study was designed to develop and internally validate a novel risk score to classify patients at risk of falls.
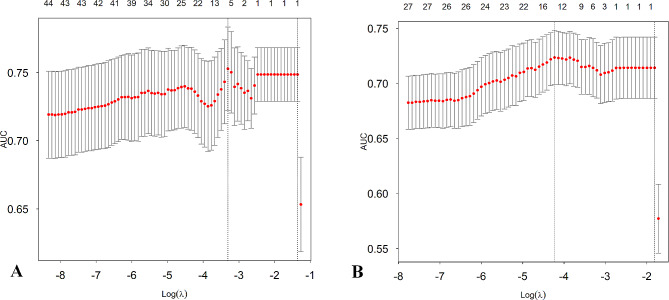
Methods: A total of 334 older people from a fall clinic in a medical center were selected. Least absolute shrinkage and selection operator (LASSO) regression was used to minimize the potential concatenation of variables measured from the same patient and the overfitting of variables. A logistic regression model for 1-year fall prediction was developed for the entire dataset using newly identified relevant variables. Model performance was evaluated using the bootstrap method, which included measures of overall predictive performance, discrimination, and calibration. To streamline the assessment process, a scoring system for predicting 1-year fall risk was created.
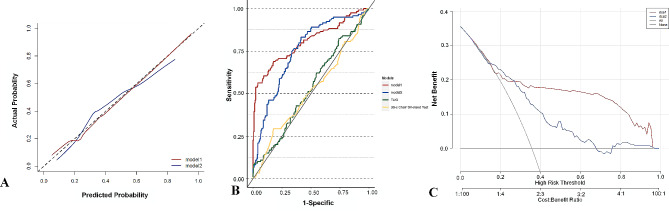
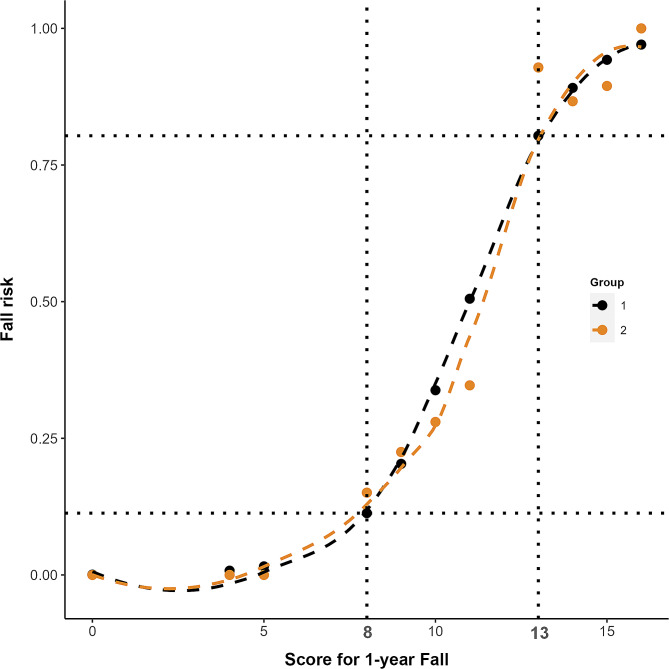
Results: We developed a new model for predicting 1-year falls, which included the FRQ-Q1, FRQ-Q3, and single-leg standing time (left foot). After internal validation, the model showed good discrimination (C statistic, 0.803 [95% CI 0.749-0.857]) and overall accuracy (Brier score, 0.146). Compared to another model that used the total FRQ score instead, the new model showed better continuous net reclassification improvement (NRI) [0.468 (0.314-0.622), P < 0.01], categorical NRI [0.507 (0.291-0.724), P < 0.01; cutoff: 0.200-0.800], and integrated discrimination [0.205 (0.147-0.262), P < 0.01]. The variables in the new model were subsequently incorporated into a risk score. The discriminatory ability of the scoring system was similar (C statistic, 0.809; 95% CI, 0.756-0.861; optimism-corrected C statistic, 0.808) to that of the logistic regression model at internal bootstrap validation.
Conclusions: This study resulted in the development and internal verification of a scoring system to classify 334 patients at risk for falls. The newly developed score demonstrated greater accuracy in predicting falls in elderly people than did the Timed Up and Go test and the 30-Second Chair Sit-Stand test. Additionally, the scale demonstrated superior clinical validity for identifying fall risk.
Keywords: Accidental falls; Fall prediction; Older adults; Risk assessment.
© 2024. The Author(s).
Conflict of interest statement
The authors declare no competing interests.
Figures

Similar articles
-
Development and validation of a robotic multifactorial fall-risk predictive model: A one-year prospective study in community-dwelling older adults.PLoS One. 2020 Jun 25;15(6):e0234904. doi: 10.1371/journal.pone.0234904. eCollection 2020. PLoS One. 2020. PMID: 32584912 Free PMC article.
-
Validation of a clinical prediction model for falls in community-dwelling older adults with COPD: A preliminary analysis.Chron Respir Dis. 2025 Jan-Dec;22:14799731251321494. doi: 10.1177/14799731251321494. Chron Respir Dis. 2025. PMID: 39957244 Free PMC article.
-
Laboratory frailty index improves prediction of in-hospital falls among older adults.Aging Clin Exp Res. 2025 Jun 5;37(1):179. doi: 10.1007/s40520-025-03090-9. Aging Clin Exp Res. 2025. PMID: 40471425 Free PMC article.
-
Functional Reach Test, Single-Leg Stance Test, and Tinetti Performance-Oriented Mobility Assessment for the Prediction of Falls in Older Adults: A Systematic Review.Phys Ther. 2021 Oct 1;101(10):pzab173. doi: 10.1093/ptj/pzab173. Phys Ther. 2021. PMID: 34244801
-
A systematic review of fall prediction models for community-dwelling older adults: comparison between models based on research cohorts and models based on routinely collected data.Age Ageing. 2024 Jul 2;53(7):afae131. doi: 10.1093/ageing/afae131. Age Ageing. 2024. PMID: 38979796 Free PMC article.
References
-
- Stuckenschneider T, Koschate J, Dunker E, Reeck N, Hackbarth M, Hellmers S, et al. Sentinel fall presenting to the emergency department (SeFallED) - protocol of a complex study including long-term observation of functional trajectories after a fall, exploration of specific fall risk factors, and patients’ views on falls prevention. BMC Geriatr. 2022;22(1):594. doi: 10.1186/s12877-022-03261-7. - DOI - PMC - PubMed
Publication types
MeSH terms
Grants and funding
LinkOut - more resources
Full Text Sources
Medical
