. 2024 Jun 4;17(1):247.
doi: 10.1186/s13071-024-06240-6.

The opposing effect of acute and chronic Toxoplasma gondii infection on tumor development

Affiliations

The opposing effect of acute and chronic Toxoplasma gondii infection on tumor development

Yining Song et al. Parasit Vectors. .

Abstract

Background: The interplay between Toxoplasma gondii infection and tumor development is intriguing and not yet fully understood. Some studies showed that T. gondii reversed tumor immune suppression, while some reported the opposite, stating that T. gondii infection promoted tumor growth.

Methods: We created three mouse models to investigate the interplay between T. gondii and tumor. Model I aimed to study the effect of tumor growth on T. gondii infection by measuring cyst number and size. Models II and III were used to investigate the effect of different stages of T. gondii infection on tumor development via flow cytometry and bioluminescent imaging. Mouse strains (Kunming, BALB/c, and C57BL/6J) with varying susceptibilities to tumors were used in the study.

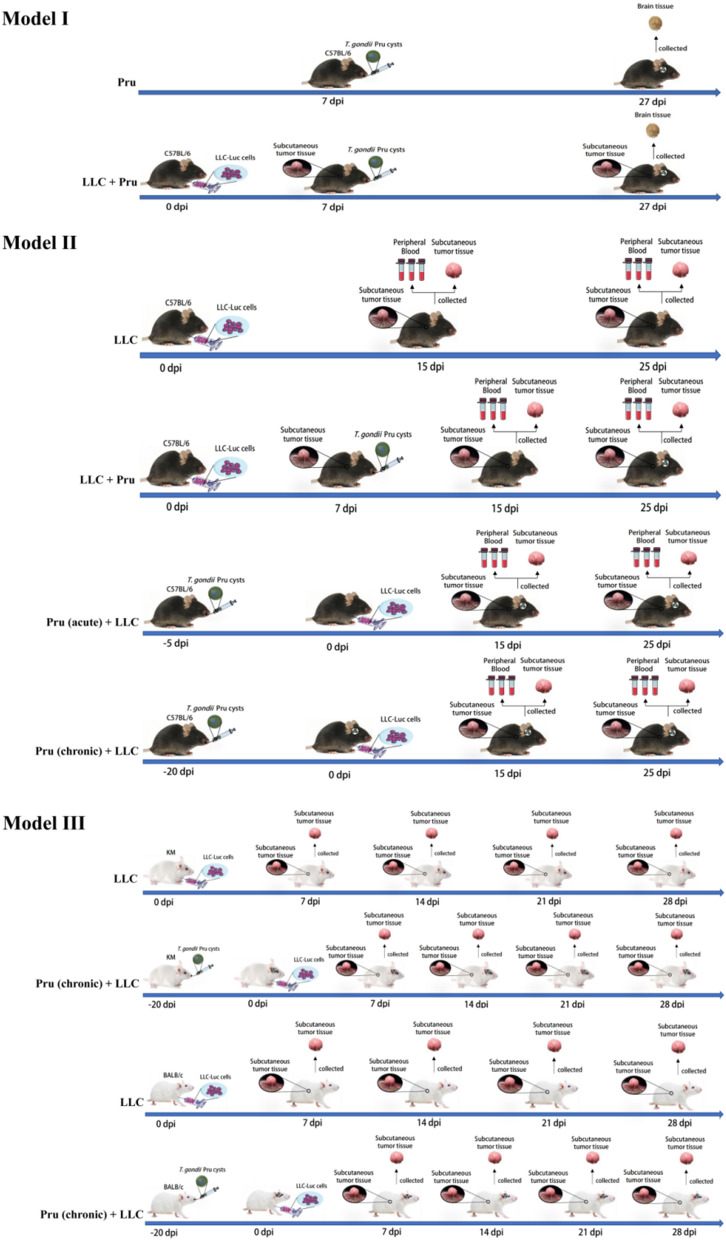
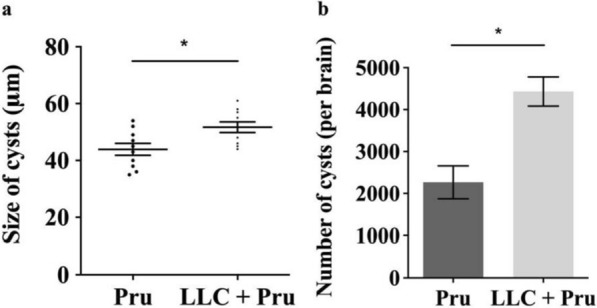
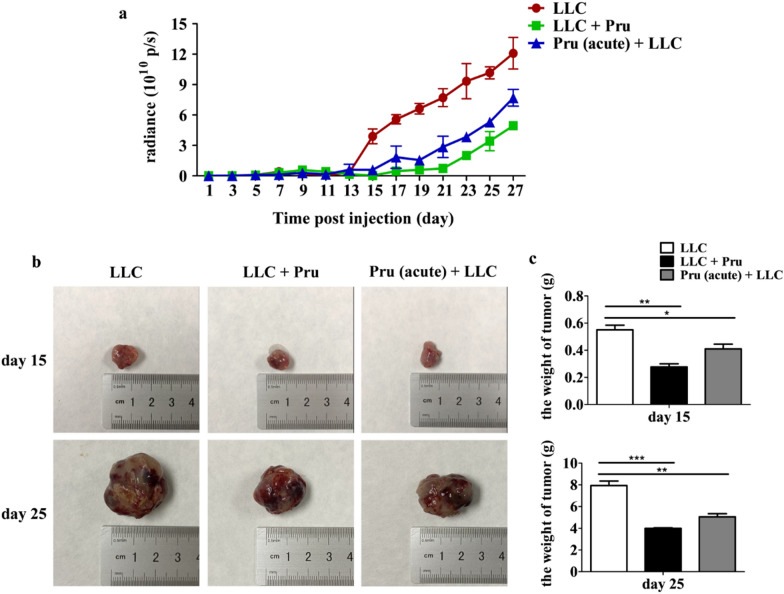
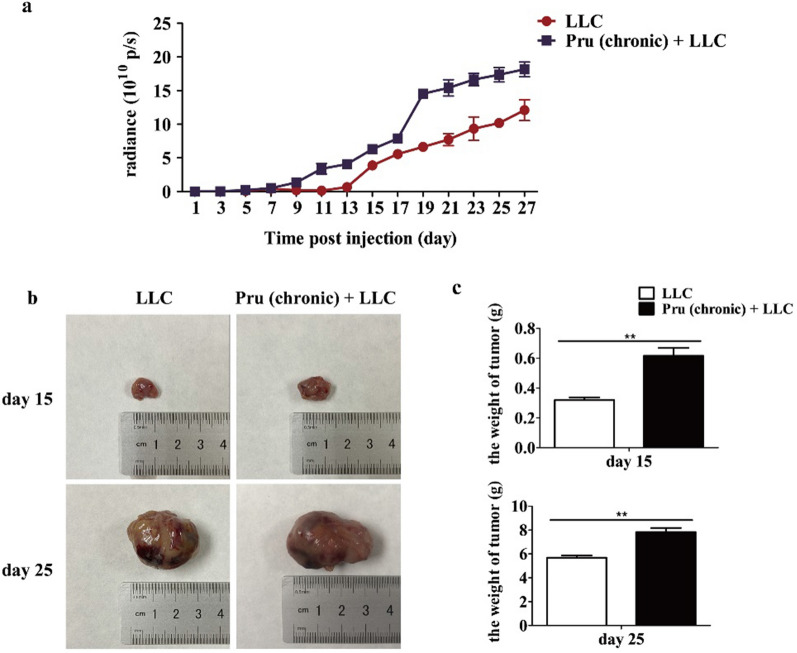
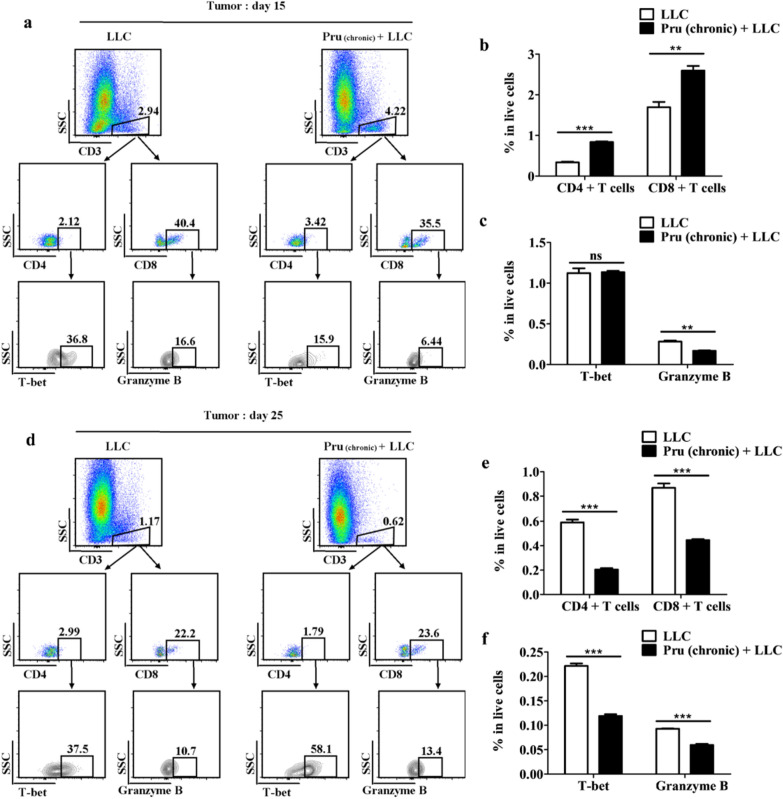
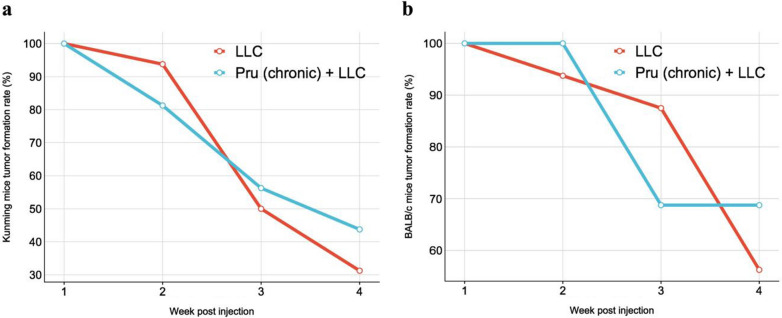
Results: The size and number of brain cysts in the tumor-infected group were significantly higher, indicating that tumor presence promotes T. gondii growth in the brain. Acute T. gondii infection, before or after tumor cell introduction, decreased tumor growth manifested by reduced bioluminescent signal and tumor size and weight. In the tumor microenvironment, CD4+ and CD8+ T cell number, including their subpopulations (cytotoxic CD8+ T cells and Th1 cells) had a time-dependent increase in the group with acute T. gondii infection compared with the group without infection. However, in the peripheral blood, the increase of T cells, including cytotoxic CD8+ T cells and Th1 cells, persisted 25 days after Lewis lung carcinoma (LLC) cell injection in the group with acute T. gondii. Chronic T. gondii infection enhanced tumor growth as reflected by increase in tumor size and weight. The LLC group with chronic T. gondii infection exhibited decreased percentages of cytotoxic CD8+ T cells and Th1 cells 25 days post-LLC injection as compared with the LLC group without T. gondii infection. At week 4 post-LLC injection, chronic T. gondii infection increased tumor formation rate [odds ratio (OR) 1.71] in both KM and BALB/c mice.

Conclusions: Our research elucidates the dynamics between T. gondii infection and tumorigenesis. Tumor-induced immune suppression promoted T. gondii replication in the brain. Acute and chronic T. gondii infection had opposing effects on tumor development.

Keywords: Toxoplasma gondii; Acute and chronic toxoplasmosis; Lewis lung carcinoma; Mice; Tumor.


Conflict of interest statement

The authors declare that the research was conducted in the absence of any commercial or financial relationships that could be construed as a potential conflict of interest.

Figures

Fig. 1
Fig. 1
Schematic of the experimental setup for models I, II, and III. Model I was designed to investigate the effect of tumor growth on T. gondii infection. For model I, the size and number of cysts were measured. Model II was used for bioluminescence imaging and flow-cytometry analysis to investigate the effect of different stages of T. gondii infection on tumor growth. Model III was designed to study the effect of chronic T. gondii infection on tumor development in different mouse strains, namely KM mice and BALB/c mice. The day of LLC injection was set as day 0 post-injection (0 dpi)
Fig. 2
Fig. 2
Tumor growth promotes the replication of T. gondii (model I). a Average size in diameter of brain cysts from mice in Pru and LLC + Pru groups 20 days post-T. gondii infection. b Number of cysts per brain in Pru and LLC + Pru groups 20 days post-T. gondii infection. Data are shown as mean ± SD (*P < 0.05)
Fig. 3
Fig. 3
Acute infection of T.  gondii inhibits tumor growth (model II). a Luminescence intensity from bioluminescence imaging of live mice injected with LLC-Luc cells. b Tumor photos were taken from mice 15 days and 25 days post-injection of LLC-Luc cells. c Tumor weight was measured 15 days and 25 days post-injection of LLC-Luc cells. Data are shown as mean ± SD (*P < 0.05, **P < 0.01, ***P < 0.001)
Fig. 4
Fig. 4
Acute T. gondii infection induces time-dependent reversal of the immunosuppression in TME (model II). a, d Gating scheme for the selection of Th1 cells and cytotoxic CD8+ T cells from the tumor samples collected 15 days and 25 days post-LLC-Luc injection. b, e Percentages of CD4+ and CD8+ T cells 15 days and 25 days post-injection. c, f Percentages of Th1 cells and cytotoxic CD8+ T cells 15 days and 25 days post-injection. Data are shown as mean ± SD (*P < 0.05, **P < 0.01, ***P < 0.001)
Fig. 5
Fig. 5
Chronic infection of T. gondii promotes tumor growth (model II). a Bioluminescence imaging to monitor tumor cell growth. Data were recorded every other day from day 1 to day 27 post-LLC injection. b Tumor photos were taken 15 days and 25 days post-injection of LLC. c Tumor weight was measured 15 days and 25 days following LLC inoculation. Data are represented as means ± SD (**P < 0.01)
Fig. 6
Fig. 6
Chronic infection of T. gondii-enhanced TME immunosuppression (model II). a, d Gating schemes for the selection of CD4+ and CD8+ T cells as well as Th1 cells and cytotoxic CD8+ T cells from tumor samples. b, e Percentages of CD4+ and CD8+ T cells in the tumor microenvironment. c, f Percentages of Th1 cells and cytotoxic CD8+ T cells in the tumor microenvironment. Data are denoted as mean ± SD (**P < 0.01, ***P < 0.001)
Fig. 7
Fig. 7
The rate of tumor development in the infected mice (model III). a Tumor formation rate in KM mice from week 1 to week 4 after LLC-Luc inoculation. b Tumor formation rate in BALB/c mice from week 1 to week 4 after injection of LLC-Luc
None

References

    1. Pappas G, Roussos N, Falagas ME. Toxoplasmosis snapshots: global status of Toxoplasma gondii seroprevalence and implications for pregnancy and congenital toxoplasmosis. Int J Parasitol. 2009;39:1385–1394. doi: 10.1016/j.ijpara.2009.04.003. - DOI - PubMed
    1. Wang L, He LY, Meng DD, Chen ZW, Wen H, Fang GS, Luo QL, Huang KQ, Shen JL. Seroprevalence and genetic characterization of Toxoplasma gondii in cancer patients in Anhui Province, Eastern China. Parasit Vectors. 2015;8:162. doi: 10.1186/s13071-015-0778-5. - DOI - PMC - PubMed
    1. Anand N, Lutshumba J, Whitlow M, Abdelaziz MH, Mani R, Suzuki Y. Deficiency in indoleamine-2,3-dioxygenase induces upregulation of guanylate binding protein 1 and inducible nitric oxide synthase expression in the brain during cerebral infection with Toxoplasma gondii in genetically resistant BALB/c mice but not in genetically susceptible C57BL/6 mice. Microbes Infect. 2022;24:104908. doi: 10.1016/j.micinf.2021.104908. - DOI - PMC - PubMed
    1. Yang YL, Liu L, Wang Y, Wu H, Yang XS, Wang JN, Wang L. The prevalence of depression and anxiety among Chinese adults with cancer: a systematic review and meta-analysis. BMC Cancer. 2013;13:393. doi: 10.1186/1471-2407-13-393. - DOI - PMC - PubMed
    1. Torre LA, Bray F, Siegel RL, Ferlay J, Lortet-Tieulent J, Jemal A. Global cancer statistics, 2012. CA Cancer J Clin. 2015;65:87–108. doi: 10.3322/caac.21262. - DOI - PubMed