

The epidemiology of drug-related hospital admissions in paediatrics - a systematic review
- PMID: 38835105
- PMCID: PMC11149243
- DOI: 10.1186/s13690-024-01295-4
The epidemiology of drug-related hospital admissions in paediatrics - a systematic review
Abstract
Background: Despite previous efforts, medication safety in paediatrics remains a major concern. To inform improvement strategies and further research especially in outpatient care, we systematically reviewed the literature on the frequency and nature of drug-related hospital admissions in children.
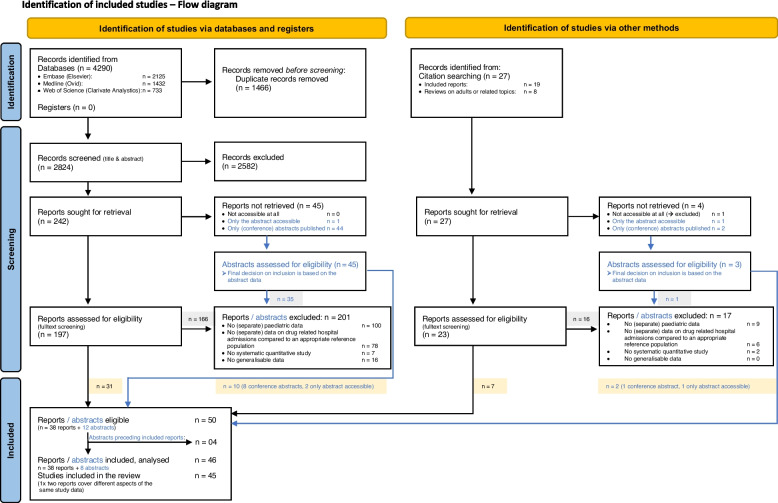
Methods: Searches covered Embase, Medline, Web of Science, grey literature sources and relevant article citations. Studies reporting epidemiological data on paediatric drug-related hospital admissions published between 01/2000 and 01/2024 were eligible. Study identification, data extraction, and critical appraisal were conducted independently in duplicate using templates based on the 'Joanna Briggs Institute' recommendations.
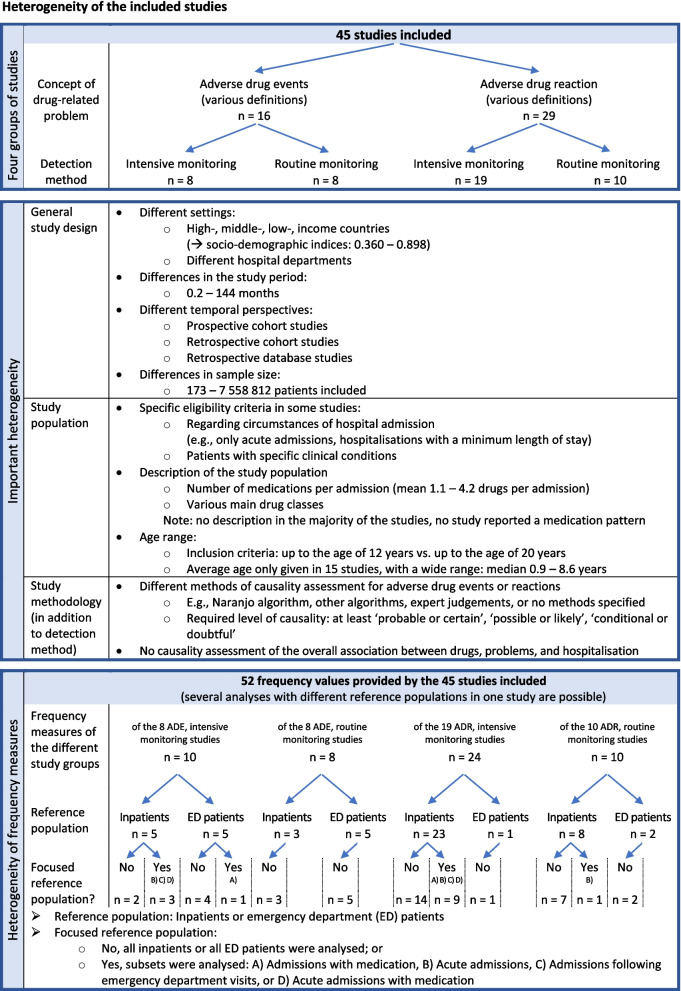
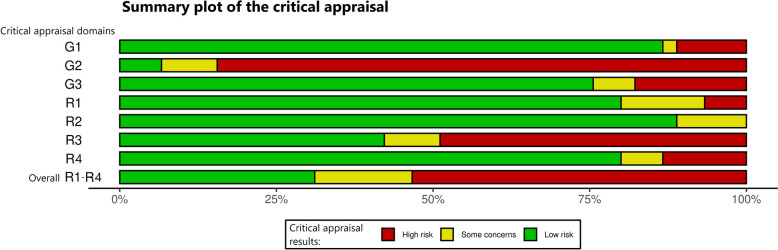
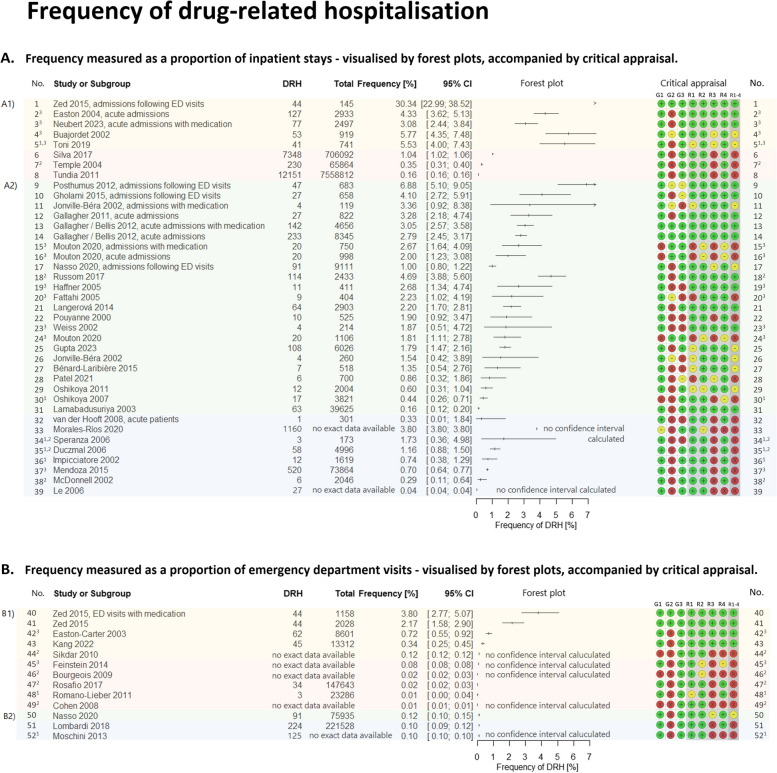
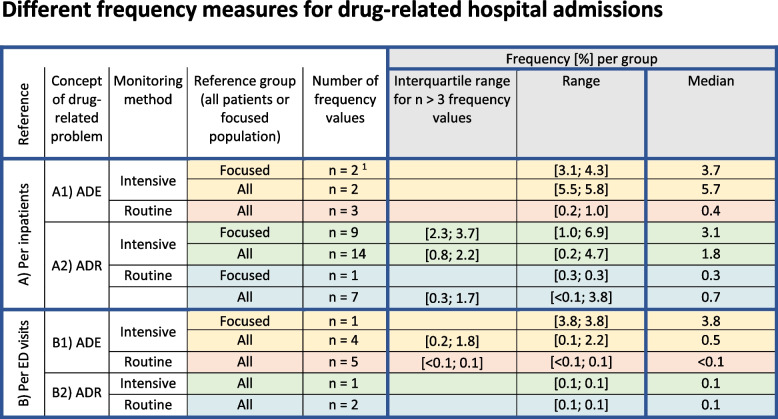
Results: The review included data from 45 studies reporting > 24,000 hospitalisations for adverse drug events (ADEs) or adverse drug reactions (ADRs). Due to different reference groups, a total of 52 relative frequency values were provided. We stratified these results by study characteristics. As a percentage of inpatients, the highest frequency of drug-related hospitalisation was found with 'intensive ADE monitoring', ranging from 3.1% to 5.8% (5 values), whereas with 'routine ADE monitoring', it ranged from 0.2% to 1.0% (3 values). The relative frequencies of 'ADR-related hospitalisations' ranged from 0.2% to 6.9% for 'intensive monitoring' (23 values) and from 0.04% to 3.8% for 'routine monitoring' (8 values). Per emergency department visits, five relative frequency values ranged from 0.1% to 3.8% in studies with 'intensive ADE monitoring', while all other eight values were ≤ 0.1%. Heterogeneity prevented pooled estimates. Studies rarely reported on the nature of the problems, or studies with broader objectives lacked disaggregated data. Limited data indicated that one in three (median) drug-related admissions could have been prevented, especially by more attentive prescribing. Besides polypharmacy and oncological therapy, no other risk factors could be clearly identified. Insufficient information and a high risk of bias, especially in retrospective and routine observational studies, hampered the assessment.
Conclusion: Given the high frequency of drug-related hospitalisations, medication safety in paediatrics needs to be further improved. As routine identification appears unreliable, clinical awareness needs to be raised. To gain more profound insights especially for generating improvement strategies, we have to address under-reporting and methodological issues in future research.
Trial registration: PROSPERO (CRD42021296986).
Keywords: Adverse drug events; Adverse drug reactions; Children; Drug-related hospitalisations; Drug-related problems; Hospital admissions; Hospitalisation; Medication safety; Paediatric.
© 2024. The Author(s).
Conflict of interest statement
The authors declare no competing interests.
Figures
Similar articles
-
The future of Cochrane Neonatal.Early Hum Dev. 2020 Nov;150:105191. doi: 10.1016/j.earlhumdev.2020.105191. Epub 2020 Sep 12. Early Hum Dev. 2020. PMID: 33036834
-
Which Adverse Events and Which Drugs Are Implicated in Drug-Related Hospital Admissions? A Systematic Review and Meta-Analysis.J Clin Med. 2023 Feb 7;12(4):1320. doi: 10.3390/jcm12041320. J Clin Med. 2023. PMID: 36835854 Free PMC article.
-
Beyond the black stump: rapid reviews of health research issues affecting regional, rural and remote Australia.Med J Aust. 2020 Dec;213 Suppl 11:S3-S32.e1. doi: 10.5694/mja2.50881. Med J Aust. 2020. PMID: 33314144
-
Caseworker-assigned discharge plans to prevent hospital readmission for acute exacerbations in children with chronic respiratory illness.Cochrane Database Syst Rev. 2018 Nov 2;11(11):CD012315. doi: 10.1002/14651858.CD012315.pub2. Cochrane Database Syst Rev. 2018. PMID: 30387126 Free PMC article.
-
Reducing unplanned hospital admissions from care homes: a systematic review.Health Soc Care Deliv Res. 2023 Oct;11(18):1-130. doi: 10.3310/KLPW6338. Health Soc Care Deliv Res. 2023. PMID: 37916580
References
-
- WHO. Role of policy-makers and health care leaders in implementation of the Global Patient Safety Action Plan 2021–2030. 2022. https://www.who.int/publications/i/item/WHO-UHL-IHS-PSF-2022.3. Accessed 27 July 2022.
-
- World Health Organization. Global Patient Safety Action Plan 2021–2030 towards eliminating avoidable harm in health care. World Health Organization; 2022. https://apps.who.int/iris/handle/10665/354489. Accessed 27 July 2022.
-
- World Health Organization. Patient-Safety: WHO-fact-sheet. Patient Safety Fact sheets. 2019. https://www.who.int/news-room/fact-sheets/detail/patient-safety. Accessed 27 July 2022.
Publication types
LinkOut - more resources
Full Text Sources
Research Materials
