. 2024 Jul 31;36(8):2908-2926.
doi: 10.1093/plcell/koae149.

The m6A reader ECT8 is an abiotic stress sensor that accelerates mRNA decay in Arabidopsis

Affiliations

The m6A reader ECT8 is an abiotic stress sensor that accelerates mRNA decay in Arabidopsis

Zhihe Cai et al. Plant Cell. .

Abstract

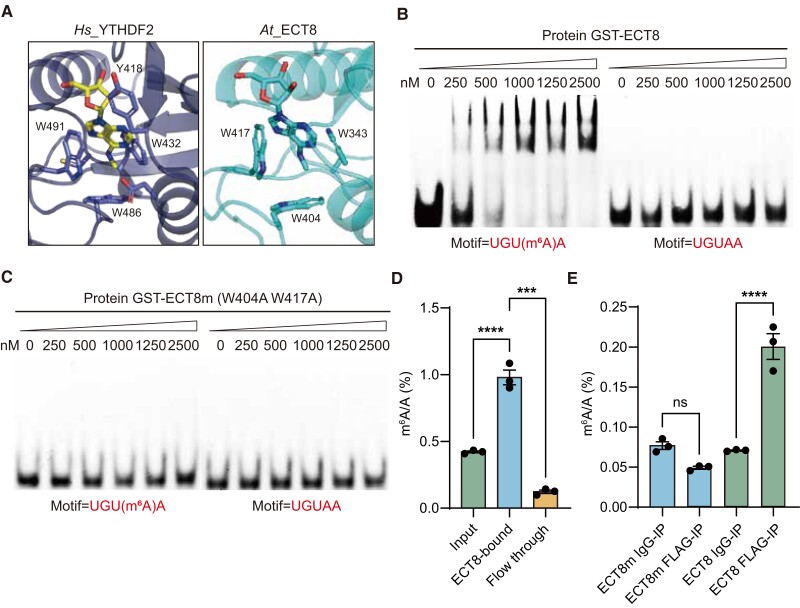
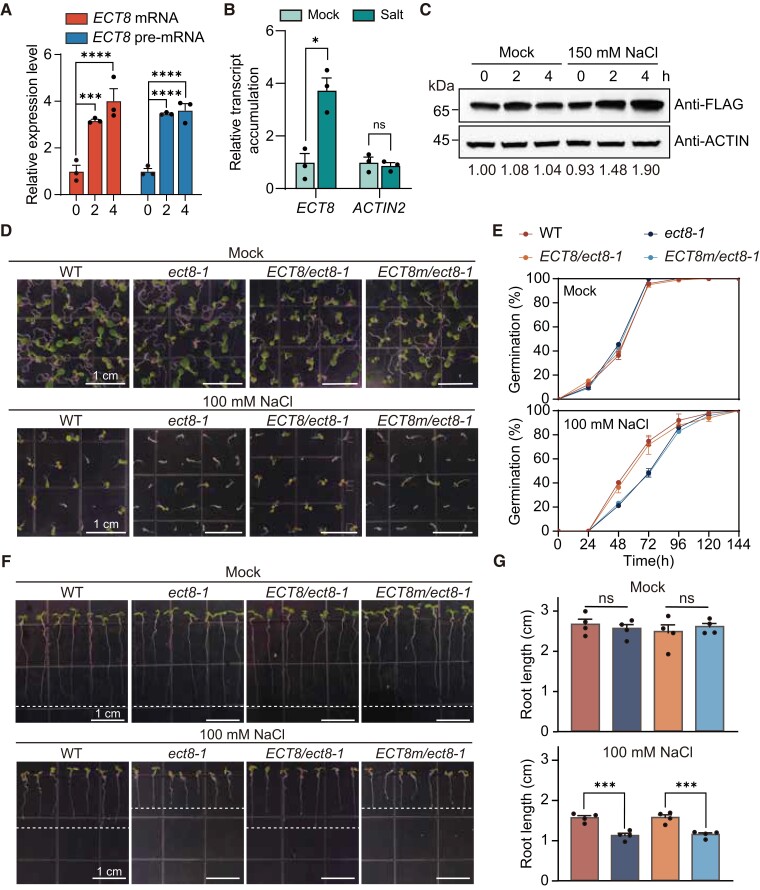
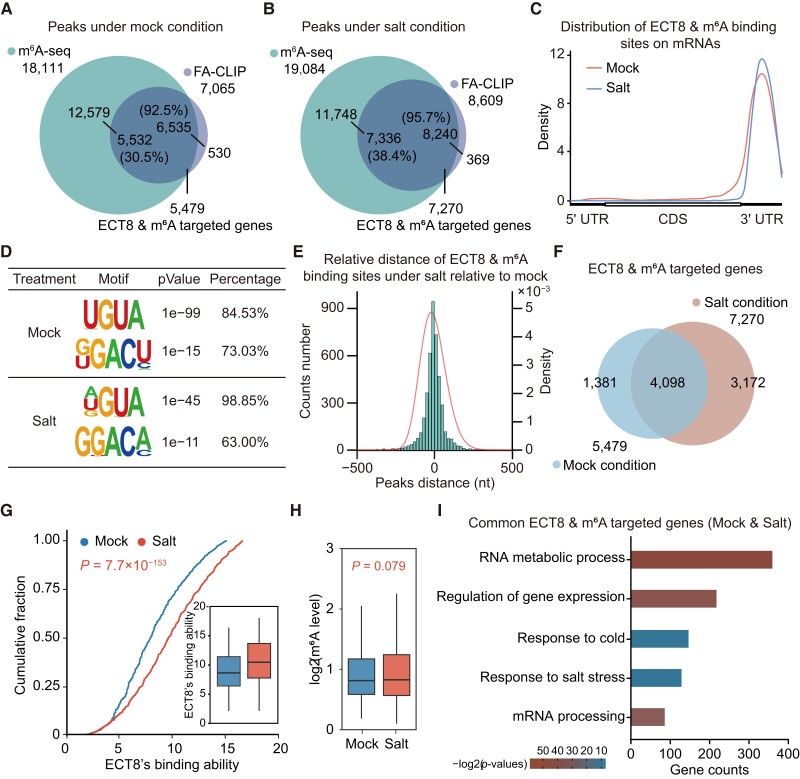
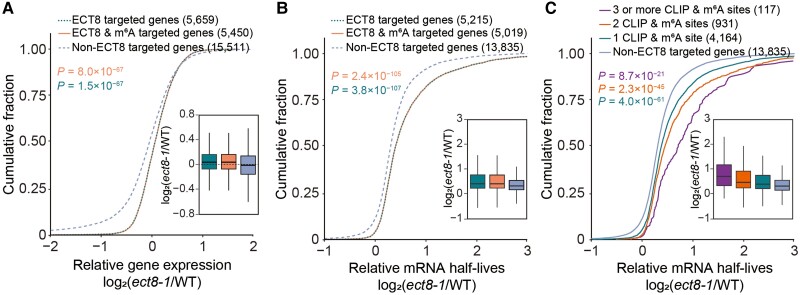
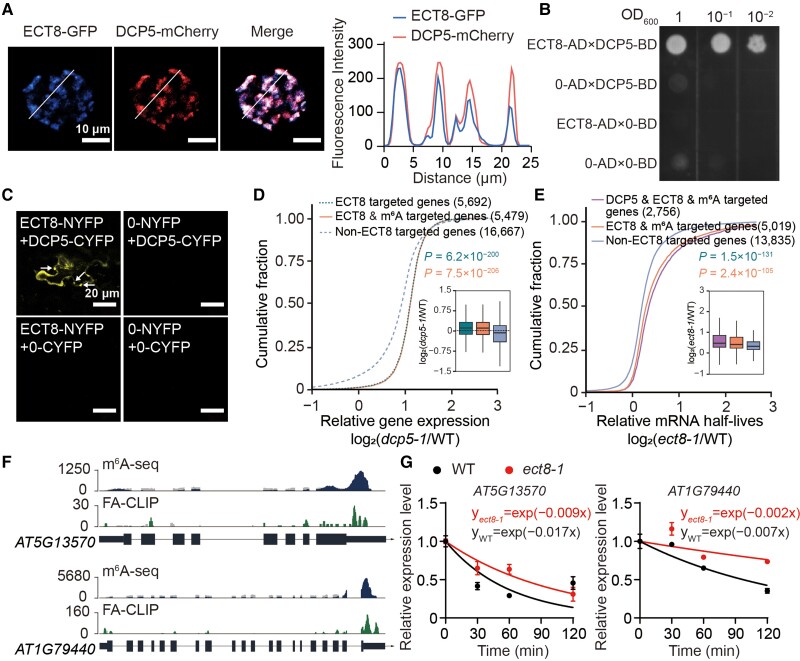
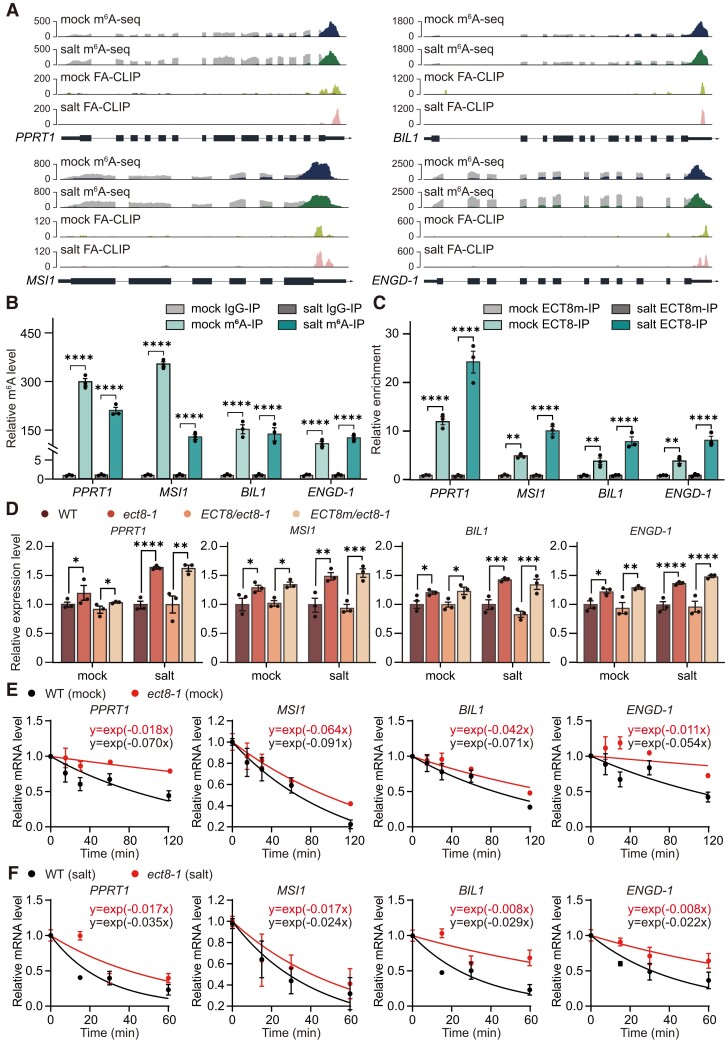
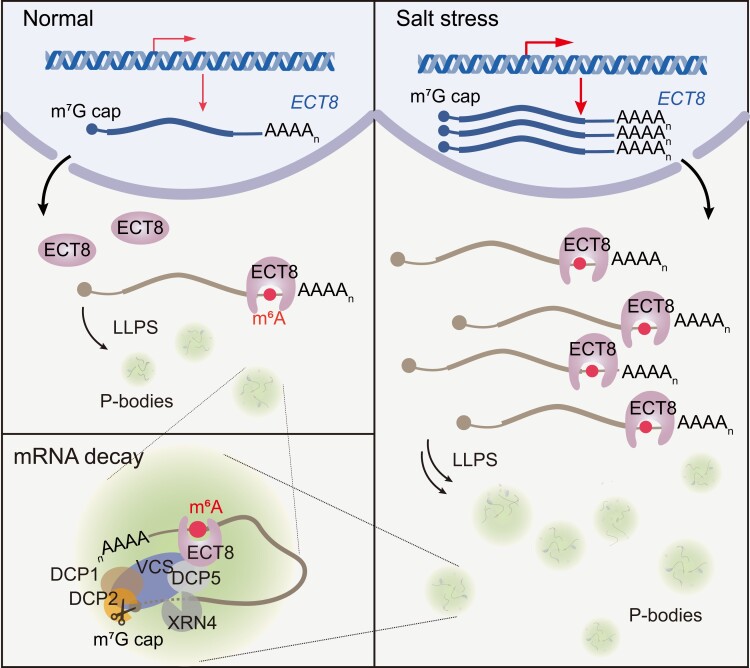
N 6-methyladenosine (m6A) is the most abundant mRNA modification and plays diverse roles in eukaryotes, including plants. It regulates various processes, including plant growth, development, and responses to external or internal stress responses. However, the mechanisms underlying how m6A is related to environmental stresses in both mammals and plants remain elusive. Here, we identified EVOLUTIONARILY CONSERVED C-TERMINAL REGION 8 (ECT8) as an m6A reader protein and showed that its m6A-binding capability is required for salt stress responses in Arabidopsis (Arabidopsis thaliana). ECT8 accelerates the degradation of its target transcripts through direct interaction with the decapping protein DECAPPING 5 within processing bodies. We observed a significant increase in the ECT8 expression level under various environmental stresses. Using salt stress as a representative stressor, we found that the transcript and protein levels of ECT8 rise in response to salt stress. The increased abundance of ECT8 protein results in the enhanced binding capability to m6A-modified mRNAs, thereby accelerating their degradation, especially those of negative regulators of salt stress responses. Our results demonstrated that ECT8 acts as an abiotic stress sensor, facilitating mRNA decay, which is vital for maintaining transcriptome homeostasis and enhancing stress tolerance in plants. Our findings not only advance the understanding of epitranscriptomic gene regulation but also offer potential applications for breeding more resilient crops in the face of rapidly changing environmental conditions.


Conflict of interest statement

Conflict of interest statement. The authors declare no conflict of interests.

Figures

Figure 1.
Figure 1.
ECT8 is an m6A-binding protein in Arabidopsis. A) Structure of ECT8 simulated by AlphaFold (AF-Q9FPE7-F1) comparing with the published structure of YTH-YTHDF2 in complex with m6A (PDB: 4RDN). The ligands for binding m6A nucleotide are highlighted. B) EMSA assay showing the binding ability of GST-ECT8 with RNA probe containing m6A-modified UGUAA motif but not with unmethylated probe. Each lane was loaded with varying concentrations (shown below the triangle panel) of protein and a consistent amount of RNA oligo with a final concentration of 4 nM. C) EMSA assay showing abolished binding affinity of GST-ECT8m toward both methylated and unmethylated RNA probe with UGUAA motif. Each lane was loaded with varying concentrations (shown below the triangle panel) of protein and a consistent amount of RNA oligo with a final concentration of 4 nM. D) In vitro RIP-UPLC-MS/MS showing that m6A is enriched in ECT8-bound mRNA compared with input and the flow-through fractions. Data are presented as means ± Se, n = 3 independent experiments, each with 3 technical replicates. ***P < 0.001 and ****P < 0.0001 by 1-way ANOVA. E) In vivo FA-RIP-UPLC-MS/MS showing that m6A is enriched in ECT8-Flag-bound RNA but not in ECT8m-Flag-bound RNA compared with IgG-bound RNA, separately. Data are presented as means ± Se, n = 3 independent experiments, each with 3 technical replicates. ns, not significant and ****P < 0.0001 by 1-way ANOVA.
Figure 2.
Figure 2.
ECT8 is required for salt stress response in an m6A-dependent manner. A) RT-qPCR for the increase expression level of ECT8 mRNA and unspliced immature transcripts (pre-mRNA) during salt stress over time. TUB8 was used as negative control. Data are presented as means ± Se, n = 3 independent experiments, each with 3 technical replicates. ***P < 0.001, ****P < 0.0001 by 2-way ANOVA. B) Nuclear run-on assay indicating that the transcription rate of ECT8 is highly increased after 4 h NaCl treatment. ACTIN2 was used as negative control. Data are presented as means ± Se, n = 3 independent experiments, each with 3 technical replicates. ns, not significant, and *P < 0.05 by 2-way ANOVA. C) Protein immunoblot showing the relative expression level of ECT8 protein under mock and 150 mM salt treatment over time. ACTIN was used for loading control. kDa, kilodalton. D) Phenotypic analysis of salt response among WT, ect8-1, ECT8/ect8-1, and ECT8m/ect8-1 plants under mock control and 100 mM NaCl treatments. Representative images showing the morphology of 7-d-old seedlings. WT, wild-type. The scale bar is shown as white lines. E) Statistical analysis of germination rates in WT, ect8-1, ECT8/ect8-1, and ECT8m/ect8-1 plants under mock control and 100 mM NaCl treatment. WT, wild-type. Data are presented as means ± Se, n = 4 independent experiments, each with at least 35 seedlings. F) Phenotypic analysis of root length in WT, ect8-1, ECT8/ect8-1, and ECT8m/ect8-1 plants under mock control and 100 mM NaCl treatments. The 3-d-old seedlings grown on 1/2 MS plates are transferred to regular 1/2 MS medium and medium supplemented with 100 mM NaCl and cultivated vertically, respectively. Representative images showing the morphology of 7-d-old seedlings. WT, wild-type. The scale bar is shown as white lines. G) Statistical analysis of primary root length in WT, ect8-1, ECT8/ect8-1, and ECT8m/ect8-1 plants under mock control and 100 mM NaCl treatment. WT, wild-type. Data are presented as means ± Se, n = 4 independent experiments, each with at least 10 seedlings. ns, not significant, and ***P < 0.001 by 1-way ANOVA.
Figure 3.
Figure 3.
ECT8 binds to mRNA 3′UTR regions under normal and salt stress conditions. A, B) Overlap between FA-CLIP-identified ECT8-binding sites and m6A peaks under normal A) and salt stress conditions B). C) Metagene profile illustrating the region distribution of ECT8- and m6A-binding sites across the indicated mRNA segments under normal and salt stress conditions. 5′ UTR, 5′ untranslated region; CDS, coding sequence; 3′ UTR, 3′ untranslated region. D) Motifs identified by HOMER software based on the ECT8- and m6A-binding sites under normal and salt stress conditions. E) Distribution of the distance of ECT8- and m6A-binding sites under salt stress compared with those under normal condition. F) Venn plot depicting the overlap of ECT8- and m6A-targeted genes identified in normal and salt conditions. G) Cumulative plot combined boxplot showing the ECT8's binding ability toward 4,098 common ECT8- and m6A-targeted genes under normal and salt conditions. In boxplot, lower and upper hinges represent first and third quartiles, the center line represents the median, and whiskers represent ±1.5× interquartile range. P-values were calculated using Wilcoxon test. H) Boxplot indicating the m6A level of 4,098 common ECT8- and m6A-targeted genes under both conditions. Results have been calibrated with m6A spike-ins to diminish the difference of efficiency during immunoprecipitation in m6A-seq. Lower and upper hinges represent first and third quartiles, the center line represents the median, and whiskers represent ±1.5× interquartile range. P-values were calculated using Wilcoxon test. I) GO analysis of 4,098 common ECT8- and m6A-targeted genes identified in both normal and salt conditions. P-values were calculated from DAVID website (https://david.ncifcrf.gov/).
Figure 4.
Figure 4.
ECT8 facilitates the degradation of m6A-modified mRNAs. A) Cumulative distribution and boxplot of relative mRNA expression of 5,659 ECT8-targeted genes, 5,450 ECT8- and m6A-targeted genes, and 15,511 non-ECT8-targeted genes in ect8-1 compared with WT under mock condition. In boxplot, lower and upper hinges represent first and third quartiles, the center line represents the median, and whiskers represent ±1.5× interquartile range. WT, wild-type. P-values were calculated using Wilcoxon test. B) Cumulative distribution and boxplot of relative mRNA half-lives of 5,215 ECT8-targeted genes, 5,019 ECT8- and m6A-targeted genes, and 13,835 non-ECT8-targeted genes in ect8-1 compared with WT under mock conditions. In boxplot, lower and upper hinges represent first and third quartiles, the center line represents the median, and whiskers represent ±1.5× interquartile range. WT, wild-type. P-values were calculated using Wilcoxon test. C) Cumulative distribution and boxplot of relative mRNA half-lives of ECT8- and m6A-targeted genes with 3 or more binding sites (117), 2 binding sites (931), 1 binding site (4,164), and non-ECT8-targeted genes (13,835) in ect8-1 compared with WT under mock conditions. In boxplot, lower and upper hinges represent first and third quartiles, the center line represents the median, and whiskers represent ±1.5× interquartile range. WT, wild-type. P-values were calculated using Wilcoxon test.
Figure 5.
Figure 5.
ECT8 accelerates the degradation decay of m6A-modified mRNA through direct interaction with DCP5 within P-bodies. A) Confocal microscopy showing the colocalization of ECT8-GFP and DCP5-mCherry in P-bodies from protoplast coexpression experiment. Intensity traces (white lines) are analyzed by ImageJ and plotted at the right. Scale bar = 10 μm. B) Y2H assay showing the physical associations between ECT8 and DCP5 in yeast cells on selective medium without tryptophan, leucine, histidine, and adenine. The full-length CDS of ECT8 and DCP5 were fused with wither the GAL4-AD or BD domain as indicated. AD, the activation domain expressed from pGADT7; BD, the binding domain expressed from pGBKT7. 0-AD, the empty vector of pGADT7; 0-BD, the empty vector of pGBKT7.C) BiFC assay showing the physical associations between ECT8 and DCP5 in N. benthamiana leaf cells. The puncta are highlighted using white arrows. Scale bars = 20 μm. NYFP, N-terminal domain of YFP expressed from pBI121; CYFP, C-terminal domain of YFP expressed from pBI121; 0-NYFP, the empty vector of pBI121-NYFP; 0-CYFP, the empty vector of pBI121-CYFP.D) Cumulative distribution and boxplot of relative expression level of 5,692 ECT8-targeted genes, 5,479 ECT8- and m6A-targeted genes, and 16,667 non-ECT8-targeted genes in dcp5-1 compared with WT under mock conditions. In boxplot, lower and upper hinges represent first and third quartiles, the center line represents the median, and whiskers represent ±1.5× interquartile range. WT, wild-type. P-values were calculated using Wilcoxon test. E) Cumulative distribution and boxplot of relative mRNA half-lives of 2,756 DCP5-, ECT8-, and m6A-targeted genes, 5,019 ECT8- and m6A-targeted genes, and 13,835 non-ECT8-targeted genes in ect8-1 compared with WT under normal condition. In boxplot, lower and upper hinges represent first and third quartiles, the center line represents the median, and whiskers represent ±1.5× interquartile range. WT, wild-type. P-values were calculated using Wilcoxon test. F) Integrative genomics viewer (IGV) showing the m6A-seq and FA-CLIP sequencing results on AT5G13570 and AT1G79440 transcripts. FA-CLIP, formaldehyde crosslinking and immunoprecipitation. G) The RNA half-lives of AT5G13570 and AT1G79440 transcripts in 7-d-old WT and ect8-1 seedlings. External spike-ins were used as internal control. WT, wild-type. Data are presented as means ± Se, n = 2 independent experiments, each with 3 technical replicates.
Figure 6.
Figure 6.
ECT8 amplifies the degradation of the negative salt stress regulators under salt stress condition. A) Integrative genomics viewer showing the sequencing results on PPRT1, MSI1, BIL1, and ENGD-1 transcripts. FA-CLIP, formaldehyde crosslinking and immunoprecipitation. B) m6A-IP-qPCR validation of the m6A enrichment level in PPRT1, MSI1, BIL1, and ENGD-1 in 12-d-old WT seedlings under mock and salt conditions. IgG-IP was used for negative control, and external m6A spike-in was used for calibration. IP, immunoprecipitation. Data are presented as means ± Se, n = 3 independent experiments, each with 3 technical replicates. ****P < 0.0001 by 2-way ANOVA. C) FA-RIP-qPCR validation of the binding affinity of ECT8 toward PPRT1, MSI1, BIL1, and ENGD-1 in 12-d-old ECT8/ect8-1 and ECT8m/ect8-1 seedlings under both mock and salt stress conditions. ECT8m/ect8-1 was used as negative control. AT2G07689 was used as internal control. IP, immunoprecipitation. Data are presented as means ± Se, n = 3 independent experiments, each with 3 technical replicates. **P < 0.01 and ****P < 0.0001 by 2-way ANOVA. D) Relative mRNA expression levels of PPRT1, MSI1, BIL1, and ENGD-1 in 12-d-old WT, ect8-1, ECT8/ect8-1, and ECT8m/ect8-1 seedlings under mock and salt stress. TUB8 was used as the internal control. Data are presented as means ± Se, n = 3 independent experiments, each with 3 technical replicates. *P < 0.05, **P < 0.01, ***P < 0.001, and ****P < 0.0001 by 2-way ANOVA. E, F) The mRNA half-lives of PPRT1, MSI1, BIL1, and ENGD-1 in 7-d-old WT and ect8-1 seedlings under mock E) and salt stress F) conditions. External spike-ins were used as internal control. Data are presented as means ± Se, n = 2 independent experiments, each with 3 technical replicates.
Figure 7.
Figure 7.
A model for ECT8 serves as a salt stress sensor in Arabidopsis. ECT8 functions as an abiotic stress sensor, promoting the degradation of targeted mRNAs in P-bodies by binding to m6A and interacting with the decapping protein DCP5. Using salt stress as an example, the transcription and expression levels of ECT8 are significantly increased. We hypothesize that the increased abundance of ECT8 induced by salt stress recruits more m6A-modified mRNAs to enter more P-bodies for the degradation of ECT8-bound mRNAs, including negative regulators of salt stress response, ultimately enhancing salt stress tolerance. LLPS, liquid–liquid phase separation; P-bodies, processing bodies.

Similar articles

Cited by

References

    1. Alexandre C, Möller-Steinbach Y, Schönrock N, Gruissem W, Hennig L. Arabidopsis MSI1 is required for negative regulation of the response to drought stress. Mol Plant. 2009:2(4):675–687. 10.1093/mp/ssp012 - DOI - PubMed
    1. Anderson SJ, Kramer MC, Gosai SJ, Yu X, Vandivier LE, Nelson ADL, Anderson ZD, Beilstein MA, Fray RG, Lyons E, et al. . N 6-methyladenosine inhibits local ribonucleolytic cleavage to stabilize mRNAs in Arabidopsis. Cell Rep. 2018:25(5):1146–1157.e3. 10.1016/j.celrep.2018.10.020 - DOI - PubMed
    1. Arribas-Hernández L, Bressendorff S, Hansen MH, Poulsen C, Erdmann S, Brodersen P. An m6A-YTH module controls developmental timing and morphogenesis in Arabidopsis. Plant Cell. 2018:30(5):952–967. 10.1105/tpc.17.00833 - DOI - PMC - PubMed
    1. Arribas-Hernández L, Simonini S, Hansen MH, Paredes EB, Bressendorff S, Dong Y, Østergaard L, Brodersen P. Recurrent requirement for the m6A-ECT2/ECT3/ECT4 axis in the control of cell proliferation during plant organogenesis. Development 2020:147:dev189134. 10.1242/dev.189134 - DOI - PMC - PubMed
    1. Bhat SS, Bielewicz D, Gulanicz T, Bodi Z, Yu X, Anderson SJ, Szewc L, Bajczyk M, Dolata J, Grzelak N, et al. . mRNA adenosine methylase (MTA) deposits m6A on pri-miRNAs to modulate miRNA biogenesis in Arabidopsis thaliana. Proc Natl Acad Sci USA. 2020:117(35):21785–21795. 10.1073/pnas.2003733117 - DOI - PMC - PubMed

MeSH terms

LinkOut - more resources