. 2024 May 8:7:16.
doi: 10.20517/cdr.2024.01. eCollection 2024.

Isocucurbitacin B inhibits glioma growth through PI3K/AKT pathways and increases glioma sensitivity to TMZ by inhibiting hsa-mir-1286a

Affiliations

Isocucurbitacin B inhibits glioma growth through PI3K/AKT pathways and increases glioma sensitivity to TMZ by inhibiting hsa-mir-1286a

Mingyu Han et al. Cancer Drug Resist. .

Abstract

Aim: Glioma accounts for 81% of all cancers of the nervous system cancers and presents one of the most drug-resistant malignancies, resulting in a relatively high mortality rate. Despite extensive efforts, the complete treatment options for glioma remain elusive. The effect of isocucurbitacin B (isocuB), a natural compound extracted from melon pedicels, on glioma has not been investigated. This study aims to investigate the inhibitory effect of isocuB on glioma and elucidate its underlying mechanisms, with the objective of developing it as a potential therapeutic agent for glioma. Methods: We used network pharmacology and bioinformatics analysis to predict potential targets and associated pathways of isocuB in glioma. Subsequently, the inhibitory effect of isocuB on glioma and its related mechanisms were assessed through Counting Kit-8 (CCK-8), wound healing, transwell, Western blot (WB), reverse transcription-quantitative polymerase chain reaction (RT-qPCR), and other in vitro experiments, alongside tumor formation experiments in nude mice. Results: Based on this investigation, it suggested that isocuB might inhibit the growth of gliomas through the PI3K-AKT and MAPK pathways. Additionally, we proposed that isocuB may enhance glioma drug sensitivity to temozolomide (TMZ) via modulation of hsa-mir-1286a. The CCK-8 assay revealed that isocuB exhibited inhibitory effects on U251 and U87 proliferation and outperformed TMZ. Wound healing and transwell experiments showed that isocuB inhibited the invasion and migration of U251 cells by suppressing the activity of MMP-2/9, N-cadherin, and Vimentin. The TdT-mediated dUTP-biotin nick end labeling (TUNEL) and flow cytometry (FCM) assays revealed that isocuB induced cell apoptosis through inhibition of BCL-2. Subsequently, we conducted RT-qPCR and WB experiments, which revealed that PI3K/AKT and MAPK pathways might be involved in the mechanism of the inhibition isocuB on glioma. Additionally, isocuB promoted the sensitivity of glioma U251 to TMZ by inhibiting hsa-mir-1286a. Furthermore, we constructed TMZ-resistant U251 strains and demonstrated effective inhibition by isocuB against these resistant strains. Finally, we confirmed that isocuB can inhibit tumor growth in vivo through experiments on tumors in nude mice. Conclusion: IsocuB may protect against glioma by acting on the PI3K/AKT and MAPK pathways and promote the sensitivity of glioma U251 to TMZ by inhibiting hsa-mir-1286a.

Keywords: Isocucurbitacin B; drug sensitivity; glioma; hsa-mir-1286a; network pharmacology.


Conflict of interest statement

All authors declared that there are no conflicts of interest.

Figures
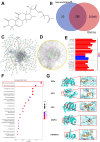
Figure 1
Figure 1
(A) IsocuB, drawn using Chemdraw; (B) Obtain 280 intersection target genes for isocuB and glioma; (C) STRING database of the 280 potential therapeutic targets; (D) PPI network of the 280 potential therapeutic targets; (E) The top 10 significant enrichment terms in BP, CC, and MF are shown in a GO enrichment bubble map containing 280 intersecting targets; (F) The top 20 most significantly enriched pathways Bar diagram of KEGG pathway enrichment analysis with 280 cross-target sites; (G) The result diagram of molecular docking. The yellow 3D structural formula represents isocuB; the blue bond represents the hydrogen bond at the binding site. IsocuB: Isocucurbitacin B; STRING: search tool for the retrieval of interacting genes; PPI: protein-protein interaction; BP: biological process; CC: cell component; MF: molecular function; GO: Gene Ontology; KEGG: Kyoto encyclopedia of genes and genomes.
Figure 2
Figure 2
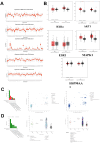
(A) mRNA expression levels in common tumor tissues; (B) The mRNA expression levels in common tumor tissues (*P < 0.05 vs. control group); (C) Mutation, deep deletion, and amplification of AKT1 in gliomas. Green, blue, and red indicate mutations, deep deletions, and amplifications, respectively. AKT1 methylation is negatively correlated with the expression of AKT1 in glioma tissues (****P < 0.0001 vs. control group). The AKT1 gene has a low methylation level in gliomas. (****P < 0.0001 vs. control group); (D) Mutations, deep deletions, and MAPK1 amplification in glioma cells. Green indicates mutations. Different types of MAPK1 mutations. Different types of MAPK1 mutation in glioma at different levels. AKT1: AKT serine/threonine kinase 1; MAPK1: mitogen-activated protein kinase 1.
Figure 3
Figure 3
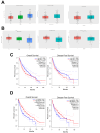
(A) Relationship between mRNA expression levels of AKT1 and clinicopathological features in patients with glioma. Significant differences in the expression of (WHO II, WHO III, and WHO IV) (****P < 0.0001 vs. control group). Significant differences among different states of IDH (wild type, mutant type) (****P < 0.0001 vs. control group). Significant differences among different age status (</≥ 42) (*P < 0.05 vs. control group); (B) Relationship between mRNA expression levels of MAPK1 and clinicopathological features in patients with glioma. Significant differences in the expression of (WHO II, WHO III, and WHO IV) (****P < 0.0001 vs. control group). Significant differences among different states of IDH (wild type, mutant type) (****P < 0.0001 vs. control group); Significant differences among different age status (</≥ 42) (****P < 0.0001 vs. control group); (C and D) The prognosis of the low AKT1 and MAPK1 expression groups was better than that of the high expression group (*P < 0.05, ****P < 0.0001 vs. control group). The disease-free survival of the low AKT1 and MAPK1 expression groups was better thanthat of the high expression group (*P < 0.05 vs. control group). AKT1: AKT serine/threonine kinase 1; IDH: isocitrate dehydrogenase; MAPK1: mitogen-activated protein kinase 1.
Figure 4
Figure 4
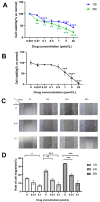
(A) The viability of U251 cells after 12 and 24 h of isocuB treatment (**P < 0.01, ***P < 0.001; ****P < 0.0001 vs. control group); (B) The viability of U87 cells after 24 h of isocuB treatment (***P < 0.001; ****P < 0.0001 vs. control group); (C and D) Cell mobility of U251 cells after12, 24 and 36 h of isocuB treatment (*P < 0.05, **P < 0.01, ***P < 0.001 vs. control group). isocuB: Isocucurbitacin B.
Figure 5
Figure 5
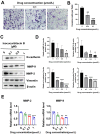
(A and B) The transwell invasion process is measured by the number of cells after 24 h of treatment (**P < 0.01, ***P < 0.001 vs. control group); (C and D) Protein expressions of MMP-2/9, N-cadherin, and Vimentin were analyzed using WB. Data are represented as mean ± SD (*P < 0.05, **P < 0.01, ***P < 0.001, ****P < 0.0001 vs. control group vs. control group); (E) Expression of MMP-2 and MMP-9 RNA was detected using RT-qPCR (*P < 0.05, **P < 0.01, ***P < 0.001 vs. control group). MMP-2/9: Matrix metalloproteinase 2/9; WB: Western blot; RT-qPCR: reverse transcription-quantitative polymerase chain reaction.
Figure 6
Figure 6
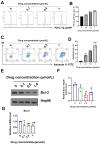
(A and B) Dye content of FITC-12-dUTP was detected by FCM (****P < 0.0001 vs. control group); (C and D) The apoptosis rate was increased by FCM. Q3-1 represents normal cells, Q3-4 represents viable apoptotic cells, Q3-2 represents late apoptotic cells, and Q3-1 represents mechanical destruction of cells (**P < 0.01, ***P < 0.001, ****P < 0.0001 vs. control group); (E and F) Protein expression of BCL-2 was analyzed using WB. Data are represented as mean ± SD (*P < 0.05, **P < 0.01 vs. control group); (G) Expression of BCL-2 RNA was detected using RT-qPCR (n = 3) (*P < 0.05, **P < 0.01, ***P < 0.001 vs. control group). FCM: Flow cytometry; BCL-2: B-cell lymphoma-2; WB: western blot; RT-qPCR: reverse transcription-quantitative polymerase chain reaction.
Figure 7
Figure 7
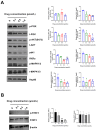
(A) Protein expressions of p-PI3K, PI3K, p-AKT(S473), t-AKT, RXRα, PDK1, p-MAPK1/3, MAPK1/3 and Bcl-2 were analyzed using WB. Data are represented as mean ± SD (*P < 0.05, **P < 0.01, ***P < 0.001, ****P < 0.0001 vs. control group); (B) Protein expressions of p-STAT3, STAT3 were analyzed using WB. Data are represented as mean ± SD (**P < 0.01 vs. control group). PI3K: Phosphoinositide 3-kinase; AKT: AKT serine/threonine kinase; PDK1: 3-phosphoinositide-dependent protein kinase 1; MAPK: mitogen-activated protein kinase; WB: western blot; STAT3: signal transducer and activator of transcription 3.
Figure 8
Figure 8
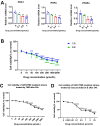
(A) Expression of pdk1, RXRα, PPAα, and Bcl-2 RNA was detected using RT-qPCR (*P < 0.05, **P < 0.01 vs. control group); (B) The viability of U251 cells after 12 and 24 h of TMZ treatment (*P < 0.05, **P < 0.01, ***P < 0.001, ****P < 0.0001 vs. control group); (C) The viability of U251/TMZ resistant strains after 24 h of TMZ treatment (*P < 0.05, ***P < 0.001, ****P < 0.0001 vs. control group); (D) The viability of U251/TMZ resistant strains after 24 h of isocuB treatment (*P < 0.05, ***P < 0.001, ****P < 0.0001 vs. control group). RT-qPCR: Reverse transcription-quantitative polymerase chain reaction; TMZ: temozolomide; isocuB: isocucurbitacin B.
Figure 9
Figure 9
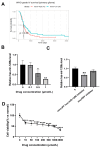
(A) Prognosis of low and high expression levels of hsa-mir-1286a in grade 4 gliomas; (B) Expression of hsa-mir-1286a was detected using RT-qPCR (*P < 0.05, **P < 0.01 vs. control group); (C) Expression of hsa-mir-1286a after using hsa-miR-1286a inhibitor was detected using RT-qPCR (**P < 0.01 vs. control group); (D) Cell viability of U251 cells after 24 h of TMZ treatment after microFF hsa-miR-1286 inhibitor added (****P < 0.0001 vs. control group). RT-qPCR: Reverse transcription-quantitative polymerase chain reaction; TMZ: temozolomide.
Figure 10
Figure 10
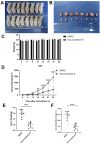
IsocuB inhibits tumor growth in nude mice. (A) Bossing of the mass in nude mice: the control group is shown above, and the treatment group is shown below; (B) Bossing: control group at the top and treatment group at the bottom; (C) Body weight changes in nude mice; (D) Daily tumor volume changes after administration (**P < 0.01, ****P < 0.0001 vs. control group); (E) The bossing weight (****P < 0.0001 vs. control group); (F) Bossing weight/body weight (****P < 0.0001 vs. control group). IsocuB: Isocucurbitacin B.

Similar articles

References

    1. Berger TR, Wen PY, Lang-Orsini M, Chukwueke UN. World Health Organization 2021 classification of central nervous system tumors and implications for therapy for adult-type gliomas: a review. JAMA Oncol. 2022;8:1493–501. doi: 10.1001/jamaoncol.2022.2844. - DOI - PubMed
    1. Wang L, Li S, Fan H, et al. Bifidobacterium lactis combined with Lactobacillus plantarum inhibit glioma growth in mice through modulating PI3K/AKT pathway and gut microbiota. Front Microbiol 2022;13:986837. - DOI - PMC - PubMed
    1. Louis DN, Perry A, Wesseling P, et al. The 2021 WHO classification of tumors of the central nervous system: a summary. Neuro Oncol. 2021;23:1231–51. doi: 10.1093/neuonc/noab106. - DOI - PMC - PubMed
    1. Cai X, Wang M, Mu P, et al. Sequence-defined nanotubes assembled from IR780-conjugated peptoids for chemophototherapy of malignant glioma. Research. 2021;2021:9861384. doi: 10.34133/2021/9861384. - DOI - PMC - PubMed
    1. Xu S, Tang L, Li X, Fan F, Liu Z. Immunotherapy for glioma: current management and future application. Cancer Lett. 2020;476:1–12. doi: 10.1016/j.canlet.2020.02.002. - DOI - PubMed

LinkOut - more resources