

Small- to medium-sized mammals show greater morphological disparity in cervical than lumbar vertebrae across different terrestrial modes of locomotion
- PMID: 38835523
- PMCID: PMC11148397
- DOI: 10.1002/ece3.11478
Small- to medium-sized mammals show greater morphological disparity in cervical than lumbar vertebrae across different terrestrial modes of locomotion
Abstract
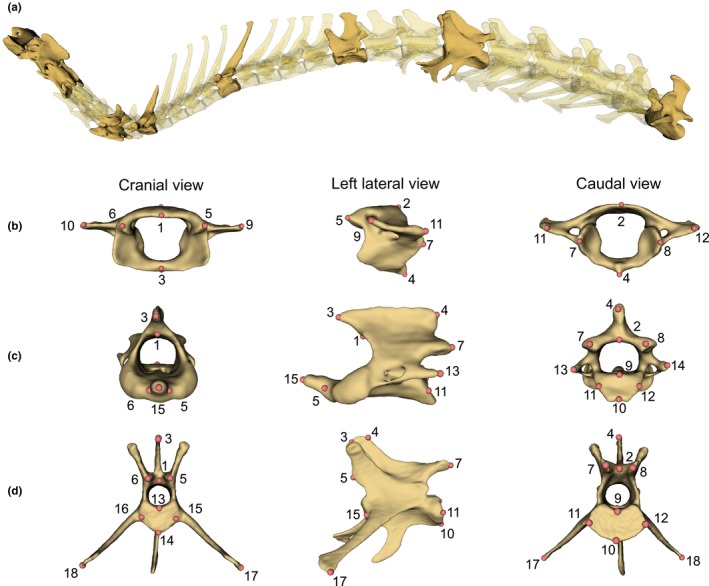
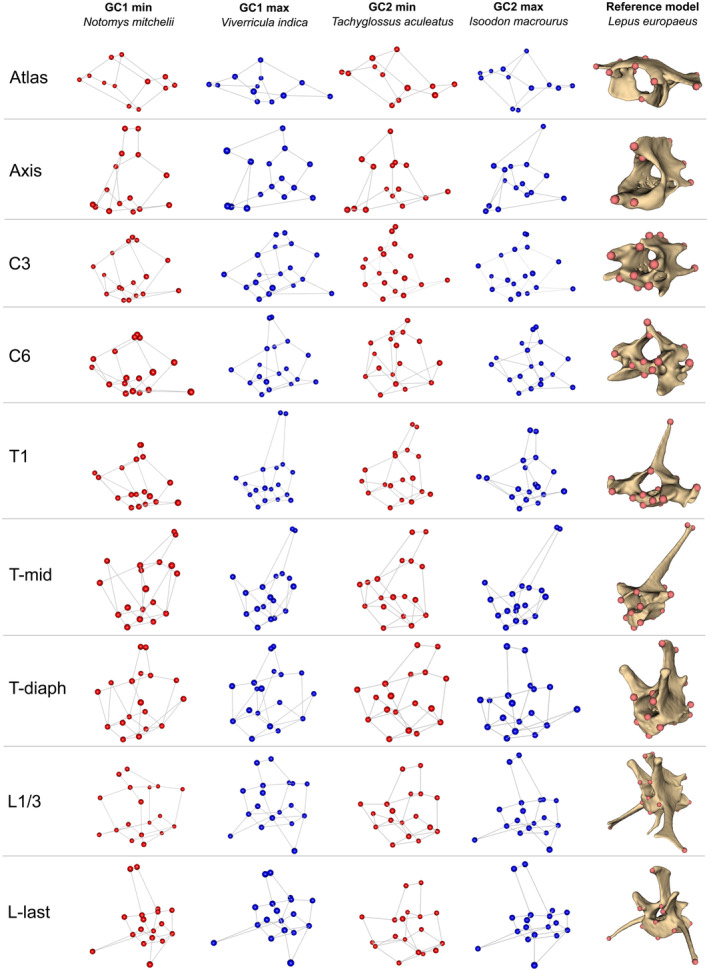
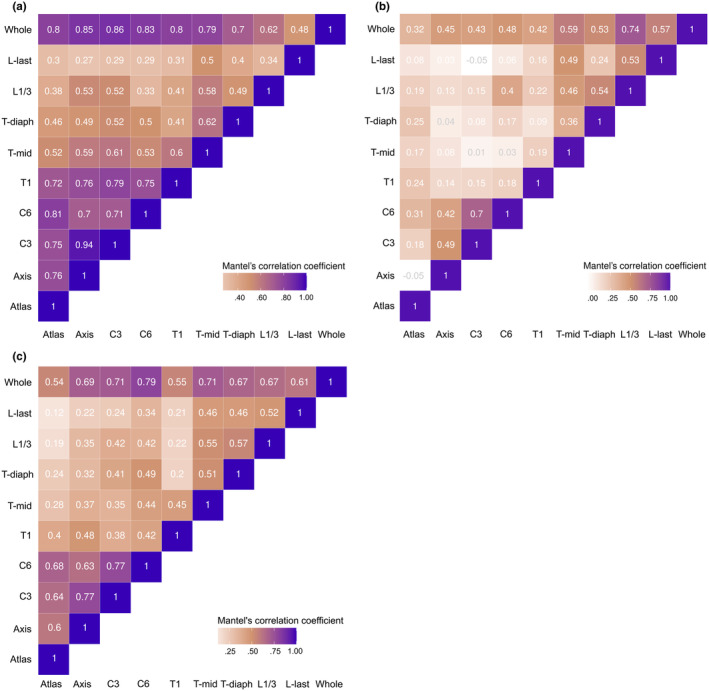
During mammalian terrestrial locomotion, body flexibility facilitated by the vertebral column is expected to be correlated with observed modes of locomotion, known as gait (e.g., sprawl, trot, hop, bound, gallop). In small- to medium-sized mammals (average weight up to 5 kg), the relationship between locomotive mode and vertebral morphology is largely unexplored. Here we studied the vertebral column from 46 small- to medium-sized mammals. Nine vertebrae across cervical, thoracic, and lumbar regions were chosen to represent the whole vertebral column. Vertebra shape was analysed using three-dimensional geometric morphometrics with the phylogenetic comparative method. We also applied the multi-block method, which can consider all vertebrae as a single structure for analysis. We calculated morphological disparity, phylogenetic signal, and evaluated the effects of allometry and gait on vertebral shape. We also investigated the pattern of integration in the column. We found the cervical vertebrae show the highest degree of morphological disparity, and the first thoracic vertebra shows the highest phylogenetic signal. A significant effect of gait type on vertebrae shape was found, with the lumbar vertebrae having the strongest correlation; but this effect was not significant after taking phylogeny into account. On the other hand, allometry has a significant effect on all vertebrae regardless of the contribution from phylogeny. The regions showed differing degrees of integration, with cervical vertebrae most strongly correlated. With these results, we have revealed novel information that cannot be captured from study of a single vertebra alone: although the lumbar vertebrae are the most correlated with gait, the cervical vertebrae are more morphologically diverse and drive the diversity among species when considering whole column shape.
Keywords: allometry; axial skeleton; gait; geometric morphometrics; regularised consensus principal component analysis.
© 2024 The Authors. Ecology and Evolution published by John Wiley & Sons Ltd.
Conflict of interest statement
The authors in this study declare no conflict of interest.
Figures


Similar articles
-
Morphological modularity in the vertebral column of Felidae (Mammalia, Carnivora).BMC Evol Biol. 2017 Jun 9;17(1):133. doi: 10.1186/s12862-017-0975-2. BMC Evol Biol. 2017. PMID: 28599641 Free PMC article.
-
Adaptation and constraint in the evolution of the mammalian backbone.BMC Evol Biol. 2018 Nov 16;18(1):172. doi: 10.1186/s12862-018-1282-2. BMC Evol Biol. 2018. PMID: 30445907 Free PMC article.
-
Locomotion in some small to medium-sized mammals: a geometric morphometric analysis of the penultimate lumbar vertebra, pelvis and hindlimbs.Zoology (Jena). 2013 Dec;116(6):356-71. doi: 10.1016/j.zool.2013.08.007. Epub 2013 Oct 5. Zoology (Jena). 2013. PMID: 24182890
-
Evolution and function of anterior cervical vertebral fusion in tetrapods.Biol Rev Camb Philos Soc. 2017 Feb;92(1):608-626. doi: 10.1111/brv.12245. Epub 2016 Jan 13. Biol Rev Camb Philos Soc. 2017. PMID: 26766070 Review.
-
Vertebral body integrity: a review of various anatomical factors involved in the lumbar region.Osteoporos Int. 2007 Jul;18(7):891-903. doi: 10.1007/s00198-007-0373-5. Epub 2007 Apr 3. Osteoporos Int. 2007. PMID: 17404781 Review.
Cited by
-
Does fast running limit numerical variability of the vertebral column in rabbits and hares (Leporidae: Lagomorpha)?R Soc Open Sci. 2025 Jan 29;12(1):241813. doi: 10.1098/rsos.241813. eCollection 2025 Jan. R Soc Open Sci. 2025. PMID: 39881789 Free PMC article.
References
-
- 3D Slicer . (2023). 3D Slicer image computing platform [Online]. https://www.slicer.org/
-
- Adams, D. C. (2014). A generalized K statistic for estimating phylogenetic signal from shape and other high‐dimensional multivariate data. Systematic Biology, 63, 685–697. - PubMed
-
- Adams, D. C. , Collyer, M. L. , Kaliontzopoulou, A. , & Baken, E. (2023). Geomorph: Software for geometric morphometric analyses. R package version 4.0.6. [Online]. https://cran.r‐project.org/package=geomorph
-
- Alexander, R. M. , Dimery, N. J. , & Ker, R. F. (1985). Elastic structures in the back and their role in galloping in some mammals. Journal of Zoology, 207, 467–482.
-
- Álvarez, A. , Ercoli, M. D. , & Prevosti, F. J. (2013). Locomotion in some small to medium‐sized mammals: A geometric morphometric analysis of the penultimate lumbar vertebra, pelvis and hindlimbs. Zoology, 116, 356–371. - PubMed
LinkOut - more resources
Full Text Sources
