

TRPC absence induces pro-inflammatory macrophage polarization to promote obesity and exacerbate colorectal cancer
- PMID: 38835669
- PMCID: PMC11148282
- DOI: 10.3389/fphar.2024.1392328
TRPC absence induces pro-inflammatory macrophage polarization to promote obesity and exacerbate colorectal cancer
Abstract
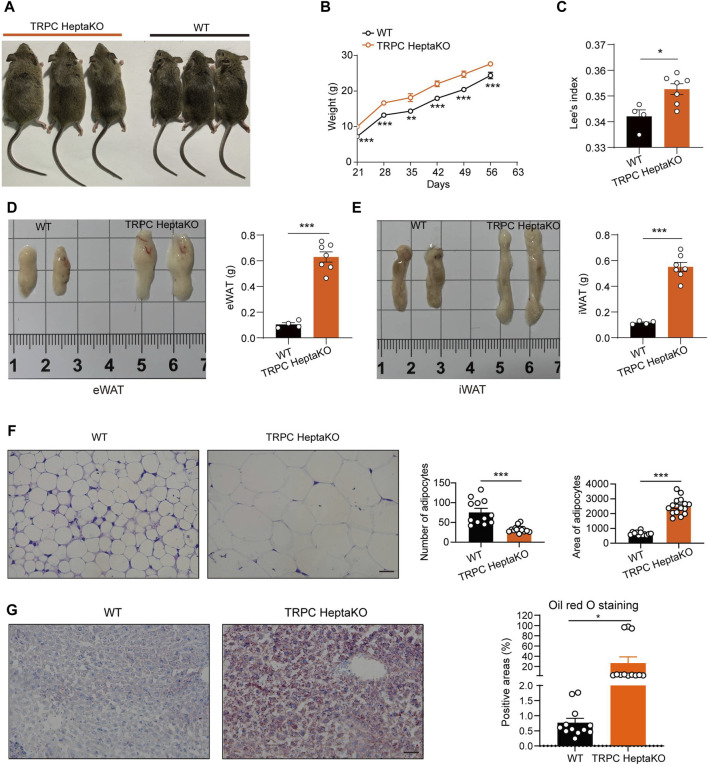
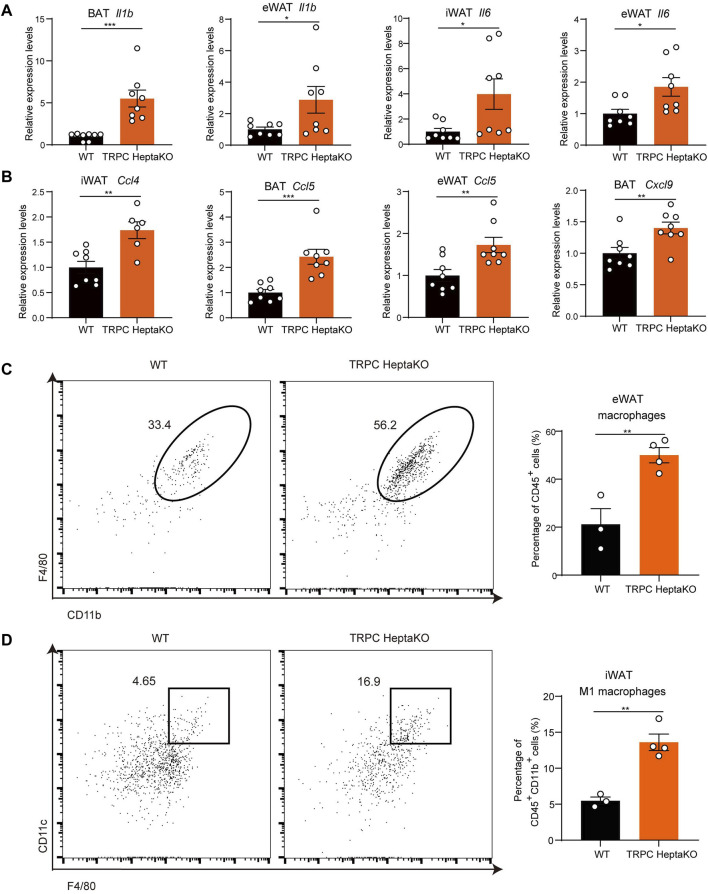
During the past half-century, although numerous interventions for obesity have arisen, the condition's prevalence has relentlessly escalated annually. Obesity represents a substantial public health challenge, especially due to its robust correlation with co-morbidities, such as colorectal cancer (CRC), which often thrives in an inflammatory tumor milieu. Of note, individuals with obesity commonly present with calcium and vitamin D insufficiencies. Transient receptor potential canonical (TRPC) channels, a subclass within the broader TRP family, function as critical calcium transporters in calcium-mediated signaling pathways. However, the exact role of TRPC channels in both obesity and CRC pathogenesis remains poorly understood. This study set out to elucidate the part played by TRPC channels in obesity and CRC development using a mouse model lacking all seven TRPC proteins (TRPC HeptaKO mice). Relative to wild-type counterparts, TRPC HeptaKO mice manifested severe obesity, evidenced by significantly heightened body weights, augmented weights of epididymal white adipose tissue (eWAT) and inguinal white adipose tissue (iWAT), increased hepatic lipid deposition, and raised serum levels of total cholesterol (T-CHO) and low-density lipoprotein cholesterol (LDL-C). Moreover, TRPC deficiency was accompanied by an decrease in thermogenic molecules like PGC1-α and UCP1, alongside a upsurge in inflammatory factors within adipose tissue. Mechanistically, it was revealed that pro-inflammatory factors originating from inflammatory macrophages in adipose tissue triggered lipid accumulation and exacerbated obesity-related phenotypes. Intriguingly, considering the well-established connection between obesity and disrupted gut microbiota balance, substantial changes in the gut microbiota composition were detected in TRPC HeptaKO mice, contributing to CRC development. This study provides valuable insights into the role and underlying mechanisms of TRPC deficiency in obesity and its related complication, CRC. Our findings offer a theoretical foundation for the prevention of adverse effects associated with TRPC inhibitors, potentially leading to new therapeutic strategies for obesity and CRC prevention.
Keywords: TRPC HeptaKO; colorectal cancer; gut microbiota; macrophages; obesity.
Copyright © 2024 Lin, Gao, Jing, Liu, Da, Birnbaumer, Yang, Gao, Gao and Cao.
Conflict of interest statement
The authors declare that the research was conducted in the absence of any commercial or financial relationships that could be construed as a potential conflict of interest.
Figures


Similar articles
-
TRPC absence induces pro-inflammatory macrophages and gut microbe disorder, sensitizing mice to colitis.Int Immunopharmacol. 2023 Feb;115:109655. doi: 10.1016/j.intimp.2022.109655. Epub 2022 Dec 31. Int Immunopharmacol. 2023. PMID: 36592529
-
Maternal vitamin D deficiency increases the risk of obesity in male offspring mice by affecting the immune response.Nutrition. 2021 Jul-Aug;87-88:111191. doi: 10.1016/j.nut.2021.111191. Epub 2021 Feb 11. Nutrition. 2021. PMID: 33744641
-
Modulation of PPARα-thermogenesis gut microbiota interactions in obese mice administrated with zingerone.J Sci Food Agric. 2023 Apr;103(6):3065-3076. doi: 10.1002/jsfa.12352. Epub 2022 Dec 8. J Sci Food Agric. 2023. PMID: 36424723
-
Reappraisal of Adipose Tissue Inflammation in Obesity.Adv Exp Med Biol. 2024;1460:297-327. doi: 10.1007/978-3-031-63657-8_10. Adv Exp Med Biol. 2024. PMID: 39287856 Review.
-
The Role of Adipocytes Recruited as Part of Tumor Microenvironment in Promoting Colorectal Cancer Metastases.Int J Mol Sci. 2024 Jul 30;25(15):8352. doi: 10.3390/ijms25158352. Int J Mol Sci. 2024. PMID: 39125923 Free PMC article. Review.
Cited by
-
Loss of endothelial TRPC1 aggravates metabolic dysfunction in obesity via disrupting adipose tissue homeostasis.Front Mol Biosci. 2025 Jun 11;12:1619559. doi: 10.3389/fmolb.2025.1619559. eCollection 2025. Front Mol Biosci. 2025. PMID: 40568618 Free PMC article.
-
The association between obesity-related indicators and female infertility: the United States National Health and Nutrition Examination Survey, 2013-2018.Front Endocrinol (Lausanne). 2025 Jun 23;16:1588965. doi: 10.3389/fendo.2025.1588965. eCollection 2025. Front Endocrinol (Lausanne). 2025. PMID: 40626237 Free PMC article.
References
Grants and funding
LinkOut - more resources
Full Text Sources
Molecular Biology Databases
Miscellaneous