. 2024 May 21:11:1374511.
doi: 10.3389/fvets.2024.1374511. eCollection 2024.

Comparing standard screening questionnaires of canine behavior for assessment of cognitive dysfunction

Affiliations

Comparing standard screening questionnaires of canine behavior for assessment of cognitive dysfunction

Julia Haake et al. Front Vet Sci. .

Abstract

Background: Canine cognitive dysfunction (CCD) is a common, yet underdiagnosed neurodegenerative disease affecting older dogs. Treatment is most effective when started early, so identifying mild cognitive decline in the earlier stages of the disease is considered important.

Hypothesis/objective: To compare the results of three different standard screening questionnaires [Canine Dementia Scale (CADES), Canine Cognitive Assessment Scale (CCAS), and Canine Cognitive Dysfunction Rating Scale (CCDR)] for CCD diagnosis. Trainability, pain sensitivity, and fear were additionally assessed with the Canine Behavioral Assessment and Research Questionnaire (C-BARQ) in order to evaluate associations between the three dementia scales and behavior.

Methods: An online survey containing all the mentioned questionnaires was designed for and distributed among owners of elderly dogs.

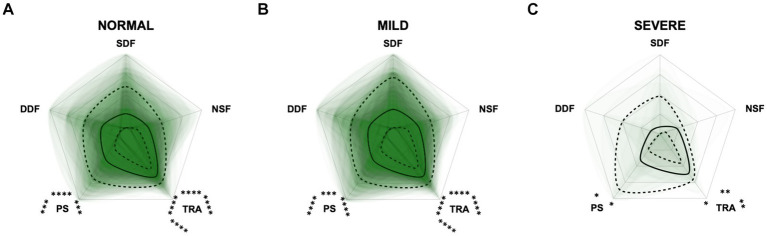
Results: Data from 597 dogs were analyzed. Overall, the scores of the three CCD questionnaires correlated well with each other, especially those of the CADES and CCAS. The CADES was more sensitive in identifying dogs with already mild to moderate cognitive impairment, while the others classified them as still undergoing normal aging. CCD scores increased for all questionnaires with age with spatial orientation being a key feature in CCD development. Trainability assessed with the C-BARQ decreased significantly with severity of CCD signs, while pain sensitivity increased. Fear and anxiety was pronounced in animals with mild but not with severe CCD. These associations based on the C-BARQ were more clearly observable in relation to CADES and CCDR than CCAS.

Conclusion/clinical relevance: The choice of screening questionnaire impacts the evaluation of cognitive status and severity of CCD. Thresholds for severity classification differ significantly and may have an impact on reliable assessment. Further longitudinal studies are required to determine which of the questionnaires investigated in this study is best suited for early detection of CCD.

Keywords: assessment tools; canine dementia; cognition; geriatrics; questionnaire.


Conflict of interest statement

The authors declare that the research was conducted in the absence of any commercial or financial relationships that could be construed as a potential conflict of interest. The author(s) declared that they were an editorial board member of Frontiers, at the time of submission. This had no impact on the peer review process and the final decision.

Figures

Figure 1
Figure 1
Total possible score ranges and dogs’ actual scores as percentage for (A) CADES, (B) CCAS, and (C) CCDR. The horizontal dashed line in each graph represents the corresponding median. Severity categories are color-coded, and their thresholds are displayed on the left y-axes as a percentage of the total possible score. The percentages on the right y-axes correspond to the distribution of animals in the respective categories. CCD, Canine cognitive dysfunction.
Figure 2
Figure 2
Truncated violin plots with median age (solid horizontal line), quartiles (dotted horizontal lines), and range of dogs’ ages in each severity category within each questionnaire. Kruskal–Wallis tests were significant for (A) the CADES, (B) the CCAS, and (C) the CCDR (p ≤ 0.0001). Dunn’s post hoc tests revealed significant differences in age between the categories (*p ≤ 0.0001; corresponding “normal” group as control). CCD, Canine cognitive dysfunction.
Figure 3
Figure 3
Canine cognitive dysfunction (CCD) scores as a function of age, facetted by questionnaire type, i.e., (A) CADES, (B) CCAS, and (C) CCDR. To ensure comparability between the questionnaires, severity categories were summarized as follows: (i) normal, (ii) mild/moderate/at risk, (iii) severe/CCD. In each CCD questionnaire, the severity levels were highlighted and fit with a linear function, representing the random intercepts term in the mixed model. The slopes of the functions between the groups differed significantly for (A) the CADES and (B) the CCAS, and (C) the CCDR over age. The interaction term of questionnaire type:age was significant in all three analyses (p ≤ 0.0001). Note the differences in intercepts between questionnaires and the variance in score ranges per severity categories.
Figure 4
Figure 4
Principal component analysis (PCA) biplots of Canine cognitive dysfunction (CCD) scores and categorization in relation to the three questionnaires CADES, CCAS and CCDR. The colored data points (PCA scores) represent each dog and the general severity progression patterns (from green to red), whereas the black arrows and points represent the loadings for each questionnaire. The progression patterns and the loadings differ between all three scales, especially for both (A) CADES and (B) CCAS versus (C) CCDR, respectively.
Figure 5
Figure 5
Principal component analysis (PCA) biplots of Canine cognitive dysfunction scores and categorization in relation to the (A) CADES and (B) CCAS domains “spatial orientation” (SO), “social interaction” (SI),” sleep–wake-cycles” (SWC), “house-soiling” (HS), “disorientation” (DO), “anxiety” (ANX), “activity level” (ACT), and “learning and memory” (LM). The colored data points (PCA scores) represent each dog and the general severity progression patterns (from green to red), whereas the black arrows and points represent the loadings for each domain. For the (A) CADES scoring, the domain of HS had less pronounced effects on the direction of progression patterns. For the (B) CCAS, the domains ANX and SI played a subordinate role for the main direction of CCD pattern progression. Please note that corresponding analyses were not conducted for the CCDR, as domains did not play a role in the evaluation there.
Figure 6
Figure 6
Confirmatory Factor Analysis of (A) CADES and (B) CCAS scoring in relation to their domains as indicators. The paths show the values of the factor loadings of the domains “spatial orientation” (SO), “social interaction” (SI), “sleep–wake-cycles” (SWC), “house-soiling” (HS), “disorientation” (DO), “anxiety” (ANX), “activity level” (ACT), and “learning and memory” (LM) on the latent variables CADES or CCAS. All domains loaded significantly on the total constructs (p ≤ 0.0001). The order of importance derived from the standardized factor loadings was as follows. For (A) CADES: SO (89.8%), SI (74%), SWC (70.8%), HS (60%); for (B) CCAS: DO (88.2%), LM (80%), ACT (74.6%), SWC (64%), SI (48.1%), ANX (38.9%). Values displayed on the arrowed circles represent estimates of the residual variances of each domain (p ≤ 0.0001). Please note that corresponding analyses were not conducted for the CCDR, as domains did not play a role in the evaluation there.
Figure 7
Figure 7
Radar plots consisting of all four CADES domains “spatial orientation” (SO), “social interaction” (SI), “sleep–wake-cycles” (SWC), and “house-soiling” (HS) within the different severity categories (A) normal, (B) mild, (C) moderate, and (D) severe. Each dog’s score pattern is represented by a transparent green area, and these areas overlap in each plot. The straight edges of the radar plot represent the maximum possible scoring of 100% per domain. The center of the plot is virtually set at −0.1 in order to highlight scores at zero more clearly. The solid black line inside the plots represents the median score in percent per domain in each plot; the inner and outer dotted lines represent the first and third quartile of the scores in percent per domain in each plot, respectively. Kruskal–Wallis tests (p ≤ 0.0001) followed by Dunn’s multiple comparisons tests were performed to compare each domain across all four severity categories (corresponding “normal” group as control category for each domain, p ≤ 0.0001, not illustrated in figure). Friedman tests (p ≤ 0.0001) followed by Dunn’s multiple comparisons tests were performed within each severity category to compare the scorings between different domains and assess their importance. Significant differences are illustrated by asterisks strategically placed around the domain names (*p ≤ 0.05, **p ≤ 0.01, and ****p ≤ 0.0001). The positions of the asterisks indicate the specific domain with which the comparison was conducted within the severity category. To illustrate, if an asterisk is positioned above a domain name, it signifies that the statistically significant comparison was made between that domain and the one positioned at the top of the entire plot.
Figure 8
Figure 8
Radar plots consisting of all six CCAS domains “disorientation” (DO), “social interaction” (SI), “anxiety” (ANX), “activity level” (ACT), “sleep–wake-cycles” (SWC), and “learning and memory” (LM) within the different severity categories (A) normal, (B) mild, and (C) severe. Each dog’s score pattern is represented by a transparent green area, and these areas overlap in each plot. The straight edges of the radar plot represent the maximum possible scoring of 100% per domain. The center of the plot is virtually set at −0.1 in order to highlight scores at zero more clearly. The solid black line inside the plots represents the median score in percent per domain in each plot; the inner and outer dotted lines represent the first and third quartile of the scores in percent per domain in each plot, respectively. Kruskal–Wallis tests (p ≤ 0.0001) followed by Dunn’s multiple comparisons tests were performed to compare each domain across all three severity categories (corresponding “normal” group as control category for each domain, p ≤ 0.0001, not illustrated in figure). Friedman tests (p ≤ 0.0001) followed by Dunn’s multiple comparisons tests were performed within each severity category to compare the scorings between different domains and assess their importance. Significant differences are illustrated by asterisks strategically placed around the domain names (*p ≤ 0.05, **p ≤ 0.01, ***p ≤ 0.001, and ****p ≤ 0.0001). The positions of the asterisks indicate the specific domain with which the comparison was conducted within the severity category. To illustrate, if an asterisk is positioned above a domain name, it signifies that the statistically significant comparison was made between that domain and the one positioned at the top of the entire plot.
Figure 9
Figure 9
Principal component analysis (PCA) biplots of Canine cognitive dysfunction (CCD) scores and categorization in relation to the C-BARQ domains “dog-directed fear” (DDF), “stranger-directed fear” (SDF), “nonsocial fear” (NSF), “trainability” (TRA), and “pain sensitivity” (PS). The colored data points (PCA scores) represent each dog and the general severity progression patterns (from green to red), whereas the black arrows and points represent the loadings for each C-BARQ domain. Please note that dogs with mild/moderate signs or at risk for developing CCD are not displayed in color to increase visibility of the main progression patterns. (A) The progression pattern of CADES scores had a robust positive and negative relationship with the C-BARQ domains PS and TRA along CCD progression, respectively. (B,C) Similar relationships can be observed for the CCAS and CCDR, although the small number of severely affected dogs makes an interpretation challenging.
Figure 10
Figure 10
Radar plots consisting of the five C-BARQ domains “dog-directed fear” (DDF), “stranger-directed fear” (SDF), “nonsocial fear” (NSF), “trainability” (TRA), and “pain sensitivity” (PS) within the different severity categories (A) normal, (B) mild, (C) moderate, and (D) severe of the CADES questionnaire. Other behavior domains of the C-BARQ, such as “chasing” and “excitability,” were excluded as they seemed less relevant to the diagnosis of Canine cognitive dysfunction. Each dog’s score pattern is represented by a transparent green area, and these areas overlap in each plot. The straight edges of the radar plot represent the maximum possible scoring of 100% per domain. The center of the plot is virtually set at −0.1 in order to highlight scores at zero more clearly. The solid black line inside the plots represents the median score in percent per domain in each plot; the inner and outer dotted lines represent the first and third quartile of the scores in percent per domain in each plot, respectively. Kruskal–Wallis tests (p ≤ 0.05) followed by Dunn’s multiple comparisons tests were performed to compare each domain across all four severity categories (corresponding “normal” group as control category for each domain; significant differences illustrated by circles at each domain; p ≤ 0.01, p ≤ 0.001, and p ≤ 0.0001). Friedman tests (p ≤ 0.0001) followed by Dunn’s multiple comparisons tests were performed within each severity category to compare the scorings between different domains and assess their importance. Significant differences are illustrated by asterisks strategically placed around the domain names (*p ≤ 0.05, **p ≤ 0.01, ***p ≤ 0.001, and ****p ≤ 0.0001). The positions of the asterisks indicate the specific domain with which the comparison was conducted within the severity category. To illustrate, if an asterisk is positioned above a domain name, it signifies that the statistically significant comparison was made between that domain and the one positioned at the top of the entire plot.
Figure 11
Figure 11
Radar plots consisting of the five C-BARQ domains “dog-directed fear” (DDF), “stranger-directed fear” (SDF), “nonsocial fear” (NSF), “trainability” (TRA), and “pain sensitivity” (PS) within the different severity categories (A) normal, (B) mild, and (C) severe of the CCAS questionnaire. Other behavior domains of the C-BARQ, such as “chasing” and “excitability,” were excluded as they seemed less relevant to the diagnosis of Canine cognitive dysfunction. Each dog’s score pattern is represented by a transparent green area, and these areas overlap in each plot. The straight edges of the radar plot represent the maximum possible scoring of 100% per domain. The center of the plot is virtually set at −0.1 in order to highlight scores at zero more clearly. The solid black line inside the plots represents the median score in percent per domain in each plot; the inner and outer dotted lines represent the first and third quartile of the scores in percent per domain in each plot, respectively. Kruskal–Wallis tests followed by Dunn’s multiple comparisons tests were performed to compare each domain across all three severity categories (corresponding “normal” group as control category for each domain; not significant). Friedman tests (p ≤ 0.0001) followed by Dunn’s multiple comparisons tests were performed within each severity category to compare the scorings between different domains and assess their importance. Significant differences are illustrated by asterisks strategically placed around the domain names (*p ≤ 0.05, **p ≤ 0.01, ***p ≤ 0.001, and ****p ≤ 0.0001). The positions of the asterisks indicate the specific domain with which the comparison was conducted within the severity category. To illustrate, if an asterisk is positioned above a domain name, it signifies that the statistically significant comparison was made between that domain and the one positioned at the top of the entire plot.
Figure 12
Figure 12
Radar plots consisting of the five C-BARQ domains “dog-directed fear” (DDF), “stranger-directed fear” (SDF), “nonsocial fear” (NSF), “trainability” (TRA), and “pain sensitivity” (PS) within the different severity categories (A) normal, (B) at risk, and (C) Canine cognitive dysfunction (CCD) of the CCDR questionnaire. Other behavior domains of the C-BARQ, such as “chasing” and “excitability,” were excluded as they seemed less relevant to the diagnosis of CCD. Each dog’s score pattern is represented by a transparent green area, and these areas overlap in each plot. The straight edges of the radar plot represent the maximum possible scoring of 100% per domain. The center of the plot is virtually set at −0.1 in order to highlight scores at zero more clearly. The solid black line inside the plots represents the median score in percent per domain in each plot; the inner and outer dotted lines represent the first and third quartile of the scores in percent per domain in each plot, respectively. Kruskal–Wallis tests (p ≤ 0.01) followed by Dunn’s multiple comparisons tests were performed to compare each domain across all three severity categories (corresponding “normal” group as control category for each domain; significant differences illustrated by circles at each domain; p ≤ 0.01 and p ≤ 0.0001). Friedman tests (p ≤ 0.0001) followed by Dunn’s multiple comparisons tests were performed within each severity category to compare the scorings between different domains and assess their importance. Significant differences are illustrated by asterisks strategically placed around the domain names (*p ≤ 0.05, **p ≤ 0.01, ***p ≤ 0.001, and ****p ≤ 0.0001). The positions of the asterisks indicate the specific domain with which the comparison was conducted within the severity category. To illustrate, if an asterisk is positioned above a domain name, it signifies that the statistically significant comparison was made between that domain and the one positioned at the top of the entire plot.

Similar articles

Cited by

References

    1. Azkona G, García-Belenguer S, Chacón G, Rosado B, León M, Palacio J. Prevalence and risk factors of behavioural changes associated with age-related cognitive impairment in geriatric dogs. J Small Anim Pract. (2009) 50:87–91. doi: 10.1111/j.1748-5827.2008.00718.x, PMID: - DOI - PubMed
    1. Neilson JC, Hart BL, Cliff KD, Ruehl WW. Prevalence of behavioral changes associated with age-related cognitive impairment in dogs. J Am Vet Med Assoc. (2001) 218:1787–91. doi: 10.2460/javma.2001.218.1787, PMID: - DOI - PubMed
    1. Osella MC, Re G, Odore R, Girardi C, Badino P, Barbero R, et al. . Canine cognitive dysfunction syndrome: prevalence, clinical signs and treatment with a neuroprotective nutraceutical. Appl Anim Behav Sci. (2007) 105:297–310. doi: 10.1016/j.applanim.2006.11.007 - DOI
    1. Hunt A, Schönknecht P, Henze M, Seidl U, Haberkorn U, Schröder J. Reduced cerebral glucose metabolism in patients at risk for Alzheimer’s disease. Psychiatry Res Neuroimaging. (2007) 155:147–54. doi: 10.1016/j.pscychresns.2006.12.003 - DOI - PubMed
    1. Romanucci M, Della Salda L. Oxidative stress and protein quality control systems in the aged canine brain as a model for human neurodegenerative disorders. Oxidative Med Cell Longev. (2015) 2015:1–8. doi: 10.1155/2015/940131, PMID: - DOI - PMC - PubMed

LinkOut - more resources