. 2024 May 21:11:1364637.
doi: 10.3389/fmolb.2024.1364637. eCollection 2024.

Untargeted metabolomics and metagenomics reveal signatures for intramammary ceftiofur treatment and lactation stage in the cattle hindgut

Affiliations

Untargeted metabolomics and metagenomics reveal signatures for intramammary ceftiofur treatment and lactation stage in the cattle hindgut

Karla A Vasco et al. Front Mol Biosci. .

Abstract

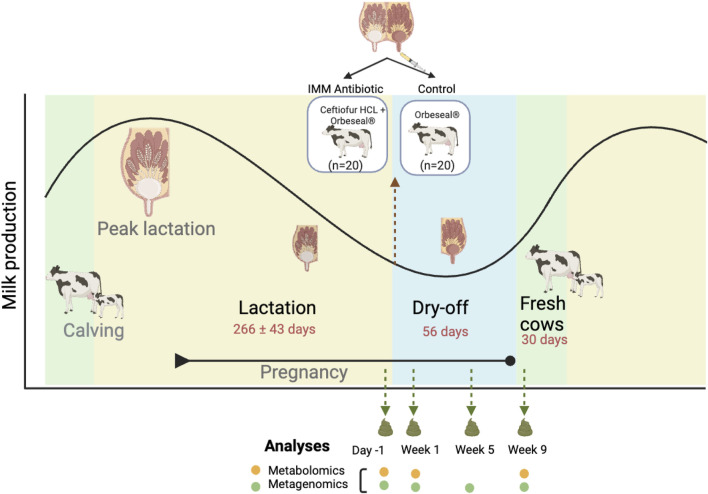
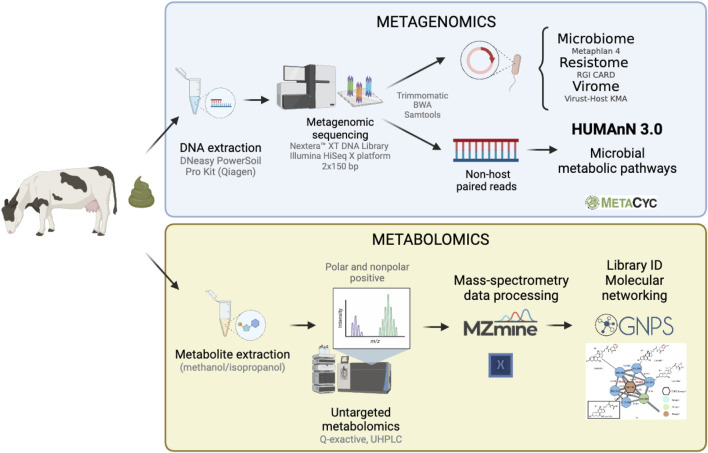
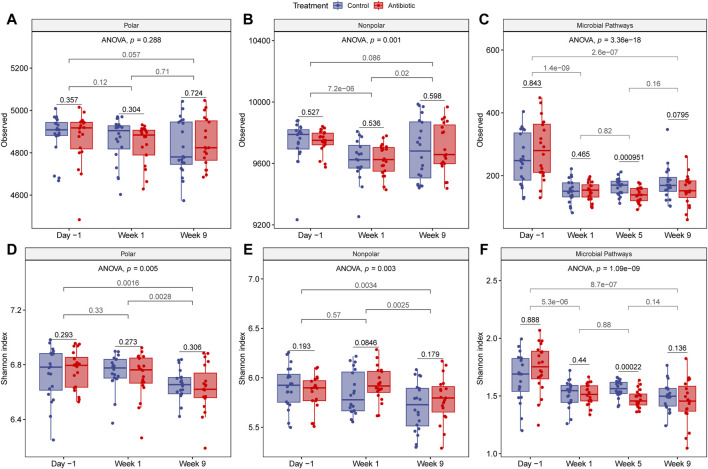
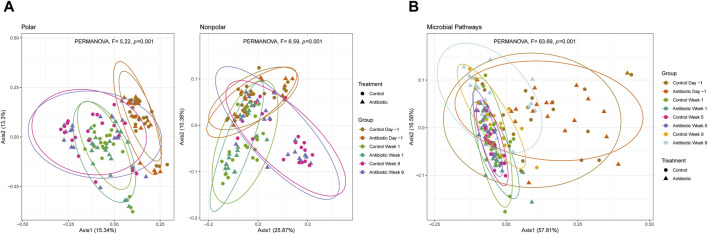
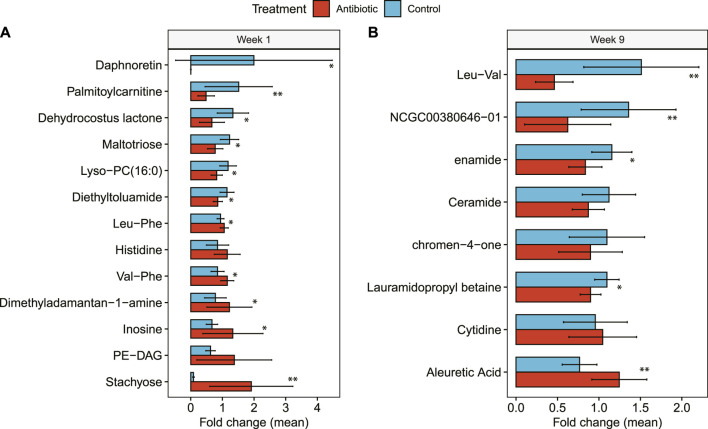
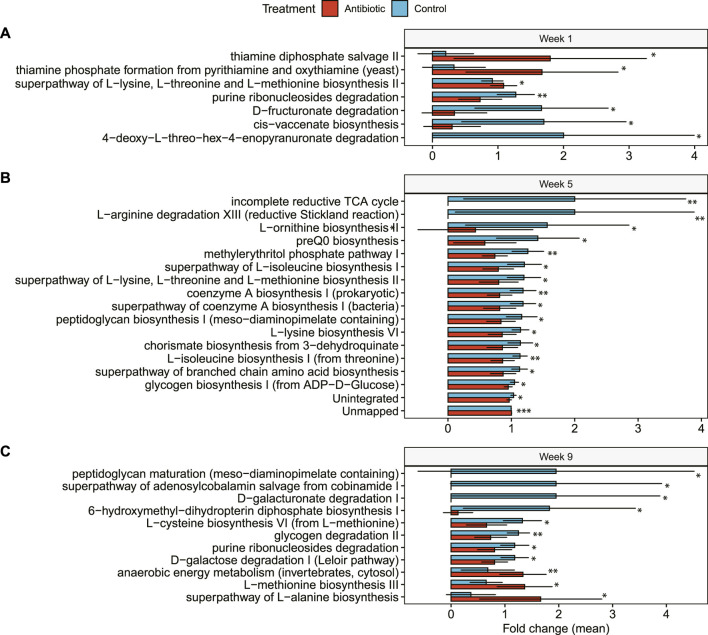
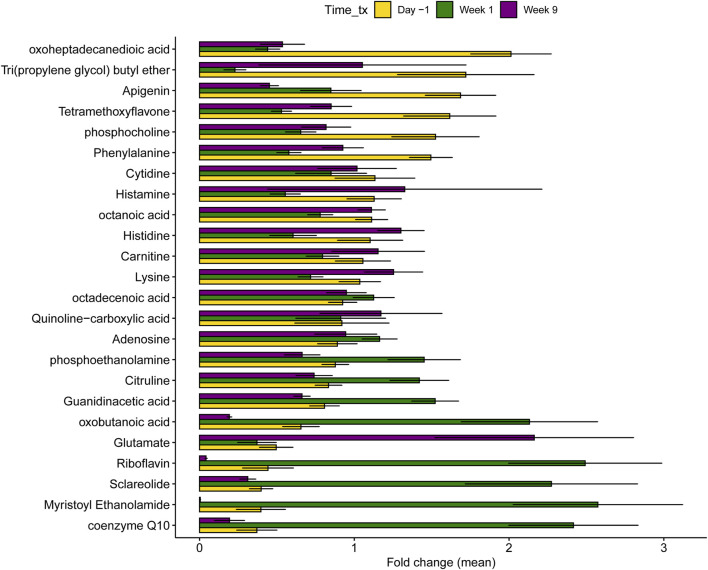
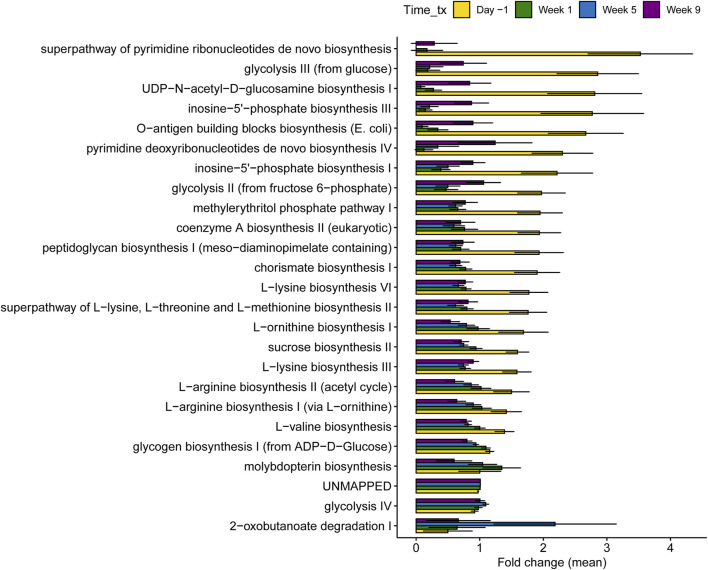
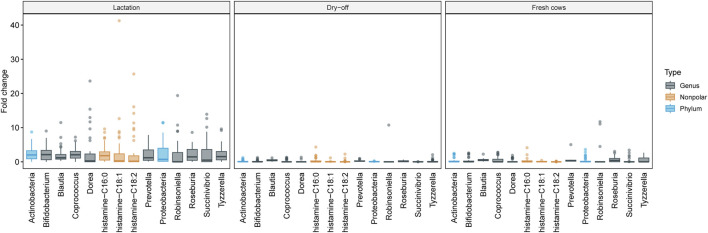
The gut microbiota in cattle is essential for protein, energy, and vitamin production and hence, microbiota perturbations can affect cattle performance. This study evaluated the effect of intramammary (IMM) ceftiofur treatment and lactation stage on the functional gut microbiome and metabolome. Forty dairy cows were enrolled at dry-off. Half received IMM ceftiofur and a non-antibiotic teat sealant containing bismuth subnitrate (cases), while the other half received the teat sealant (controls). Fecal samples were collected before treatment at dry off, during the dry period (weeks 1 and 5) and the first week after calving (week 9). Shotgun metagenomic sequencing was applied to predict microbial metabolic pathways whereas untargeted metabolomics was used identify polar and nonpolar metabolites. Compared to controls, long-term changes were observed in the cows given ceftiofur, including a lower abundance of microbial pathways linked to energy production, amino acid biosynthesis, and other vital molecules. The metabolome of treated cows had elevated levels of stachyose, phosphatidylethanolamine diacylglycerol (PE-DAG), and inosine a week after the IMM ceftiofur application, indicating alterations in microbial fermentation, lipid metabolism, energy, and cellular signaling. Differences were also observed by sampling, with cows in late lactation having more diverse metabolic pathways and a unique metabolome containing higher levels of histamine and histamine-producing bacteria. These data illustrate how IMM ceftiofur treatment can alter the functionality of the hindgut metabolome and microbiome. Understanding how antibiotics and lactation stages, which are each characterized by unique diets and physiology, impact the function of resident microbes is critical to define normal gut function in dairy cattle.

Keywords: antibiotic use; ceftiofur; gut microbiome; metabolomics; metagenomics.


Conflict of interest statement

The authors declare that the research was conducted in the absence of any commercial or financial relationships that could be construed as a potential conflict of interest. The author(s) declared that they were an editorial board member of Frontiers, at the time of submission. This had no impact on the peer review process and the final decision.

Figures

FIGURE 1
FIGURE 1
Diagram illustrating the animal treatment schedule and sample collections across the stages of lactation. The fecal sampling regimen coincided with three key lactation stages. These include: 1) the end of lactation (1 day before the initiation of dry cow therapy with intramammary (IMM) ceftiofur, or Day -1); 2) after dry cow therapy during the dry-off period (Weeks 1 and 5); and 3) 9 weeks after treatment at the end of the dry-off period and beginning of the fresh phase (Week 9). The black line demonstrates the fluctuations in milk production across each stage.
FIGURE 2
FIGURE 2
Summary of the methodology applied to analyze the functional gut microbiome of dairy cattle. Metagenomic sequencing (top panel) was used to characterize the microbial metabolic pathways, while metabolomics (bottom panel) was used to examine the metabolome composition among fecal samples collected from 40 dairy cows.
FIGURE 3
FIGURE 3
Fecal metabolome of dairy cows. The hierarchical clustering method Ward D2 was used to cluster rows (metabolites) and columns (samples) and only metabolites with library identification were included and aggregated at the class level. The color scale represents the logarithm (log) 10 of the relative abundance, with orange representing the most abundant metabolites and blue representing the least. Columns correspond to the samples, in which the time of collection (time_Tx) and IMM ceftiofur treatment status (Treatment) are indicated.
FIGURE 4
FIGURE 4
Alpha diversity of metabolites and microbial pathways. The top three panels show the number of observed features for (A) polar, (B) nonpolar, and (C) microbial metabolic pathways, while the bottom panels represent the Shannon index, for (D) polar, (E) nonpolar, and (F) microbial metabolic pathways, respectively. p-values were calculated with one-sided and paired t-test to compare treatment groups within a sampling point (black) or between time points regardless of treatment (gray). Each boxplot shows the median, lower, and upper quartiles with the whiskers representing extreme values in the distribution. Friedman’s test, which accounts for repeated measures, indicates significant fluctuations in alpha diversity over time.
FIGURE 5
FIGURE 5
Beta diversity of (A) polar and nonpolar metabolites; and (B) microbial pathways. PCoA of the Bray-Curtis dissimilarity is clustered by treatment and sampling point (ellipses contain at least 90% of the samples in a group). Control animals are indicated by circles, whereas the ceftiofur-treated animals are indicated by triangles within each plot.
FIGURE 6
FIGURE 6
Hindgut metabolites identified in dairy cows with IMM ceftiofur (antibiotic) treatment relative to the control group. Differences in the relative abundance of each metabolite are shown at (A) 1 week after treatment (Week 1) and (B) 9 weeks after treatment (Week 9). The bars in the figure represent the mean fold change along with the corresponding confidence interval. One-tailed Wilcoxon signed-rank test was used to compare the relative abundance and significance (p-value) is shown as **≤0.01, or *≤0.05. NCGC00380646-01 represents (E)-5-(4-methoxy-5-methyl-6-oxopyran-2-yl)-3-methylhex-4-enoic acid.
FIGURE 7
FIGURE 7
Differentially abundant microbial pathways in cows treated with IMM ceftiofur (antibiotic) compared to the control group. Differences in the relative abundance of each microbial pathway are shown at: (A) 1 week after IMM treatment (Week 1); (B) 5 weeks after treatment (Week 5); and (C) 9 weeks after treatment (Week 9). The bars in the figure represent the mean fold change along with the corresponding confidence interval. One-tailed Wilcoxon signed-rank test was used to compare the relative abundance and significance (p-value) is shown as **≤0.01, or *≤0.05.
FIGURE 8
FIGURE 8
Differentially abundant metabolites across the three samplings in all 40 dairy cows regardless of treatment status. Each sampling corresponds to different stages of lactation. Day -1 corresponds to late lactation, Week 1 to dry off, and Week 9 to fresh cows. Data from all animals was combined and not stratified by treatment status. The bars in the figure represent the mean fold change along with the corresponding confidence interval.
FIGURE 9
FIGURE 9
Differentially abundant microbial pathways across samplings in 40 dairy cows regardless of treatment status. The different samplings are shown and correspond to the different stages of lactation. Day -1 represents late lactation, while Week 1 and Week 9 represent the dry-off and fresh periods, respectively. The bars in the figure represent the mean fold change along with the corresponding confidence interval.
FIGURE 10
FIGURE 10
Metagenome and metabolome patterns by sampling period. This figure shows the variation in metagenome feature abundance at the genus and phylum levels as well as metabolome feature abundance across the sampling period. The samplings correspond to the Lactation (left panel), Dry-off (middle panel), and Fresh (right panel) periods. Emphasis is placed on features that are dominant in one sampling but nearly absent in others. These patterns were discerned using Hierarchical Clustering with the Ward D2 method. The Y-axis details the fold-change, compared to the average feature abundance across all samples. Boxplots encapsulate the median and interquartiles with whiskers indicating extreme values and marked outliers also presented.

Similar articles

References

    1. Albonico F., Barelli C. I., Albanese D., Manica M. I., Partel E., Rosso F., et al. (2020). Raw milk and fecal microbiota of commercial Alpine dairy cows varies with herd, fat content and diet. PLoS One 15, e0237262. 10.1371/journal.pone.0237262 - DOI - PMC - PubMed
    1. Alcock B. P., Raphenya A. R., Lau T. T. Y., Tsang K. K., Bouchard M., Edalatmand A., et al. (2020). CARD 2020: antibiotic resistome surveillance with the comprehensive antibiotic resistance database. Nucleic Acids Res. 48, D517–D525. 10.1093/nar/gkz935 - DOI - PMC - PubMed
    1. Anderson M. J. (2006). Distance-based tests for homogeneity of multivariate dispersions. Biometrics 62, 245–253. 10.1111/j.1541-0420.2005.00440.x - DOI - PubMed
    1. Ashina K., Tsubosaka Y., Nakamura T., Omori K., Kobayashi K., Hori M., et al. (2015). Histamine induces vascular hyperpermeability by increasing blood flow and endothelial barrier disruption in vivo . PLoS One 10, e0132367. 10.1371/journal.pone.0132367 - DOI - PMC - PubMed
    1. Bach A., Calsamiglia S., Stern M. D. (2005). Nitrogen metabolism in the rumen. J. Dairy Sci. 88, E9–E21. 10.3168/jds.S0022-0302(05)73133-7 - DOI - PubMed

LinkOut - more resources