. 2024 Sep 24;150(13):1010-1029.
doi: 10.1161/CIRCULATIONAHA.123.067606. Epub 2024 Jun 5.

IRE1α Mediates the Hypertrophic Growth of Cardiomyocytes Through Facilitating the Formation of Initiation Complex to Promote the Translation of TOP-Motif Transcripts

Affiliations

IRE1α Mediates the Hypertrophic Growth of Cardiomyocytes Through Facilitating the Formation of Initiation Complex to Promote the Translation of TOP-Motif Transcripts

Chao Li et al. Circulation. .

Abstract

Background: Cardiomyocyte growth is coupled with active protein synthesis, which is one of the basic biological processes in living cells. However, it is unclear whether the unfolded protein response transducers and effectors directly take part in the control of protein synthesis. The connection between critical functions of the unfolded protein response in cellular physiology and requirements of multiple processes for cell growth prompted us to investigate the role of the unfolded protein response in cell growth and underlying molecular mechanisms.

Methods: Cardiomyocyte-specific inositol-requiring enzyme 1α (IRE1α) knockout and overexpression mouse models were generated to explore its function in vivo. Neonatal rat ventricular myocytes were isolated and cultured to evaluate the role of IRE1α in cardiomyocyte growth in vitro. Mass spectrometry was conducted to identify novel interacting proteins of IRE1α. Ribosome sequencing and polysome profiling were performed to determine the molecular basis for the function of IRE1α in translational control.

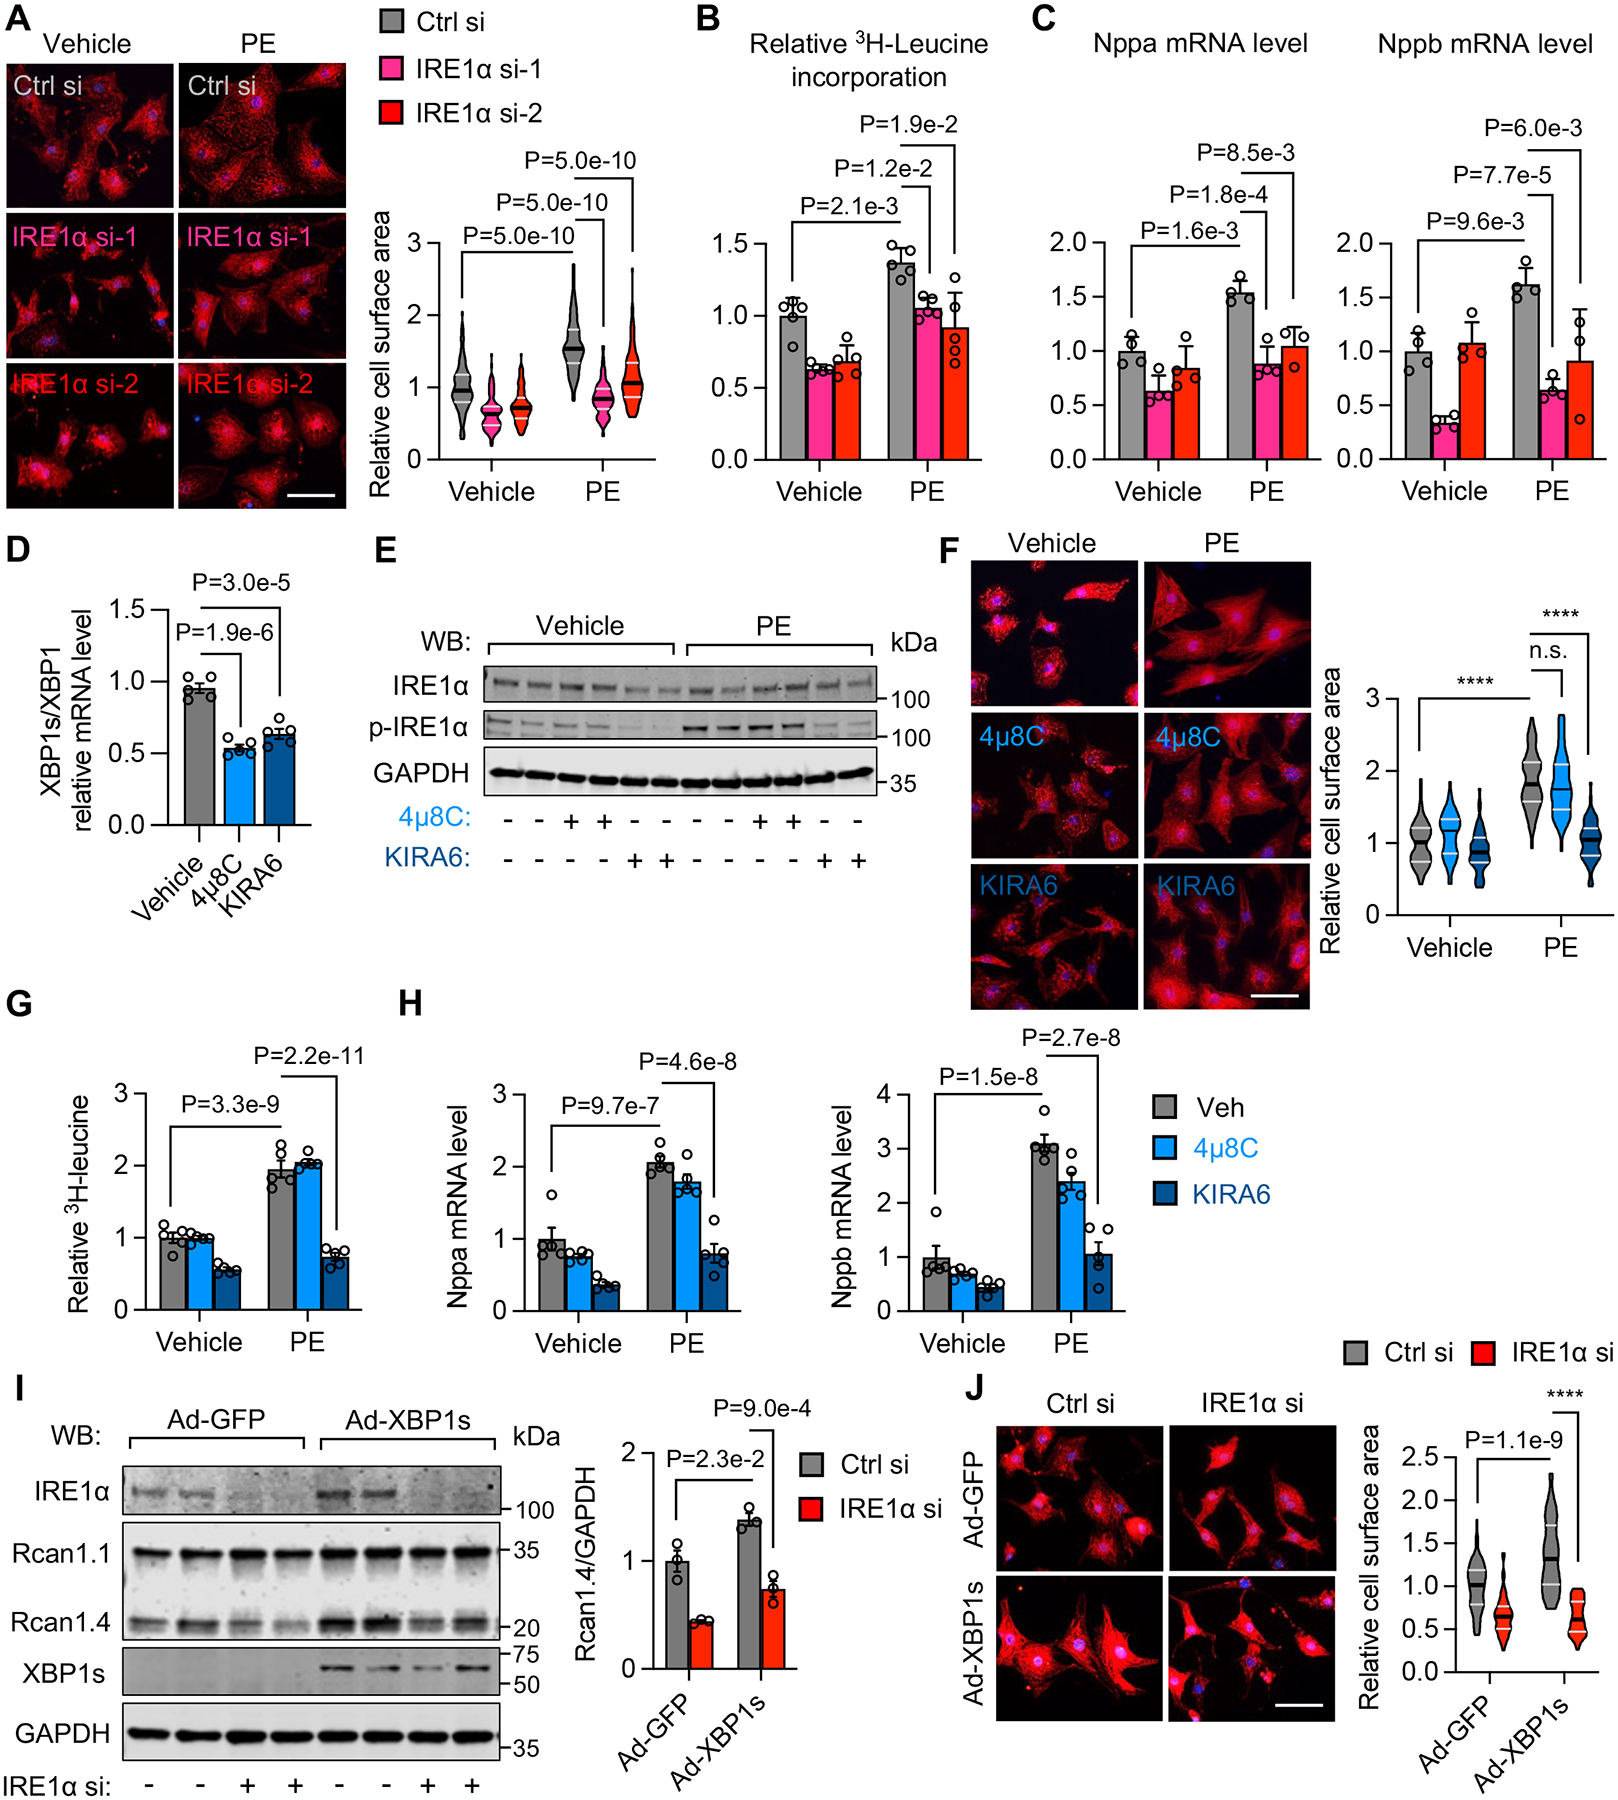
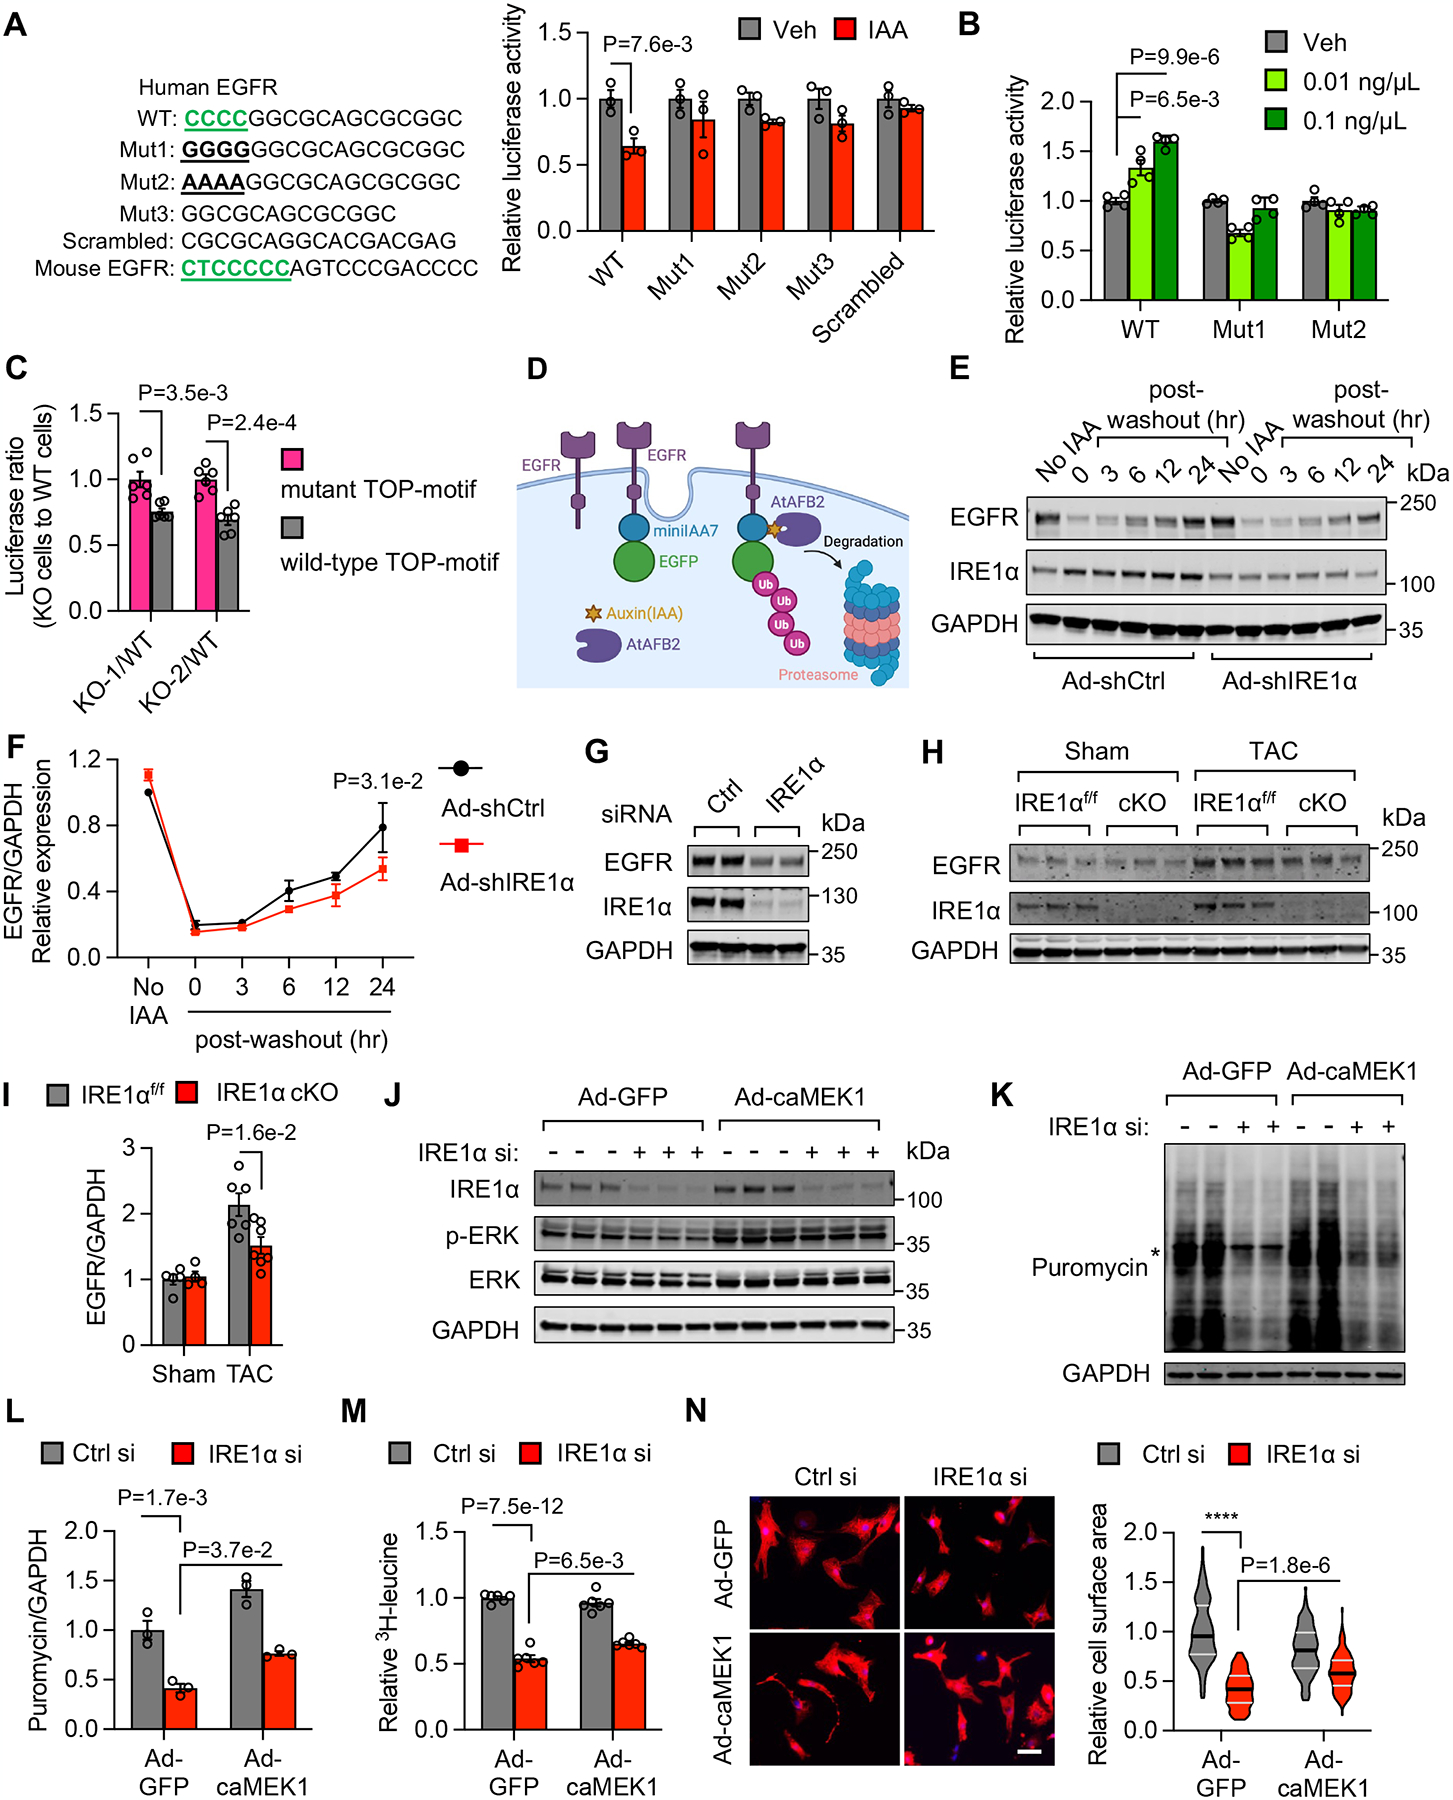
Results: We show that IRE1α is required for cell growth in neonatal rat ventricular myocytes under prohypertrophy treatment and in HEK293 cells in response to serum stimulation. At the molecular level, IRE1α directly interacts with eIF4G and eIF3, 2 critical components of the translation initiation complex. We demonstrate that IRE1α facilitates the formation of the translation initiation complex around the endoplasmic reticulum and preferentially initiates the translation of transcripts with 5' terminal oligopyrimidine motifs. We then reveal that IRE1α plays an important role in determining the selectivity and translation of these transcripts. We next show that IRE1α stimulates the translation of epidermal growth factor receptor through an unannotated terminal oligopyrimidine motif in its 5' untranslated region. We further demonstrate a physiological role of IRE1α-governed protein translation by showing that IRE1α is essential for cardiomyocyte growth and cardiac functional maintenance under hemodynamic stress in vivo.

Conclusions: These studies suggest a noncanonical, essential role of IRE1α in orchestrating protein synthesis, which may have important implications in cardiac hypertrophy in response to pressure overload and general cell growth under other physiological and pathological conditions.

Keywords: EGFR protein; eukaryonic initiation factor; heart failure; unfolded protein response.


Conflict of interest statement

None.

Figures

Figure 1.
Figure 1.. IRE1α promotes the growth of cardiomyocyte.
(A) IRE1α knockdown inhibited cardiomyocyte growth. Neonatal rat ventricular cardiomyocytes (NRVMs) were cultured in serum-free medium. IRE1α was silenced by siRNA transfection. Phenylephrine (PE) was used to induce cardiomyocyte growth for 24 hours. Immunofluorescence staining for α-actinin was conducted, and cell size was quantified. Two independent siRNAs against IRE1α were used. Scale bar: 50 μm. The number of cardiomyocytes quantified: vehicle, control siRNA, n=99; PE, control siRNA, n=81; vehicle, IRE1α si-1, n=100; PE, IRE1α si-1, n=101; vehicle, IRE1α si-2, n=101; PE, IRE1α si-2, n=100. (B) IRE1α knockdown decreased protein synthesis in NRVMs, as assayed by 3H-leucine incorporation. n=5. (C) IRE1α knockdown reduced the mRNA level of Nppa and Nppb after PE treatment in NRVMs. PE, IRE1α si-2, n=3; all other groups, n=4. (D) Both 4μ8c (1 μM) and KIRA6 (1 μM) treatments reduced the expression of XBP1s in NRVMs. Note that 4μ8c inhibits the RNase activity of IRE1α while KIRA6 inhabits the kinase activity of IRE1α. n=5. (E) KIRA6 but not 4μ8c inhibited IRE1α phosphorylation. (F) KIRA6 reduced cardiomyocyte growth. After PE stimulation, immunofluorescence staining for α-actinin was conducted, and cell size was determined. Scale bar: 50 μm. n=60 cardiomyocytes for each group. ****, P is close to zero. n.s., not significant. (G) KIRA6 but not 4μ8c decreased protein synthesis in NRVMs, as assayed by 3H-leucine incorporation. n=5. (H) KIRA6 treatment decreased the mRNA level of Nppa and Nppb, two molecular markers of cardiomyocyte hypertrophy. n=5. (I) XBP1s overexpression did not rescue the decreased expression of Rcan1.4 in NRVMs with IRE1α silencing after PE treatment for 24 hours. Rcan1.4 is a molecular marker of cardiomyocyte hypertrophic growth. Note that this experiment was conducted in the presence of PE. n=3. (J) XBP1s overexpression did not rescue the defect of cell growth from IRE1α silencing in NRVMs treated with PE for 24 hours. XBP1s was overexpressed by adenovirus infection. Immunofluorescence of α-actinin was performed. Cardiomyocyte size was then quantified. Note that this experiment was done in the presence of PE. n=60 cardiomyocytes for each group. Scale bar: 50 μm. ****, P is close to zero. Two-way ANOVA was conducted, followed by Tukey’s multiple comparison test for A, F, and J and Sidak’s multiple comparison test for B, C, and G through I. One-way ANOVA was conducted, followed by Tukey’s multiple comparison test for D. Data are represented as mean±SEM.
Figure 2.
Figure 2.. IRE1α deficiency represses protein synthesis in mammalian cells.
(A) IRE1α knockdown in cardiomyocytes diminished PE-induced protein synthesis. NRVMs were cultured in serum-free medium. IRE1α was silenced by siRNA transfection and treated by PE for 24 hours. Thirty minutes before harvesting, puromycin was added into medium to label newly synthesized proteins. Two independent siRNAs against IRE1α were used. n=4. (B) IRE1α knockout (KO) HEK293A cells showed a decrease in the rate of protein synthesis. IRE1α KO cells were generated by CRISPR/Cas9. Both control and knockout cells were serum-starved for 4 hours and then stimulated with FBS. Puromycin labeling assay was conducted. n=4. n.s., not significant. (C) Kinase activity of IRE1α was required for protein synthesis. IRE1α K599A knock-in and wild-type HEK293T cells were serum-starved for 4 hours and then stimulated with FBS (2 hours) for puromycin labeling assay. n=4. (D) RNase activity of IRE1α was dispensable for protein synthesis. IRE1α K907A knock-in and wild-type HEK293T cells were serum-starved for 4 hours and then stimulated with FBS for 2 hours. Puromycin labeling assay was conducted. n=4. (E) Schematic of generation of IRE1α-degron knock-in HEK293A cells. (F) Acute degradation of IRE1α reduced protein synthesis. IRE1α-degron cells were serum-starved for 4 hours with or without indole-3-acetic acid sodium (IAA) treatment and then stimulated with FBS for 1 hour. Puromycin labeling assay was conducted. n=4. (G) Acute degradation of IRE1α decreased 3H-leucine incorporation. n=3. Two-way ANOVA was conducted, followed by Sidak’s multiple comparison test for A through D, F, and G. Data are represented as mean±SEM.
Figure 3.
Figure 3.. IRE1α is required for cardiomyocyte growth in vivo.
(A) Representative histological images for heart sections from IRE1αf/f control and IRE1α conditional knockout (cKO) mice subjected to sham and mild transverse aortic constriction (mTAC) operations, respectively. A week after surgery, cardiac tissues were harvested for H&E (middle) and wheat germ agglutin (WGA, bottom) staining. Scale bar for whole heart, 0.5 cm; for H&E staining and WGA staining, 50 μm. (B) IRE1α cKO mice showed a defect in heart growth in response to pressure overload, as revealed by a decrease in ratio of heart weight/body weight (HW/BW). IRE1αf/f, sham, n=7; IRE1αf/f, TAC, n=18; IRE1α cKO, sham, n=8; IRE1α cKO, TAC, n=14. (C) Ratio of heart weight/tibia length was reduced in IRE1α cKO mice. IRE1αf/f, sham, n=7; IRE1αf/f, TAC, n=18; IRE1α cKO, sham, n=8; IRE1α cKO, TAC, n=14. (D) Cardiomyocyte size was decreased in IRE1α cKO hearts compared to IRE1αf/f control after mTAC. The number of cardiomyocytes quantified from WGA staining of (A): IRE1αf/f, sham, n=202; IRE1αf/f, TAC, n=222; IRE1α cKO, sham, n=220; IRE1α cKO, TAC, n=250. (E) Representative cardiac echocardiographic images. (F) Deficiency of IRE1α in the heart caused a decrease in ejection fraction, as measured from echocardiographic recordings. IRE1αf/f, sham, n=9; IRE1αf/f, TAC, n=11; IRE1α cKO, sham, n=7; IRE1α cKO, TAC, n=12. (G) Fractional shortening was reduced in the IRE1α cKO mice. IRE1αf/f, sham, n=9; IRE1αf/f, TAC, n=11; IRE1α cKO, sham, n=7; IRE1α cKO, TAC, n=12. (H) Cardiac IRE1α expression along different developmental stages. n=4. (I) IRE1α was induced in transgenic hearts. Double transgenic mice (TRE-IRE1α;αMHC-tTA) and controls (TRE-IRE1α or αMHC-tTA) were maintained on doxycycline-containing water. Upon switching to regular drinking water without doxycycline for 4 weeks, the heart was harvested for western blotting. Transgene IRE1α is Flag-tagged. (J) Cardiac specific overexpression of IRE1α led to hypertrophic growth as revealed by an increase in HW/BW. Wild-type, n=8; αMHC-tTA, n=10; TRE-IRE1α, n=8; double transgenics, n=7. (K) Representative histological images of control and IRE1α transgenic hearts. Cardiac tissues were harvested for H&E (middle) and WGA (bottom) staining. Scale bar for whole heart, 0.5 cm; for H&E staining and WGA staining, 50 μm. Overexpression of IRE1α in the heart increased cardiomyocyte growth, as quantified from WGA staining. The number of cardiomyocytes quantified from WGA staining: wild-type, n=202; αMHC-tTA, n=204; TRE-IRE1α, n=201; double transgenics, n=203. (L) Mutant IRE1α was induced in transgenic hearts. Double transgenic mice (TRE-IRE1α K907A or K599A;αMHC-tTA) and control animals were maintained on doxycycline-containing water. Upon switching to regular drinking water without doxycycline for 4 weeks, the heart was harvested for western blotting. Transgene mutant IRE1α is Flag-tagged. Note that K599A mutant IRE1α cannot be overexpressed in vivo. (M) Cardiac specific overexpression of K907A mutant IRE1α led to hypertrophic growth as revealed by an increase in HW/BW. n=7. (N) Representative histological images of control and K907A mutant IRE1α transgenic hearts. The number of cardiomyocytes quantified from WGA staining: WT (wild-type), n=100; K907A TG (transgenics), n=97. Two-way ANOVA was conducted, followed by Sidak’s multiple comparison test for B, C, F, and G and Tukey’s multiple comparison test for D. One-way ANOVA was conducted, followed by Dunnett’s multiple comparison test for H, J, and K. Unpaired Student’s t-test was conducted for M and N. Data are represented as mean ± SEM.
Figure 4.
Figure 4.. IRE1α interacts with the translation initiation complex.
(A) Schematic of identification of IRE1α-interacting proteins. IRE1α−/− MEFs reconstituted with WT HA-IRE1α were used. After FBS stimulation for 6 hours, IRE1α was precipitated by HA antibody for LC-MS/MS. (B) GO analysis showed that translation, especially translation initiation, was enriched in IRE1α-interacting proteins. (C) The list of IRE1α-interacting proteins that belong to the translation initiation complex. Enrichment after FBS stimulated is indicated by a scale of 2–18. (D) The association between IRE1α and initiation complex was confirmed by co-IP. HEK293A cells were transfected with Flag-IRE1α plasmids. (E) Proximity ligation assay (PLA) showed interactions between IRE1α and eIF3b, eIF3d, eIF3f, eIF3g, and eIF4G, respectively. Scale bar: 10 μm. (F) IRE1α interacted with eIF3b. Purified recombinant cytosolic IRE1α and eIF3b proteins were used to perform GST pulldown assay. (G) IRE1α interacted with eIF3g. Purified recombinant cytosolic IRE1α and eIF3g proteins were used to perform GST pulldown assay. (H) IRE1a interacted with eIF4G. Purified recombinant cytosolic IRE1α and C-terminal eIF4G proteins were used to perform GST pulldown assay. (I) Immunofluorescence staining showed co-localization of IRE1α with endogenous eIF3b and eIF4G. The T-REx293 stable cell line was used to induce the expression of GFP-tagged IRE1α. Images were captured at the Z-stack mode. Three-protein co-localization in 3-dimensional images was generated with the software Imaris. Scale bar: 5 μm.
Figure 5.
Figure 5.. IRE1α enhances formation of the translation initiation complex.
(A) Schematic of m7GTP pulldown assay. Endogenous IRE1α was located in the translation initiation complex, as revealed by m7GTP pulldown assays. (B) Interactions of eIF4G-eIF3b and eIF4G-eIF3g, respectively, were enhanced by IRE1α overexpression. HEK293A cells were transfected with indicated plasmids. Co-IP was conducted with myc antibody to precipitate eIF4G. Quantification was conducted using myc-eIF4G as internal control. (C) Interaction between eIF3b and eIF4G was diminished by IRE1α depletion. The IRE1α-degron knock-in HEK293A cells were treated with IAA to deplete IRE1α. Co-IP using eIF3b antibodies was then conducted. Quantification was performed with eIF3b as control. (D) Individual IRE1α mutants were used to test the relevance of different IRE1α activities in promoting formation of the translation initiation complex. Quantification was conducted with eIF3b as control. (E) IRE1α was required for FBS-induced increase of the translation initiation complex in MEFs. WT and IRE1α−/− MEFs were used for m7GTP pulldown assays. Quantification was performed according to eIF4E. (F) IRE1α silencing in HEK293A cells suppressed formation of the translation initiation complex, as assessed by m7GTP pulldown assays. Quantification was conducted using eIF4E as internal control.
Figure 6.
Figure 6.. IRE1α stimulates translation of TOP motif-containing genes.
(A) Schematic of the ribosome profiling assay. Each sample was subjected to both ribosome profiling (Ribo-seq) and RNA sequencing (RNA-seq). These data were then integrated to calculate translation efficiency (TE). (B) Read distribution from Ribo-seq for control and IRE1α knockdown samples. Ribosome-protected RNAs were decreased after IRE1α silencing, indicating repressed protein synthesis. Each dot represents a gene. (C) IRE1α knockdown decreased translation of TOP motif-containing genes. Each dot represents a gene. Eight representative genes are labeled in blue. (D) IRE1α knockdown decreased the footprint density of TOP motif-containing genes. TOP motif-containing genes were separated into multiple subgroups according to footprint density (RPKM), which were normalized to control sample. RPKM > 100, n=73; 20–100, n=67; 10–20, n=64; 5–10, n=73; 3–5, n=64. (E) Cloning of various 5’-UTR to luciferase reporter. The mutation is in the TOP motif. Relative ratio between KO and WT cells for promoter activity was reduced in WT 5’-UTR, not the TOP motif mutants for OXA1L, SSR2, and SMDT1. Mutant TOP-motif, KO-2/wild type, n=8; other groups, n=6. n.s., not significant. (F) Polysomal profiling under IRE1α silencing. Unpaired Student’s t-test was conducted for D and E. Data are represented as mean±SEM.
Figure 7.
Figure 7.. IRE1α translationally enhances the expression of EGFR.
(A) The putative TOP motif in EGFR 5’-UTR is underlined. The TOP motif was replaced by guanines in Mut 1, replaced by adenines in Mut 2, deleted in Mut 3, and reshuffled in scrambled mutant. Human EGFR 5’-UTR was derived from ENST00000342916.6 or ENST00000342916.7. Acute IRE1α depletion decreased the translational activity of EGFR 5’-UTR with WT TOP motif, not mutant ones. In vitro transcribed mRNAs containing different 5’-UTR were generated, purified, and transfected into degron-IRE1α HEK293A cells. IAA or vehicle was added. Luciferase assays were performed 4 hours later. n=3. (B) IRE1α increased the translational activity of EGFR 5’-UTR with WT TOP motif, not mutant ones. Purified recombinant IRE1α proteins and indicated mRNAs were added into Hela lysates. Luciferase assays were conducted after 5 hours of incubation. n=4. (C) EGFR 5’-UTR was cloned into a luciferase reporter. The mutation is located in the TOP motif. Relative ratio between KO and WT cells for promoter activity was reduced in WT EGFR 5’-UTR, not the TOP motif mutant. n=6. (D) Schematic of the degron-tagged EGFR knock-in A431 cell line. (E) IRE1α knockdown delayed the recovery of EGFR protein expression. EGFR-degron knock-in cells were infected with control and IRE1α shRNA adenovirus, respectively. One day later, cells were treated with IAA for 16 hours to deplete EGFR. At indicated times after IAA wash-out, cells were harvested, and EGFR protein expression was determined by western blotting. (F) Quantification of (E). n=3. (G) IRE1α silencing reduced protein level of EGFR in HEK293A cells. (H) EGFR protein expression was increased in control hearts after TAC. IRE1α deletion led to a significant decrease of EGFR protein expression. (I) Quantification of (H). IRE1αf/f, sham, n=5; IRE1αf/f, TAC, n=6; IRE1α cKO, sham, n=4; IRE1α cKO, TAC, n=7. (J) Constitutively active MEK1 (caMEK1) overexpression increased ERK phosphorylation under the condition of IRE1α knockdown in NRVMs. Cells were treated with PE for 30 minutes. (K) ERK activation by caMEK1 mildly increased protein synthesis under the condition of IRE1α silencing. Puromycin labeling was conducted, and western blotting was performed to detect puromycin labeled proteins. Asterisk (*) indicates GFP signal. (L) Quantification of (K). n=3. (M) ERK activation partially rescued the defect of protein synthesis from IRE1α silencing. 3H-leucine incorporation assay was conducted in NRVMs treated with PE (24 hours). n=6. (N) ERK activation by constitutively active caMEK1 mildly increased the size of cardiomyocytes under IRE1α knockdown. Immunofluorescence staining for α-actinin was conducted. Scale bar: 50 μm. The number of cardiomyocytes quantified: Ad-GFP, control siRNA, n=100; Ad-GFP, IRE1α si, n=100; Ad-caMEK1, control siRNA, n=99; Ad-caMEK1, IRE1α si, n=108. ****, P is close to zero. Unpaired Student’s t-test was conducted for A through C and F. Two-way ANOVA was conducted, followed by Sidak’s multiple comparison test for I, L, and M and Tukey’s multiple comparison test for N. Data are represented as mean±SEM.

References

    1. Tsao CW, Aday AW, Almarzooq ZI, Anderson CAM, Arora P, Avery CL, Baker-Smith CM, Beaton AZ, Boehme AK, Buxton AE, et al. Heart disease and stroke statistics-2023 update: A report from the American Heart Association. Circulation. 2023;147:e93–e621. doi: 10.1161/cir.0000000000001123 - DOI - PMC - PubMed
    1. Nakamura M, Sadoshima J. Mechanisms of physiological and pathological cardiac hypertrophy. Nat Rev Cardiol. 2018;15:387–407. doi: 10.1038/s41569-018-0007-y - DOI - PubMed
    1. Maillet M, van Berlo JH, Molkentin JD. Molecular basis of physiological heart growth: fundamental concepts and new players. Nat Rev Mol Cell Biol. 2013;14:38–48. doi: 10.1038/nrm3495 - DOI - PMC - PubMed
    1. Walter P, Ron D. The unfolded protein response: from stress pathway to homeostatic regulation. Science. 2011;334:1081–1086. doi: 10.1126/science.1209038 - DOI - PubMed
    1. Hetz C, Zhang K, Kaufman RJ. Mechanisms, regulation and functions of the unfolded protein response. Nat Rev Mol Cell Biol. 2020;21:421–438. doi: 10.1038/s41580-020-0250-z - DOI - PMC - PubMed

MeSH terms