Review
. 2024 May 31;73(Suppl 1):S1-S21.
doi: 10.33549/physiolres.935377. Epub 2024 May 31.

From the Pineal Gland to the Central Clock in the Brain: Beginning of Studies of the Mammalian Biological Rhythms in the Institute of Physiology of the Czech Academy of Sciences

Affiliations
Review

From the Pineal Gland to the Central Clock in the Brain: Beginning of Studies of the Mammalian Biological Rhythms in the Institute of Physiology of the Czech Academy of Sciences

H Illnerová. Physiol Res. .

Abstract

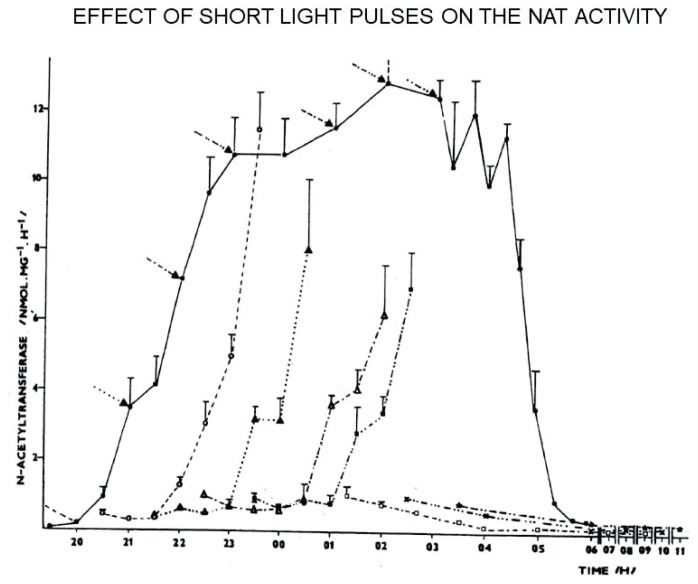
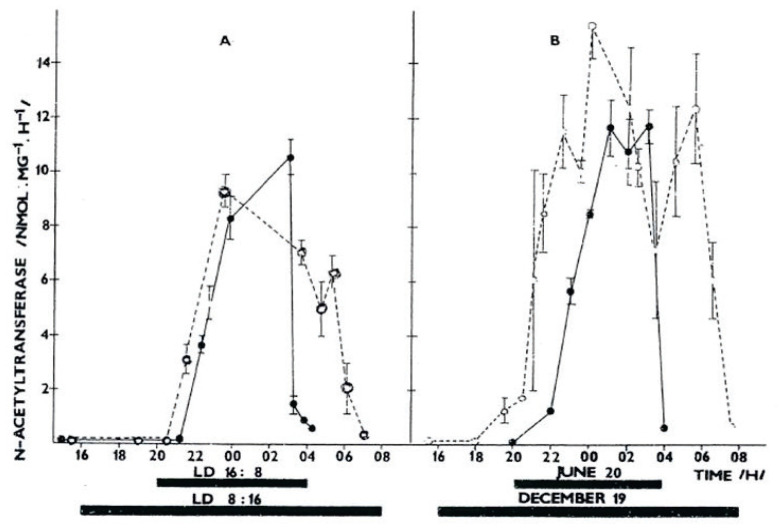
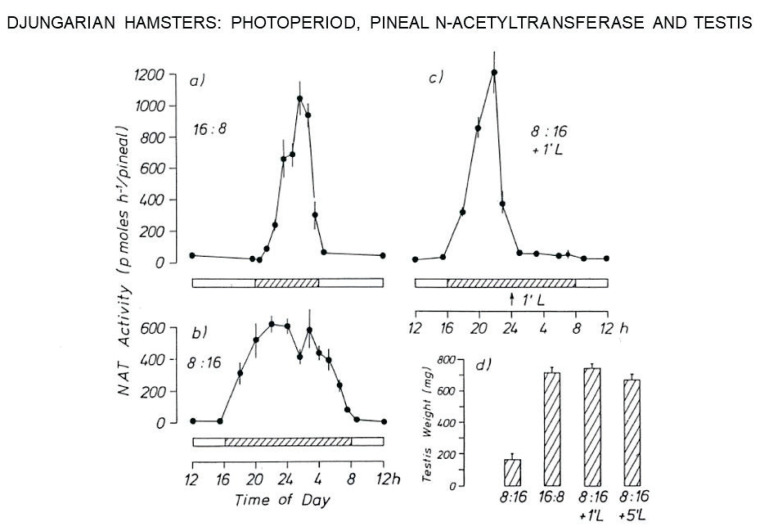
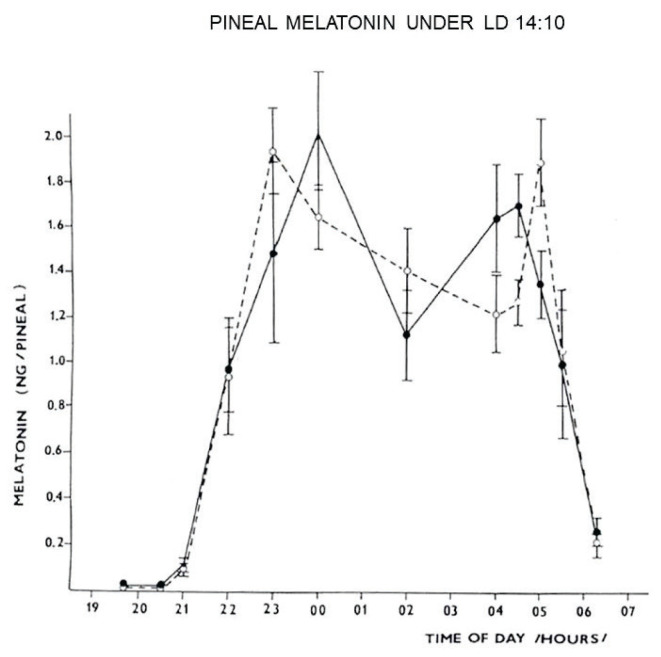
The Institute of Physiology of the Czech Academy of Sciences (CAS) has been involved in the field of chronobiology, i.e., in research on temporal regulation of physiological processes, since 1970. The review describes the first 35 years of the research mostly on the effect of light and daylength, i.e., photoperiod, on entrainment or resetting of the pineal rhythm in melatonin production and of intrinsic rhythms in the central biological clock. This clock controls pineal and other circadian rhythms and is located in the suprachiasmatic nuclei (SCN) of the hypothalamus. During the early chronobiological research, many original findings have been reported, e.g. on mechanisms of resetting of the pineal rhythm in melatonin production by short light pulses or by long exposures of animals to light at night, on modulation of the nocturnal melatonin production by the photoperiod or on the presence of high affinity melatonin binding sites in the SCN. The first evidence was given that the photoperiod modulates functional properties of the SCN and hence the SCN not only controls the daily programme of the organism but it may serve also as a calendar measuring the time of a year. During all the years, the chronobiological community has started to talk about "the Czech school of chronobiology". At present, the today´s Laboratory of Biological Rhythms of the Institute of Physiology CAS continues in the chronobiological research and the studies have been extended to the entire circadian timekeeping system in mammals with focus on its ontogenesis, entrainment mechanisms and circadian regulation of physiological functions. Key words: Pineal, Melatonin, AA-NAT rhythm, Light entrainment, Photoperiod, SCN clock.


Conflict of interest statement

Conflict of Interest: There is no conflict of interest.

Figures

Fig. 1
Fig. 1
A: End of the pathway leading to melatonin synthesis in the pineal gland [5]. B: The circadian rhythm in N-acetyltransferase activity in the rat pineal gland. The black bar under the abcissa indicates the duration of the dark period. Data were taken from [10].
Fig. 2
Fig. 2
The effect of a sudden light at night on the pineal serotonin content. Rats maintained in LD 12:12 were exposed to light at night after 4 h in darkness and killed after 13, 24 and 40 min on light (open columns). Some of the rats were left all the time in darkness and killed at the beginning or at the end of the experiment (dark columns). Numbers under the abcissa denote time in min since the start of the experiment. Data were taken from [11].
Fig. 3
Fig. 3
The effect of a sudden light at night on the pineal melatonin content. Rats maintained in LD 12:12 were exposed to light at night after 5 h in darkness and killed at different times on light (circles). Some of the rats were left in darkness and killed at the beginning and end of the experiment in darkness (squares). Data were taken from [17].
Fig. 4
Fig. 4
The N-acetyltransferase (NAT) rhythm in the course of the night when 1 min light pulses were presented. Rats maintained in LD 12:12, with lights on from 06 to 18 h, were either unpulsed (filled circles) or exposed to a 1 min light pulse at 20 h (open circles), or at 21 h (filled triangles), or at 22 h (open triangles), or at 23 h (filled squares), or at 01 h (open squares), or at 02 h (crosses), or at 03 h (asterisks) and from that time on they were kept in darkness until they were killed. Arrows indicate times of the pulse presentation and point to the NAT activity in darkness at the moment of the light pulse. Data were taken from [21,22] and the picture was modulated from that in [23].
Fig. 5
Fig. 5
Phase delays of the N-acetyltransferase (NAT) rhythm after 1 min light pulses applied before midnight. A: The NAT rhythm after presentation of a 1 min light pulse at 21 h. Rats maintained in LD 12:12 with lights on from 06 h to 18 h, were either exposed to a 1 min light pulse (open circles, broken line) or left unpulsed (filled circles, full line). Thereafter, they were released into constant darkness and killed during the night when they were pulsed (day 0), or 1 (day 1), or 4 days (day 4) after the pulse presentation. B: Phase delays of the evening NAT rise (E) and of the morning NAT decline (M) during the night when rats were pulsed and after 1 and 4 days. Phase shifts were determined at the level of 3 nmol/mg.h of the NAT activity from Fig. 5 A and other similar figures and they were plotted as a function of time when the pulses were presented. Phase delays were plotted with the sign −. The abcissa denotes time of the pulse administration. Data were taken from [10, 22, 23].
Fig. 6
Fig. 6
Phase advances of the N-acetyltransferase (NAT) rhythm after 1 min light pulses applied after midnight. A: The NAT rhythm after presentation of a I min light pulse at 03 h. Rats maintained in LD 12:12, with lights on from 06 to 18 h, were either exposed to the 1 min light pulse (open circles, broken line) or left unpulsed (filled circles, full line). Thereafter, they were released into constant darkness and killed during the night when they were pulsed (day 0), or 1 day (day 1), or 4 days (day 4) after the pulse presentation. B: Phase shifts of the of the evening NAT rise (E) and of the morning NAT decline (M) during days 1 and 4 were determined at the level of 3 nmol/mg.h of the NAT activity from Fig. 6A and other similar figures and they were plotted as a function of time when the pulses were applied. Phase advances were plotted with the sign +, phase delays with the sign −. The abcissa denotes time of the pulse presentation. The data are taken from [10, 22].
Fig. 7
Fig. 7
Phase delays of the N-acetyl-transferase (NAT) rhythm after delays of the evening lights off. A: The NAT rhythm during the night when the lights-off was delayed (day 0) and during the next night (day 1). Rats maintained in LD 12:12, with lights on from 06 h to 18 h, were subjected either to the expected lights-off (filled circles, full line), or to a delay of the lights-off till 22 h (open circles, broken line) or till 02 h (filled squares, dotted line), respectively. Thereafter, they were released into darkness. Lines under the abcissa indicate dark periods. B: Phase delays of the evening NAT rise (E) and of the morning NAT decline (M) of the experimental animals relative to the control ones determined at the level of 3 nmol/mg.h of the NAT activity from Fig. 7A and other similar figures. The abcissa denotes time of the onset of darkness on day 0. Data were taken from [31].
Fig. 8
Fig. 8
Phase shifts of the N-acetyltransferase (NAT) rhythm after bringing forward the morning lights-on. A: The NAT rhythm during the night when the lights-on was brought forward (day 0) and during the next night (day 1). Rats maintained in LD 12:12, with lights on from 06 h to 18 h, were subjected to the usual lights-off at 18 h and later that night either to the usual morning lights-on at 06 h (filled circles, full line), or to an advance of the lights-on to 01 h (open circles, broken line), or to 23 h (filled squares, dotted line), respectively (day 0). Thereafter, light was turned off at 14 h and the NAT rhythm was followed during the subsequent night (day 1). Lines under the abcissa indicate dark periods. B: Phase shifts of the evening NAT rise (E) and of the morning NAT decline (M) the next night after bringing forward the morning lights-on, determined at the level of 3 nmol/mg.h of the NAT activity from Fig. 8A and other similar figures. Phase advances are expressed with the sign +, phase delays with the sign −. The abcissa denotes time of the light onset on day 0. Data were taken from [31].
Fig. 9
Fig. 9
The N-acetyltransferase rhythm in rats maintained under artificial light-dark regimes (A) or in natural daylight (B). Filled circles represent rats kept for 5 weeks in LD 16:8 (A) or rats kept in natural daylight and killed on June 20 (B). Open circles represent rats maintained for 5 weeks in LD 8:16 (A) or rats maintained in natural daylight and killed on December 19 (B). Data were taken from [32].
Fig. 10
Fig. 10
Diurnal rhythm of N-acetyltransferase (NAT) activity in pineals of Djungarian hamsters under different photoperiods (a–c) and effects of such photoperiods on testicular recrudescence (d). NAT activity profile a) in long photoperiods (LD 16:8); b) in short photoperiods (LD 8:16); c) in short photoperiods in which the dark period was interrupted by 1 min of light each night. d) Testis weight after 45 days in the photoperiods indicated. Open horizonal bars in (a–c) represent light, hatched bars darkness. Note similarity of patterns in (a) and (c) and similarity of effect of LD 16:8, LD 8:16 + 1 min light and LD 8:16 + 5 min light in 3(d). Data were taken from [35].
Fig. 11
Fig. 11
Profiles of the rhythm in pineal melatonin concentration in Djungarian hamsters under LD 14:10. Djungarian hamsters maintained under LD 16:8 (closed circles) or under LD 8:16 (open circles) were transferred to LD 14:10 and killed 10 weeks later. Data were taken from [48].
Fig. 12
Fig. 12
Testis (1) and accessory gland (seminal vesicles, coagulating glands and ampullary glands) (2) weight in Djungarian hamsters under LD 14:10. Djungarian hamsters maintained in LD 16:8 (open bars) or in LD 8:16 (closed bars) were transferred to LD 14:10 and killed 10 weeks later (stripped bars). Data were taken from [48].
Fig. 13
Fig. 13
Resetting of the suprachiasmatic nucleus (SCN) rhythm in light induced c-Fos immune-reactivity. Rats maintained in LD 12:12 (night 0) were either untreated (circles) or exposed to a 1 h of light (squares) from 23 to 24 h before midnight (left) or from 02 to 03 h after midnight (right) (night 1) and then they were released into darkness. The next night (night 2), they were exposed to a single 30 min light pulse at different nighttimes, returned to darkness and killed 30 min later for c-Fos immunoreactivity determination. Filled bars under the abcissa indicate dark periods. Data were taken from [58].
Fig. 14
Fig. 14
Light induced c-fos gene expression in the SCN under long and short photoperiods. Rats were maintained under a long, LD 16:8 photoperiod, with lights on from 04 till 20 h, or under a short, LD 8:16 photoperiod, with lights on from 08 to 16 h. On the day of the experiment, the evening onset of darkness was advanced to 12 h or the morning onset of light was delayed to 12 h, respectively, and the rats were exposed to a single 30 min light pulse at different times in darkness. At the end of the pulse, they were killed and phase-dependent photic induction of c-fos mRNA was assayed by in situ hybridization in the SCN of rats maintained previously under the long (circles) or under the short (squares) photoperiod. Bars under the abcissa represent original periods of darkness under the long or under the short photoperiod. Data were taken from [56].
Fig. 15
Fig. 15
Daily profiles of arginine vasopressin (AVP) mRNA levels in the SCN of rats maintained either under a long, LD 16:8 (circles) or under a short, LD 8:16 (squares) photoperiod. Bars under the abcissa represent dark periods. Data were taken from [72].
Fig. 16
Fig. 16
The effect of melatonin on the evening rise in the light-induced c-Fos immunoreactivity in the suprachiasmatic nucleus of rats maintained originally under a short, LD 8:16 (left) or under a long, LD16:8 (right) photoperiod. On the day of the experiment, the dark period started at 16 h. Rats were either left intact (open triangles, dotted line) or injected with vehicle (open circles, broken line) or with melatonin (closed circles, full line) in the late subjective day, i.e., between 16.30 h and 17.00 h (left) and between 17:30 and 18.00 h (right), respectively. Thereafter, they were exposed to a single 30 min light pulse at various times, returned to darkness and 30 min later they were killed for c-Fos immunoreactivity determination. Data were taken from [89].

Similar articles

References

    1. Fiske VM, Bryant GK, Putnam J. Effect of light on the weight of the pineal in the rat. Endocrinology. 1960;66:489–491. doi: 10.1210/endo-66-3-489. - DOI
    1. Quay WB. Cellular and Physiological Mechanisms. Charles C Thomas; Springfield, Illinois: 1974. Pineal Chemistry; pp. 1–430.
    1. Lerner AB, Case JD, Takahashi Y, Lee TH, Mori W. Isolation of melatonin, the pineal gland factor that lightens melanocytes. J Am Chem Soc. 1958;80:2587–2591. doi: 10.1021/ja01543a060. - DOI
    1. Lerner AB, Case JD, Heinzelman RV. Structure of melatonin. J Am Chem Soc. 1959;81:6084–6088. doi: 10.1021/ja01531a060. - DOI
    1. Arendt J. Melatonin and the Mammalian Pineal Gland. Chapman C Hall; London: 1995. pp. 1–321.