. 2024 Oct;20(10):2255-2274.
doi: 10.1080/15548627.2024.2362122. Epub 2024 Jun 6.

The novel lnc-HZ12 suppresses autophagy degradation of BBC3 by preventing its interactions with HSPA8 to induce trophoblast cell apoptosis

Affiliations

The novel lnc-HZ12 suppresses autophagy degradation of BBC3 by preventing its interactions with HSPA8 to induce trophoblast cell apoptosis

Jingsong Zhao et al. Autophagy. 2024 Oct.

Abstract

Abnormal expression of long non-coding RNAs (lncRNAs) is associated with the dysfunctions of human trophoblast cells and the occurrence of miscarriage (abnormal early embryo loss). BBC3/PUMA (BCL2 binding component 3) plays significant roles in regulation of cell apoptosis. However, whether specific lncRNAs might regulate BBC3 in trophoblast cells and further induce apoptosis and miscarriage remains completely unclear. Through screening, we identified a novel lnc-HZ12, which was significantly highly expressed in villous tissues of recurrent miscarriage (RM) patients relative to their healthy control (HC) group. Lnc-HZ12 suppressed chaperone-mediated autophagy (CMA) degradation of BBC3, promoted trophoblast cell apoptosis, and was associated with miscarriage. In mechanism, lnc-HZ12 downregulated the expression levels of chaperone molecules HSPA8 and LAMP2A in trophoblast cells. Meanwhile, lnc-HZ12 (mainly lnc-HZ12-SO2 region in F2 fragment) and HSPA8 competitively bound with the 169RVLYNL174 patch on BBC3, which prevented BBC3 from interactions with HSPA8 and impaired the formation of BBC3-HSPA8-LAMP2A complex for CMA degradation of BBC3. Thus, lnc-HZ12 upregulated the BBC3-CASP9-CASP3 pathway and induced trophoblast cell apoptosis. In villous tissues, lnc-HZ12 was highly expressed, CMA degradation of BBC3 was suppressed, and the apoptosis levels were higher in RM vs HC villous tissues, all of which were associated with miscarriage. Interestingly, knockdown of murine Bbc3 could efficiently suppress placental apoptosis and alleviate miscarriage in a mouse miscarriage model. Taken together, our results indicated that lnc-HZ12 and BBC3 played important roles in trophoblast cell apoptosis and miscarriage and might act as attractive targets for miscarriage treatment.Abbreviation: 7-AAD: 7-aminoactinomycin D; BaP: benzopyrene; BBC3/PUMA: BCL2 binding component 3; ChIP: chromatin immunoprecipitation; CHX: cycloheximide; CMA: chaperone-mediated autophagy; CQ: chloroquine; DMSO: dimethyl sulfoxide; GAPDH: glyceraldehyde-3-phosphate dehydrogenase; HC: healthy control; HSPA8: heat shock protein family A (Hsp70) member 8; IP: immunoprecipitation; LAMP2A: lysosomal associated membrane protein 2; LncRNA: long non-coding RNA; mRNA: messenger RNA; MT: mutant-type; NC: negative control; NSO: nonspecific oligonucleotide; PARP1: poly(ADP-ribose) polymerase 1; RIP: RNA immunoprecipitation; RM: recurrent miscarriage; TBP: TATA-box binding protein; WT: wild-type.

Keywords: Apoptosis; BBC3/PUMA-CASP9-CASP3; chaperone-mediated autophagy (CMA); human trophoblast cells; lncRNA or lnc-HZ12; recurrent miscarriage villous tissues.


Conflict of interest statement

No potential conflict of interest was reported by the author(s).

Figures
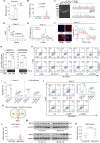
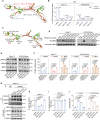
Figure 1.
Figure 1.
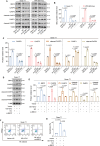
A novel lnc-HZ12 was highly expressed in RM vs HC villous tissues and promoted trophoblast cell apoptosis by upregulating the BBC3 pathway. (A) The relative expression levels of lnc -20,099 in transcriptome sequencing data of RM and HC villous tissues (n = 2). Data are mean ± s.D.; two-tailed Student’s t-test. (B) RT-qPCR analysis of the RNA levels of lnc -20,099 in HC and RM villous tissues (each n = 50). Data were mean ± s.D.; two-tailed Student’s t-test. (C) RACE assay analysis of the full-length sequence of lnc -20,099. Data are representatives of three independent experiments. (D and E) Polyribosome profile assay analysis of the binding of lnc-HZ12 with polyribosomes in Swan 71 cells. Data are mean ± s.D.; n = 3 independent experiments. (F) RNA FISH assay analysis of the distribution of lnc-HZ12 in Swan 71 cells and a linear trace through the image. Data are representatives; n = 3 independent experiments. (G) ChIP assay analysis of the levels of promoter region of lnc-HZ12 enriched by TBP in Swan 71 or HTR-8/SVneo cells, with IgG as negative control. Data are representatives or mean ± s.D.; n = 3 independent experiments, two-tailed Student’s t-test. (H and I) Flow cytometry analysis and the quantification of the apoptosis (the sum of early and late apoptosis) rates in lnc-HZ12-overexpressed or -silenced trophoblast cells stained with PE ANXA5–7-AAD. Data were representatives or mean ± s.D.; n = 3 independent experiments, two-tailed Student’s t-test and one-way ANOVA analysis. (J) Flow cytometry analysis and the quantification of the apoptosis (the sum of early and late apoptosis) rates of Swan 71 cells with TBP overexpression and/or Z-VAD-FMK treatment, or TBP knockdown and/or PAC-1 treatment. Cells were stained with PE ANXA5–7-AAD. Data are representatives or mean ± s.D.; n = 3 independent experiments, one-way ANOVA analysis. NC, negative control of siRNA. (K) The significantly upregulated mRnas in the intersection of mRNA sequencing data of RM vs HC villous tissues and lnc-HZ12-overexpressed Swan 71 cells vs control cells. (L) RT-qPCR analysis of the mRNA levels of BBC3 in HC and RM villous tissues (each n = 50). Data are mean ± s.D.; two-tailed Student’s t-test. (M and N) Western blot analysis of BBC3 protein levels in HC and RM villous tissues and their relative quantification (each n = 12). Data are representatives or mean ± s.D.
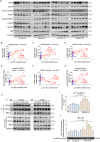
Figure 2.
Figure 2.
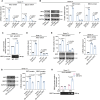
A novel lnc-HZ12 was highly expressed in RM vs HC villous tissues and promoted trophoblast cell apoptosis by upregulating BBC3 pathway. (A)Western blot analysis of the protein levels of BBC3, CASP9, CASP3, cleaved-CASP3, PARP1, and cleaved-PARP1 in Swan 71 and HTR-8/SVneo cells with overexpression or knockdown of lnc-HZ12. Data were representatives of three independent experiments. (B) The relative intensity levels of BBC3 protein bands in Swan 71 or HTR-8/SVneo cells with overexpression or knockdown of lnc-HZ12 were quantified by ImageJ and plotted. Data are mean ± s.D.; n = 3 independent experiments, two-tailed Student’s t-test and one-way ANOVA analysis. NC, negative control of siRNA. (C) The relative intensity levels of CASP9, CASP3, cleaved-CASP3, PARP1, and cleaved-PARP1 protein bands in Swan 71 cells with overexpression or knockdown of lnc-HZ12 were quantified by ImageJ and plotted. Data are mean ± s.D.; n = 3 independent experiments, two-tailed Student’s t-test and one-way ANOVA analysis. NC, negative control of siRNA. (D) The protein levels of BBC3, CASP9, CASP3, cleaved-CASP3, PARP1, and cleaved-PARP1 in Swan 71 cells with lnc-HZ12 overexpression, BBC3 knockdown, or both. Data were representatives of three independent experiments. (E) The relative intensity levels of BBC3, CASP9, CASP3, cleaved-CASP3, PARP1, and cleaved-PARP1 protein bands in Swan 71 cells with lnc-HZ12 overexpression, BBC3 knockdown, or both were quantified by ImageJ and plotted. Data are mean ± s.D.; n = 3 independent experiments, one-way ANOVA analysis. NC, negative control of siRNA. (F) Flow cytometry analysis of the apoptosis (the sum of early and late apoptosis) rates of Swan 71 cells with lnc-HZ12 overexpression, BBC3 knockdown, or both. Cells were stained with PE ANXA5–7-AAD. Data are representatives of three independent experiments. NC, negative control of siRNA. (G) Flow cytometry analysis of the apoptosis (the sum of early and late apoptosis) rates of Swan 71 cells with lnc-HZ12 overexpression, BBC3 knockdown, or both. Cells were stained with PE ANXA5–7-AAD. Data were mean ± s.D.; n = 3 independent experiments, one-way ANOVA analysis. NC, negative control of siRNA.
Figure 3.
Figure 3.
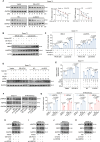
Lnc-HZ12 promoted BBC3 mRNA transcription. (A and B) the mRNA (A) and protein (B) levels of BBC3 or IRF2 in Swan 71 cells with overexpression or knockdown of IRF2. (C) ChIP assays to detect the interaction of BBC3 promoter with IRF2. (D and E) the mRNA (D) and protein (E) levels of IRF2 in Swan 71 cells with overexpression or knockdown of lnc-HZ12. (F and G) the mRNA (E) and protein (F) levels of BBC3 in Swan 71 cells transfected with lnc-HZ12 plasmid, IRF2 siRNA, or both. (H) ChIP assays to detect the interaction of BBC3 promoter with IRF2 in lnc-HZ12-overexpressed Swan 71 cells.
Figure 4.
Figure 4.
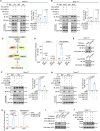
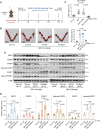
Lnc-HZ12 suppressed CMA degradation of BBC3. (A) BBC3 protein levels in lnc-HZ12-overexpressed or -silenced Swan 71 cells with cycloheximide (CHX) treatment. The relative intensity levels of protein bands were quantified by ImageJ and were fit to a one-phase decay equation using GraphPad Prism v 8.0 to give protein half-lives. Data were representatives or mean ± s.D.; n = 3 independent experiments. (B and C) the protein levels of BBC3 and LAMP2A in cell lysates and the isolated lysosomes of lnc-HZ12-overexpressed or -silenced Swan 71 cells. The relative intensity levels of protein bands were quantified by ImageJ and plotted. Data were representatives or mean ± s.D.; n = 3 independent experiments, one-way ANOVA analysis. (D and E) the protein levels of BBC3 in lnc-HZ12-overexpressed or -silenced Swan 71 cells treated with MG132, CQ, or NH4Cl. The relative intensity levels of protein bands were quantified by ImageJ and plotted. Data are representatives or mean ± s.D.; n = 3 independent experiments, one-way ANOVA analysis. (F and G) the protein levels of HSPA8 and LAMP2A in Swan 71 or HTR-8/SVneo cells with overexpression or knockdown of lnc-HZ12. The relative intensity levels of protein bands were quantified by ImageJ and plotted. Data were representatives or mean ± s.D.; n = 3 independent experiments, two-tailed Student’s t-test and one-way ANOVA analysis. (H) The protein levels of HSPA8 and BBC3 in Swan 71 cells with lnc-HZ12 overexpression, HSPA8 knockdown, or both. (I) The protein levels of LAMP2A and BBC3 in Swan 71 cells with lnc-HZ12 overexpression, LAMP2A knockdown, or both. (J) The protein levels of HSPA8 and BBC3 in Swan 71 cells with knockdown of lnc-HZ12 or HSPA8, or both. (K) The protein levels of LAMP2A and BBC3 in Swan 71 cells with knockdown of lnc-HZ12 or LAMP2A, or both. Data were representatives of three independent experiments. NC, negative control of siRNA.
Figure 5.
Figure 5.
Lnc-HZ12 impaired BBC3:HSPA8 interactions by binding with 169RVLYNL174 patch on BBC3. (A)IP assays using anti-His-tag for detection of the interactions of His-HSPA8 with MYC-BBC3 in lnc-HZ12-overexpressed or -silenced Swan 71 cells. The original protein levels were shown in cell lysate. MYC-BBC3:His-HSPA8 ratios were calculated based on their relative intensity of protein bands as determined by ImageJ. Data are representatives or mean ± s.D.; n = 3 independent experiments, two-tailed Student’s t-test. (B) IP assays using anti-MYC-tag for detection of the interactions of MYC-BBC3 with His-HSPA8 in lnc-HZ12-overexpressed or -silenced Swan 71 cells. The original protein levels were shown in cell lysate. His-HSPA8:MYC-BBC3 ratios were calculated based on their relative intensity of protein bands as determined by ImageJ. Data are representatives or mean ± s.D.; n = 3 independent experiments, two-tailed Student’s t-test. (C) A scheme showed that lnc-HZ12 impaired the interactions between BBC3 and HSPA8, which suppressed the formation of BBC3-HSPA8-LAMP2A complex and thus weakened BBC3 degradation. (D) RIP assays for detection of the interactions of BBC3 or HSPA8 with lnc-HZ12 in Swan 71 or HTR-8/SVneo cells. Data are mean ± s.D.; n = 3 independent experiments, two-tailed Student’s t-test. (E) RNA affinity-isolation assays using lnc-HZ12-SO (specific oligonucleotide) probe for detection of the interactions of lnc-HZ12 with MYC-BBC3 or His-HSPA8 in Swan 71 cells, with NSO (non-specific oligonucleotide) probe as control. Data are representatives of three independent experiments. (F and G) IP assays using anti-His-tag (F) or anti-MYC-tag (G) for detection of the interactions of His-HSPA8 with MYC-BBC3-WT or MYC-BBC3-MT in Swan 71 cells with overexpression of lnc-HZ12, MYC-BBC3-WT, or MYC-BBC3-MT, or both of lnc-HZ12 and BBC3. The original protein levels were shown in cell lysate. MYC-BBC3:His-HSPA8 or His-HSPA8:MYC-BBC3 ratios were calculated based on their relative intensity of protein bands as determined by ImageJ. Data are representatives or mean ± s.D.; n = 3 independent experiments, two-tailed Student’s t-test. (H) RIP assays for detection of the interactions of lnc-HZ12 with MYC-BBC3-WT or MYC-BBC3-MT in trophoblast cells with overexpression of MYC-BBC3-MT or MYC-BBC3-WT. Data are mean ± s.D.; n = 3 independent experiments, one-way ANOVA analysis. (I) RNA affinity-isolation assays for detection of the interactions of lnc-HZ12 with MYC-BBC3-MT or MYC-BBC3-WT in trophoblast cells with overexpression of MYC-BBC3-MT or MYC-BBC3-WT. Data are representatives of three independent experiments. (J) The protein levels of MYC-BBC3 in Swan 71 cells with rapamycin treatment and overexpression of MYC-BBC3-MT or MYC-BBC3-WT and lnc-HZ12. Data are representatives; n = 3 independent experiments.
Figure 6.
Figure 6.
The fragment 2 (F2) in lnc-HZ12 interacted with BBC3 protein and suppressed its interactions with HSPA8. (A) Lnc-HZ12 was divided into three fragments, named HZ12-F1, HZ12-F2, and HZ12-F3. (B) RIP assays for detection of the interactions of HZ12-F1, HZ12-F2, or HZ12-F3 with BBC3 in Swan 71 or HTR-8/SVneo cells treated with RNase T1. Data are mean ± s.D.; n = 3 independent experiments, two-tailed Student’s t-test. (C) Six lnc-HZ12-SO1–6 probes were combined with different regions of lnc-HZ12. SO, specific oligonucleotide. (D) RNA affinity-isolation assays for detection of the interactions of BBC3 with each of six HZ12-SO regions in Swan 71 or HTR-8/SVneo cells. Data are representatives of three independent experiments. (E and F) the protein levels of LAMP2A, HSPA8, and BBC3 in Swan 71 or HTR-8/SVneo cells with overexpression of lnc-HZ12, HZ12-F2, or HZ12-F3. The relative intensity levels of protein bands were quantified by ImageJ and plotted. Data are representatives or mean ± s.D.; n = 3 independent experiments, one-way ANOVA analysis. (G-I) IP assays using anti-HSPA8 for detection of the interactions of HSPA8 with BBC3 or LAMP2A in Swan 71 cells with overexpression of lnc-HZ12, HZ12-F2, or HZ12-F3. The original protein levels were shown in cell lysate. The relative intensity levels of protein bands were quantified by ImageJ and plotted. Data are representatives or mean ± s.D.; n = 3 independent experiments, one-way ANOVA analysis. (J) Quantification of flow cytometry analysis of the apoptosis (the sum of early and late apoptosis) rates of trophoblast cells with overexpression of lnc-HZ12, HZ12-F2, or HZ12-F3. Cells were stained with PE ANXA5–7-AAD. Data are mean ± s.D.; n = 3 independent experiments, one-way ANOVA analysis.
Figure 7.
Figure 7.
Lnc-HZ12 might promote trophoblast cell apoptosis by upregulating BBC3 pathway in RM villous tissues. (A) The protein levels of CASP9, CASP3, cleaved-CASP3, PARP1, cleaved-PARP1, HSPA8, LAMP2A, and TBP in HC and RM villous tissues (each n = 12). Data are representatives of three independent experiments. (B-G) Pearson correlation analysis of the relative levels of BBC3 protein ~ lnc-HZ12 (n = 12, B), CASP9 protein ~ lnc-HZ12 (n = 12, C), CASP3 protein ~ lnc-HZ12 (n = 12, D), cleaved-CASP3 protein ~ lnc-HZ12 (n = 12, E), PARP1 protein ~ lnc-HZ12 (n = 12, F), and cleaved-PARP1 protein ~ lnc-HZ12 (n = 12, G) in HC (blue, round) and RM (red, square) villous tissues. (H) IP assay analysis of the protein interactions of HSPA8 with BBC3 or LAMP2A in HC and RM villous tissues (n = 6). The original protein levels were shown in cell lysate. Data are representatives of three independent experiments. (I) RIP assay analysis of the interactions of lnc-HZ12 with BBC3 in HC and RM villous tissues (n = 5). Data are mean ± s.D., two-tailed Student’s t-test. (J) TBP ChIP assay analysis of the levels of lnc-HZ12 promoter region enriched by TBP in HC and RM villous tissues (n = 6), with IgG as negative control. Data are representatives or mean ± s.D., two-tailed Student’s t-test. RM, recurrent miscarriage group; HC, healthy control group; n, the number of biologically independent samples.
Figure 8.
Figure 8.
Knockdown of murine Bbc3 could efficiently alleviate miscarriage in a mouse miscarriage model. (A) The scheme of a miscarriage intervention model. (B) Embryo resorption (indicated by red arrows) and the average miscarriage rates in BaP-exposed mouse miscarriage model with AS-Bbc3 treatment (scale bar: 1 cm) (n = 12). AS, antisense. Data are representatives or mean ± s.D.; n = 12 independent experiments, one-way ANOVA analysis. (C) The mRNA levels of Bbc3 in BaP-exposed mouse miscarriage model with AS-Bbc3 treatment. Data are mean ± s.D.; n = 12 independent experiments, one-way ANOVA analysis. (D and E) the protein levels of murine BBC3, CASP9, CASP3, cleaved-CASP3, PARP1, and cleaved-PARP1 in placenta of BaP-exposed mouse miscarriage model with AS-Bbc3 treatment. The relative intensity levels of protein bands were quantified by ImageJ and plotted. Data are representatives or mean ± s.D.; n = 6 independent experiments, one-way ANOVA analysis.
Figure 9.
Figure 9.
Lnc-HZ12 regulatory mechanism. In RM villous tissues, TBP-mediated lnc-HZ12 transcription was enhanced and lnc-HZ12 expression levels were upregulated. Lnc-HZ12 downregulated HSPA8 and LAMP2A protein levels, interacted with BBC3 to prevent BBC3 from interaction with HSPA8, and thus suppressed CMA degradation of BBC3. Therefore, lnc-HZ12 upregulated the BBC3-CASP9-CASP3 pathway and promoted trophoblast cell apoptosis, which might further induce miscarriage.

References

    1. Soulet D, Gagnon B, Rivest S, et al. A fluorescent probe of polyamine transport accumulates into intracellular acidic vesicles via a two-step mechanism. J Biol Chem. 2004;279(47):49355–49366. doi: 10.1074/jbc.M401287200 - DOI - PubMed
    1. Wei G, Hobbs CA, DeFeo K, et al. Polyamine-mediated regulation of protein acetylation in murine skin and tumors. Mol Carcinog. 2007;46(8):611–617. doi: 10.1002/mc.20350 - DOI - PubMed
    1. Umehara N, Tanaka T.. The incidence of various antiphospholipid antibodies, measured by commercial-based laboratory, with recurrent spontenous abortion and the impact of their profiles on reproductive outcome with active anticoagulant therapy. ISRN Obstet Gynecol. 2012;2012(3):819356. doi: 10.5402/2012/819356 - DOI - PMC - PubMed
    1. Rugg-Gunn PJ. Epigenetic features of the mouse trophoblast. Reprod Biomed Online. 2012;25(1):21–30. doi: 10.1016/j.rbmo.2012.01.012 - DOI - PubMed
    1. Tang D, Kang R, Berghe TV, et al. The molecular machinery of regulated cell death. Cell Res. 2019;29(5):347–364. doi: 10.1038/s41422-019-0164-5 - DOI - PMC - PubMed

Publication types