

Identification of disulfidptosis-associated genes and characterization of immune cell infiltration in thyroid carcinoma
- PMID: 38836761
- PMCID: PMC11210228
- DOI: 10.18632/aging.205897
Identification of disulfidptosis-associated genes and characterization of immune cell infiltration in thyroid carcinoma
Abstract
Objective: The primary objective of this study is to conduct a comprehensive screening and analysis of differentially expressed genes related to disulfidoptosis (DEDRGs) in thyroid carcinoma (THCA). This entails delving into the intricate characterization of immune cell infiltration within the THCA context and subsequently formulating and validating a novel prognostic model.
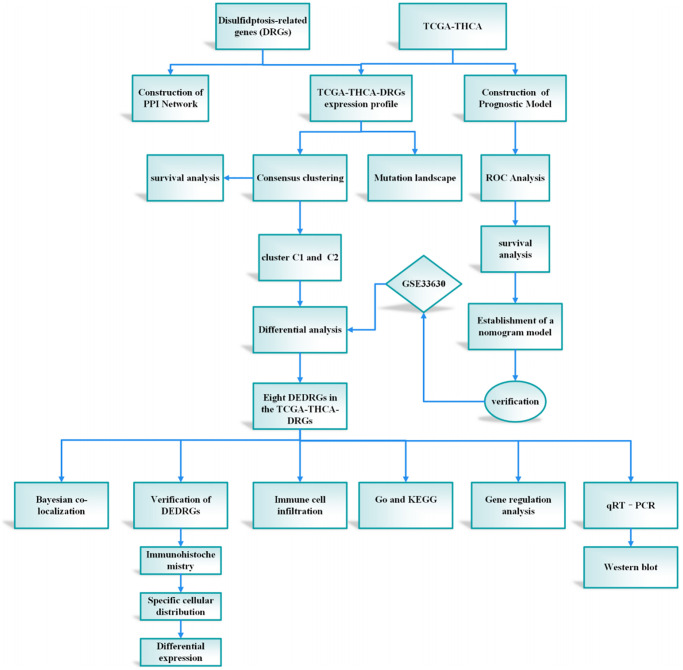
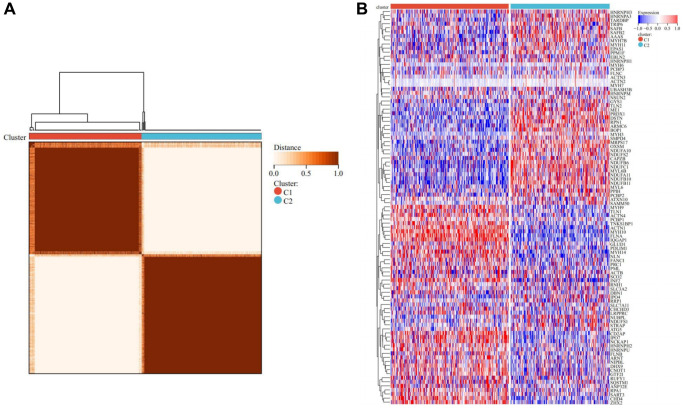
Method: To achieve our objectives, we first delineated two distinct subtypes of disulfidoptosis-related genes (DRGs) via consensus clustering methodology. Subsequently, employing the limma R package, we identified the DEDRGs critical for our investigation. These DEDRGs underwent meticulous validation across various databases, alongside an in-depth analysis of gene regulation. Employing functional enrichment techniques, we explored the potential molecular mechanisms underlying disulfidoptosis in THCA. Furthermore, we scrutinized the immune landscape within the two identified subtypes utilizing CIBERSORT and ESTIMATE algorithms. The construction of the prognostic model for THCA entailed intricate methodologies including univariate, multivariate Cox regression, and LASSO regression algorithms. The validity and efficacy of our prognostic model were corroborated through Kaplan-Meier survival curves and ROC curves. Additionally, a nomogram was meticulously formulated to facilitate the prediction of patient prognosis. To fortify our findings, we conducted a comprehensive Bayesian co-localization analysis coupled with rigorous in vitro experimentation, aimed at unequivocally establishing the validity of the identified DEDRGs.
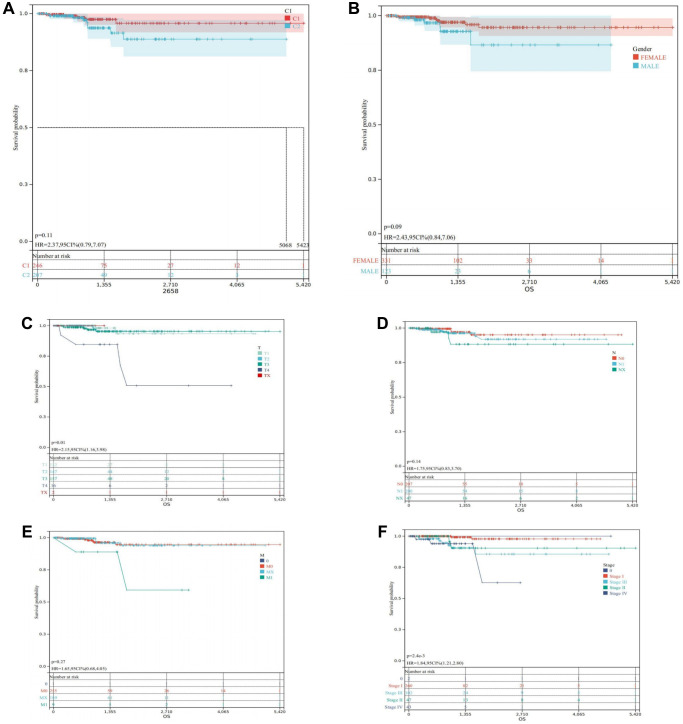
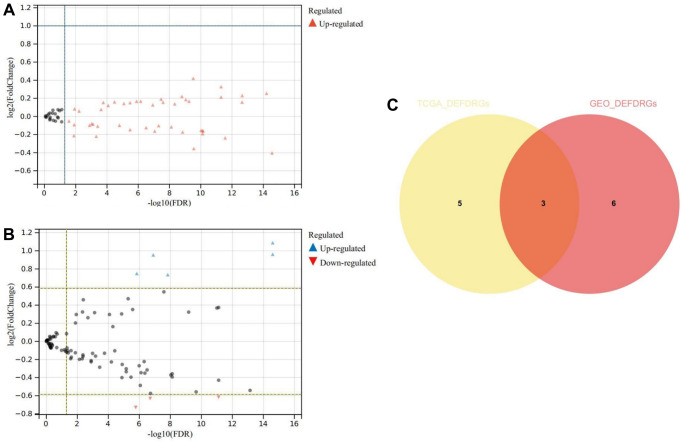
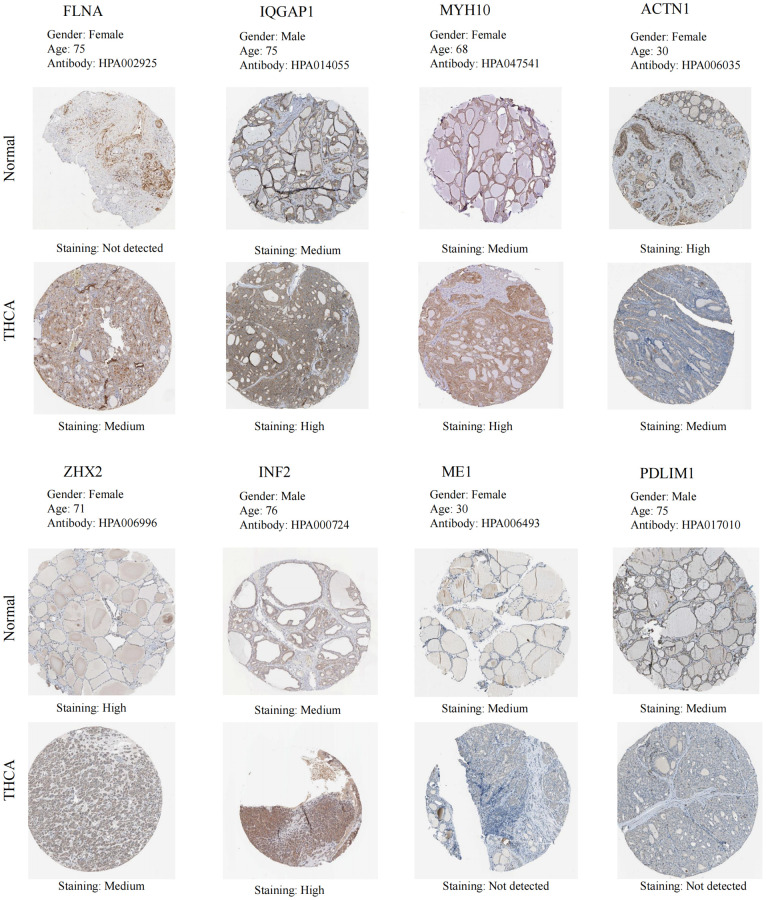
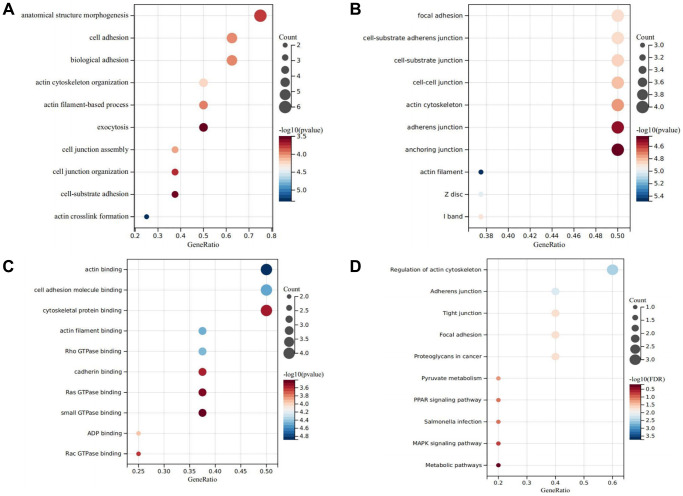
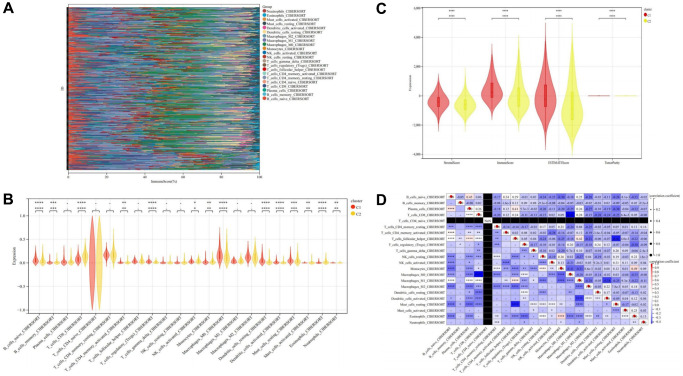
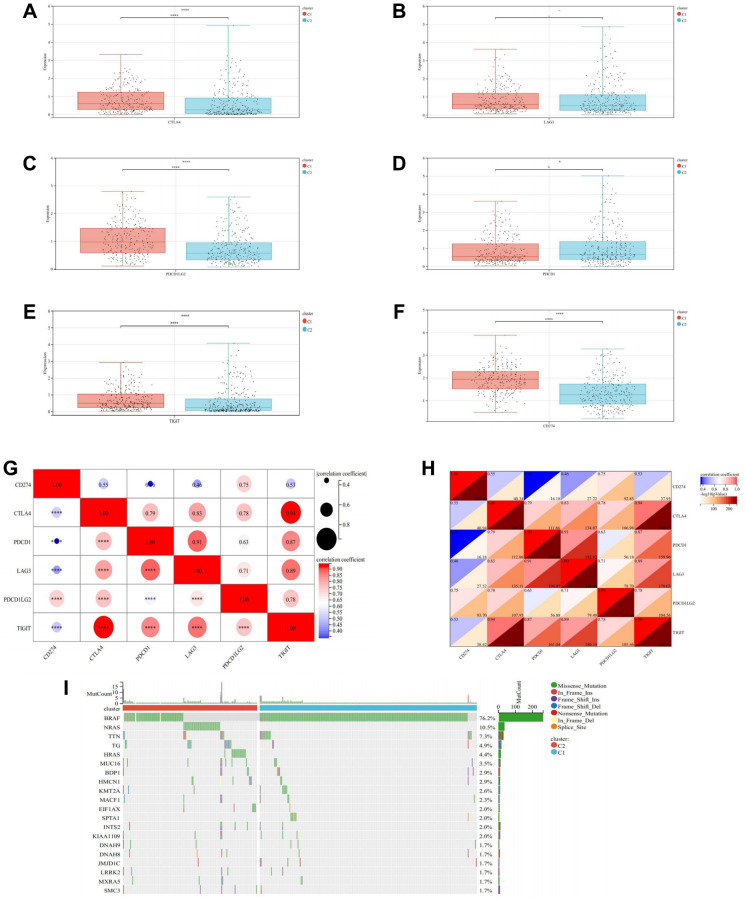
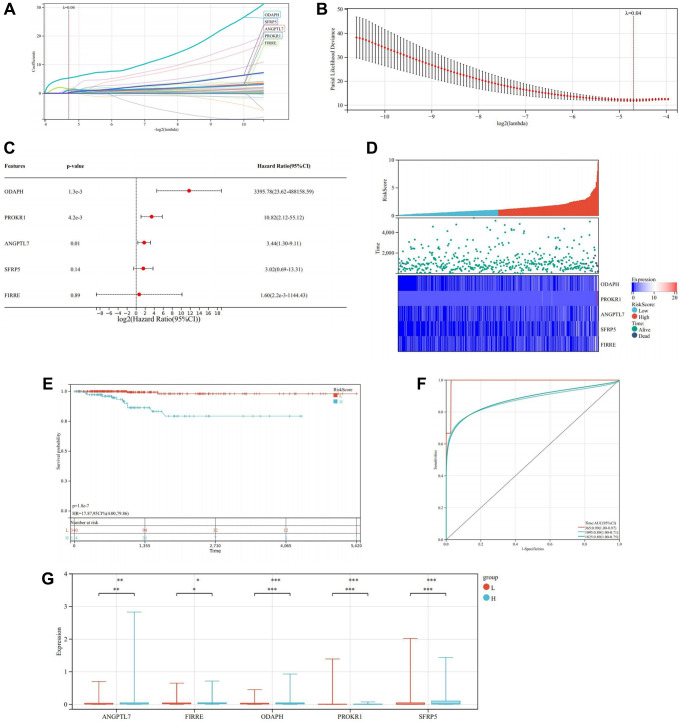
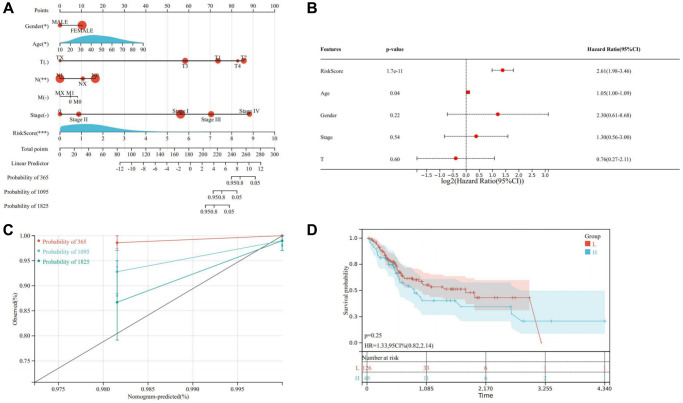
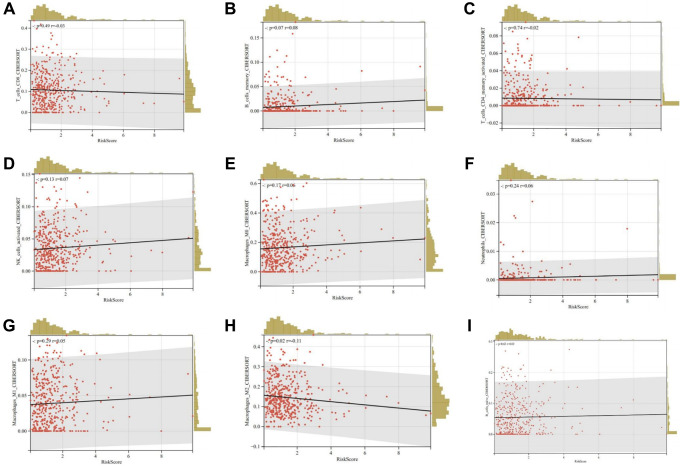
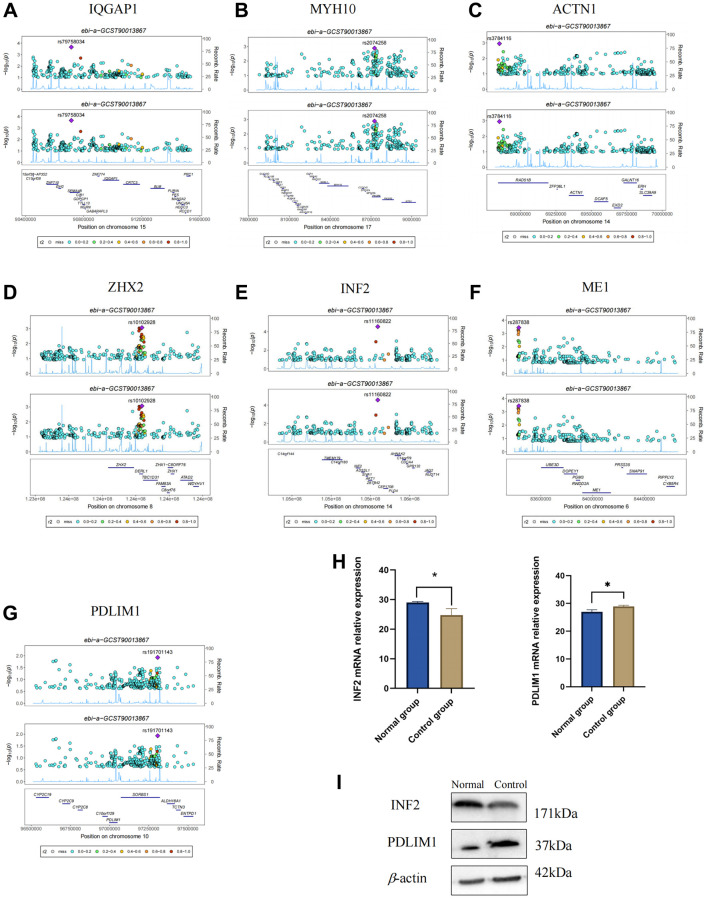
Result: Our analyses unveiled Cluster C1, characterized by elevated expression levels of DEDRGs, as harboring a favorable prognosis accompanied by abundant immune cell infiltration. Correlation analyses underscored predominantly positive associations among the DEDRGs, further affirming their significance in THCA. Differential expression patterns of DEDRGs between tumor samples and normal tissues were evident across the GEPIA and HPA databases. Insights from the TIMER database underscored a robust correlation between DEDRGs and immune cell infiltration. KEGG analysis elucidated the enrichment of DEDRGs primarily in pivotal pathways including MAPK, PPAR signaling pathway, and Proteoglycans in cancer. Furthermore, analyses using CIBERSORT and ESTIMATE algorithms shed light on the crucial role played by DEDRGs in shaping the immune microenvironment. The prognostic model, anchored by five genes intricately associated with THCA prognosis, exhibited commendable predictive accuracy and was intricately linked to the tumor immune microenvironment. Notably, patients categorized with low-risk scores stood to potentially benefit more from immunotherapy. The validation of DEDRGs unequivocally underscores the protective role of INF2 in THCA.
Conclusion: In summary, our study delineates two discernible subtypes intricately associated with DRGs, revealing profound disparities in immune infiltration and survival prognosis within the THCA milieu. The implications of our findings extend to potential treatment strategies for THCA patients, which could entail targeted interventions directed towards DEDRGs and prognostic genes, thereby influencing disulfidptosis and the immune microenvironment. Moreover, the robust predictive capability demonstrated by our prognostic model, based on the five genes (ANGPTL7, FIRRE, ODAPH, PROKR1, SFRP5), underscores its potential clinical utility in guiding personalized therapeutic approaches for THCA patients.
Keywords: disulfidptosis; immune cell infiltration; prognostic model; thyroid carcinoma.
Conflict of interest statement
Figures
Similar articles
-
Immunotyping of thyroid cancer for clinical outcomes and implications.Cancer Immunol Immunother. 2025 May 26;74(7):221. doi: 10.1007/s00262-025-04061-9. Cancer Immunol Immunother. 2025. PMID: 40418400 Free PMC article.
-
The expression of CCL17 and potential prognostic value on tumor immunity in thyroid carcinoma based on bioinformatics analysis.Sci Rep. 2024 Dec 30;14(1):31580. doi: 10.1038/s41598-024-75750-1. Sci Rep. 2024. PMID: 39738081 Free PMC article.
-
Prognostic value of EMT-related genes and immune cell infiltration in thyroid carcinoma.Front Immunol. 2024 Nov 4;15:1463258. doi: 10.3389/fimmu.2024.1463258. eCollection 2024. Front Immunol. 2024. PMID: 39559351 Free PMC article.
-
Phosphorus Metabolism-Related Genes Serve as Novel Biomarkers for Predicting Prognosis in Bladder Cancer: A Bioinformatics Analysis.Iran J Public Health. 2024 Sep;53(9):1935-1950. doi: 10.18502/ijph.v53i9.16449. Iran J Public Health. 2024. PMID: 39429662 Free PMC article. Review.
-
Advances in the study of disulfidptosis in digestive tract tumors.Discov Oncol. 2025 Feb 15;16(1):186. doi: 10.1007/s12672-025-01875-y. Discov Oncol. 2025. PMID: 39954025 Free PMC article. Review.
Cited by
-
Bioinformatics analysis of genes associated with disulfidptosis in spinal cord injury.PLoS One. 2025 Feb 14;20(2):e0318016. doi: 10.1371/journal.pone.0318016. eCollection 2025. PLoS One. 2025. PMID: 39951434 Free PMC article.
-
Development and functional validation of a disulfidoptosis-related gene prognostic model for lung adenocarcinoma based on bioinformatics and experimental validation.Front Immunol. 2025 Feb 10;16:1540578. doi: 10.3389/fimmu.2025.1540578. eCollection 2025. Front Immunol. 2025. PMID: 39995671 Free PMC article.
References
-
- Liu X, Olszewski K, Zhang Y, Lim EW, Shi J, Zhang X, Zhang J, Lee H, Koppula P, Lei G, Zhuang L, You MJ, Fang B, et al. Cystine transporter regulation of pentose phosphate pathway dependency and disulfide stress exposes a targetable metabolic vulnerability in cancer. Nat Cell Biol. 2020; 22:476–86. 10.1038/s41556-020-0496-x - DOI - PMC - PubMed
Publication types
MeSH terms
Substances
LinkOut - more resources
Full Text Sources
Medical
