

Resolving spatial response heterogeneity in glioblastoma
- PMID: 38837060
- PMCID: PMC11445274
- DOI: 10.1007/s00259-024-06782-y
Resolving spatial response heterogeneity in glioblastoma
Abstract
Purpose: Spatial intratumoral heterogeneity poses a significant challenge for accurate response assessment in glioblastoma. Multimodal imaging coupled with advanced image analysis has the potential to unravel this response heterogeneity.
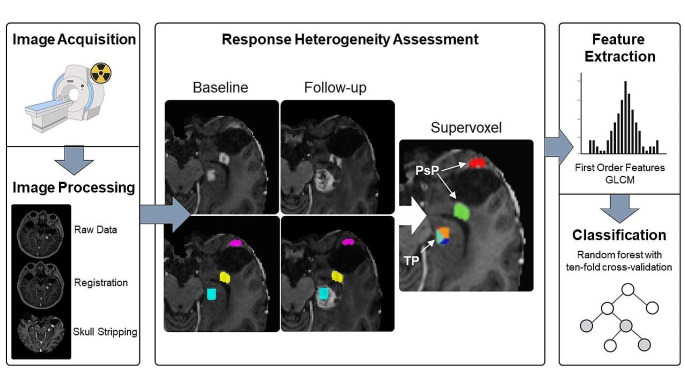
Methods: Based on automated tumor segmentation and longitudinal registration with follow-up imaging, we categorized contrast-enhancing voxels of 61 patients with suspected recurrence of glioblastoma into either true tumor progression (TP) or pseudoprogression (PsP). To allow the unbiased analysis of semantically related image regions, adjacent voxels with similar values of cerebral blood volume (CBV), FET-PET, and contrast-enhanced T1w were automatically grouped into supervoxels. We then extracted first-order statistics as well as texture features from each supervoxel. With these features, a Random Forest classifier was trained and validated employing a 10-fold cross-validation scheme. For model evaluation, the area under the receiver operating curve, as well as classification performance metrics were calculated.
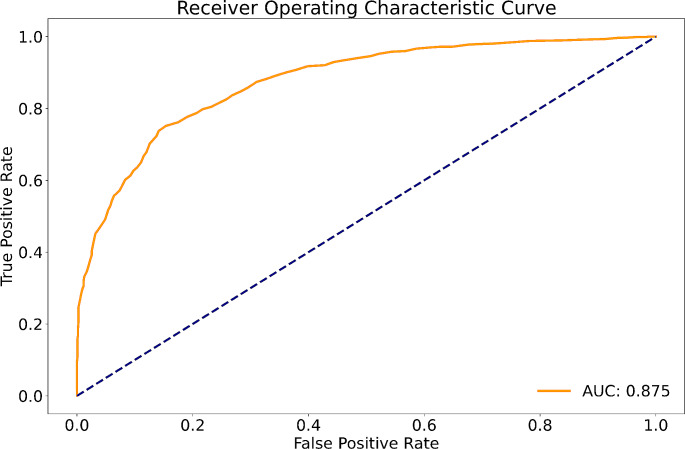
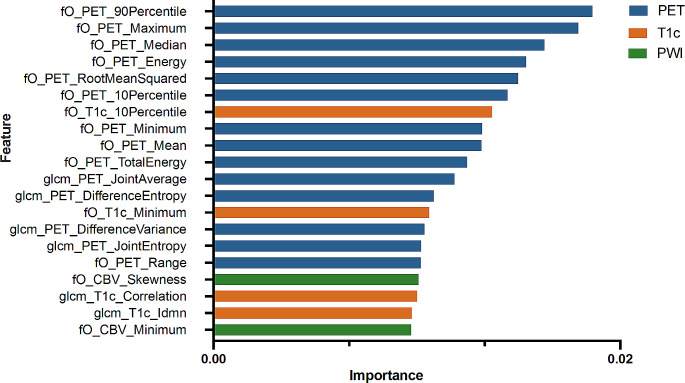
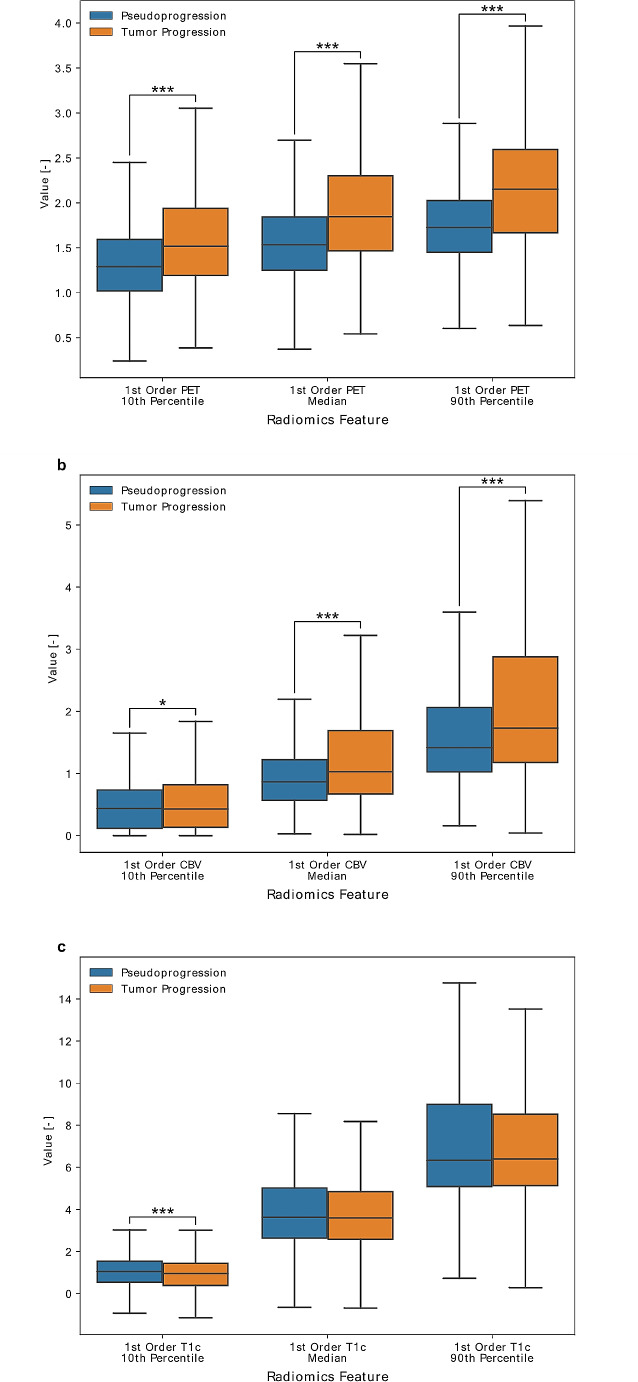
Results: Our image analysis pipeline enabled reliable spatial assessment of tumor response. The predictive model reached an accuracy of 80.0% and a macro-weighted AUC of 0.875, which takes class imbalance into account, in the hold-out samples from cross-validation on supervoxel level. Analysis of feature importances confirmed the significant role of FET-PET-derived features. Accordingly, TP- and PsP-labeled supervoxels differed significantly in their 10th and 90th percentile, as well as the median of tumor-to-background normalized FET-PET. However, CBV- and T1c-related features also relevantly contributed to the model's performance.
Conclusion: Disentangling the intratumoral heterogeneity in glioblastoma holds immense promise for advancing precise local response evaluation and thereby also informing more personalized and localized treatment strategies in the future.
Keywords: DSC perfusion; Glioblastoma; PET; Pseudoprogression; Radiomics; Spatial heterogeneity.
© 2024. The Author(s).
Conflict of interest statement
The authors have no relevant financial or non-financial interests to disclose.
Figures
References
-
- Imaging Glioblastoma Posttreatment: Progression, Pseudoprogression, Pseudoresponse, Radiation Necrosis. Neuroimaging Clin N Am. 2021 [cited 2024 Feb 15];31:103–20. 10.1016/j.nic.2020.09.010. - PubMed
-
- Paprottka KJ, Kleiner S, Preibisch C, Kofler F, Schmidt-Graf F, Delbridge C et al. Fully automated analysis combining [F]-FET-PET and multiparametric MRI including DSC perfusion and APTw imaging: a promising tool for objective evaluation of glioma progression. Eur J Nucl Med Mol Imaging. 2021;48:4445–55. 10.1007/s00259-021-05427-8. - PMC - PubMed
MeSH terms
Grants and funding
LinkOut - more resources
Full Text Sources
Medical
Miscellaneous
