Image-based discrimination of the early stages of mesenchymal stem cell differentiation
- PMID: 38837346
- PMCID: PMC11321037
- DOI: 10.1091/mbc.E24-02-0095
Image-based discrimination of the early stages of mesenchymal stem cell differentiation
Abstract
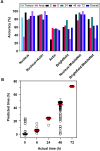
Mesenchymal stem cells (MSCs) are self-renewing, multipotent cells, which can be used in cellular and tissue therapeutics. MSCs cell number can be expanded in vitro, but premature differentiation results in reduced cell number and compromised therapeutic efficacies. Current techniques fail to discriminate the "stem-like" population from early stages (12 h) of differentiated MSC population. Here, we imaged nuclear structure and actin architecture using immunofluorescence and used deep learning-based computer vision technology to discriminate the early stages (6-12 h) of MSC differentiation. Convolutional neural network models trained by nucleus and actin images have high accuracy in reporting MSC differentiation; nuclear images alone can identify early stages of differentiation. Concurrently, we show that chromatin fluidity and heterochromatin levels or localization change during early MSC differentiation. This study quantifies changes in cell architecture during early MSC differentiation and describes a novel image-based diagnostic tool that could be widely used in MSC culture, expansion and utilization.
Conflict of interest statement
Conflicts of interests: The authors declare no financial conflict of interest.
Figures


Similar articles
-
Early Predicting Osteogenic Differentiation of Mesenchymal Stem Cells Based on Deep Learning Within One Day.Ann Biomed Eng. 2024 Jun;52(6):1706-1718. doi: 10.1007/s10439-024-03483-3. Epub 2024 Mar 15. Ann Biomed Eng. 2024. PMID: 38488988
-
Automated digital image quantification of histological staining for the analysis of the trilineage differentiation potential of mesenchymal stem cells.Stem Cell Res Ther. 2019 Feb 26;10(1):69. doi: 10.1186/s13287-019-1170-8. Stem Cell Res Ther. 2019. PMID: 30808403 Free PMC article.
-
Nuclear cardiac troponin and tropomyosin are expressed early in cardiac differentiation of rat mesenchymal stem cells.Differentiation. 2012 Mar;83(3):106-15. doi: 10.1016/j.diff.2011.10.002. Epub 2011 Nov 15. Differentiation. 2012. PMID: 22364878
-
Commonly used mesenchymal stem cell markers and tracking labels: Limitations and challenges.Histol Histopathol. 2013 Sep;28(9):1109-16. doi: 10.14670/HH-28.1109. Epub 2013 Apr 16. Histol Histopathol. 2013. PMID: 23588700 Free PMC article. Review.
-
Native and solubilized decellularized extracellular matrix: A critical assessment of their potential for improving the expansion of mesenchymal stem cells.Acta Biomater. 2017 Jun;55:1-12. doi: 10.1016/j.actbio.2017.04.014. Epub 2017 Apr 12. Acta Biomater. 2017. PMID: 28412553 Review.
Cited by
-
Mesenchymal stromal cell therapies for traumatic neurological injuries.J Transl Med. 2024 Nov 22;22(1):1055. doi: 10.1186/s12967-024-05725-3. J Transl Med. 2024. PMID: 39578845 Free PMC article. Review.
References
-
- Anghileri E, Marconi S, Pignatelli A, Cifelli P, Galié M, Sbarbati A, Krampera M, Belluzzi O, Bonetti B (2008). Neuronal differentiation potential of human adipose-derived mesenchymal stem cells. Stem Cells Dev 17, 909–916. - PubMed
-
- Boland MV, Markey MK, Murphy RF (1998). Automated recognition of patterns characteristic of subcellular structures in fluorescence microscopy images. Cytometry 33, 366–375 - PubMed
MeSH terms
Substances
LinkOut - more resources
Full Text Sources

