. 2024 Oct;57(10):e13676.
doi: 10.1111/cpr.13676. Epub 2024 Jun 4.

DCAF2 regulates the proliferation and differentiation of mouse progenitor spermatogonia by targeting p21 and thymine DNA glycosylase

Affiliations

DCAF2 regulates the proliferation and differentiation of mouse progenitor spermatogonia by targeting p21 and thymine DNA glycosylase

Hongwei Wei et al. Cell Prolif. 2024 Oct.

Abstract

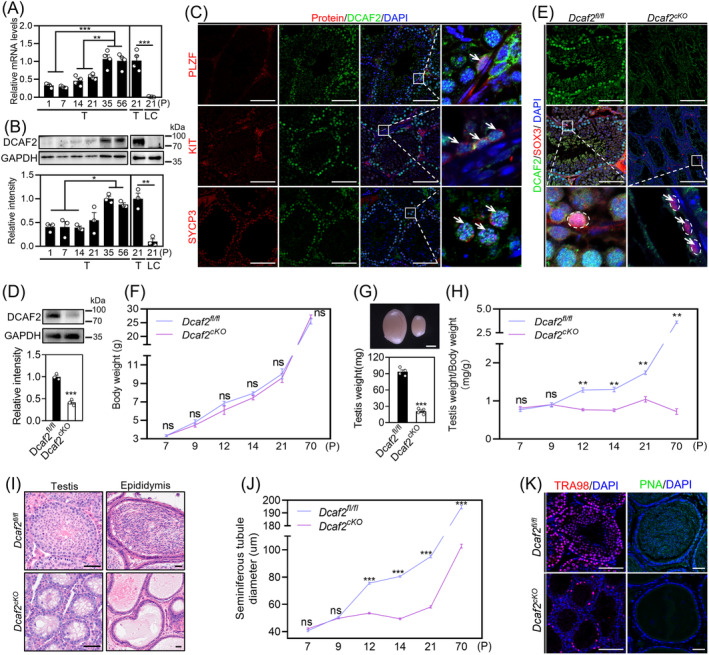
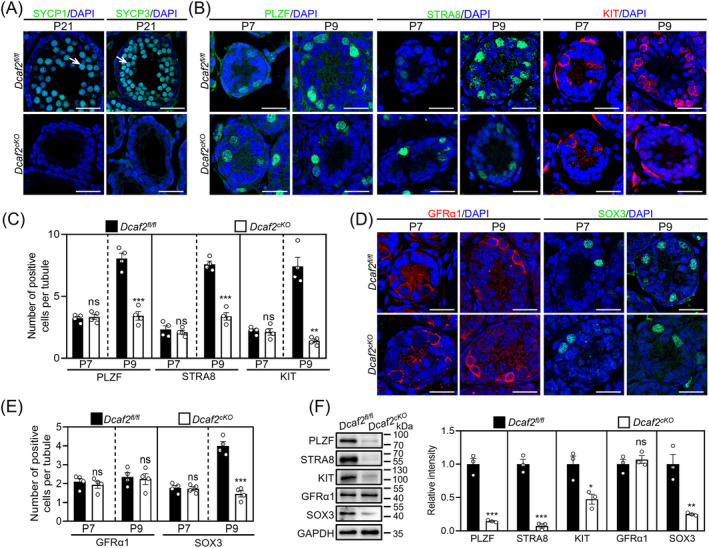
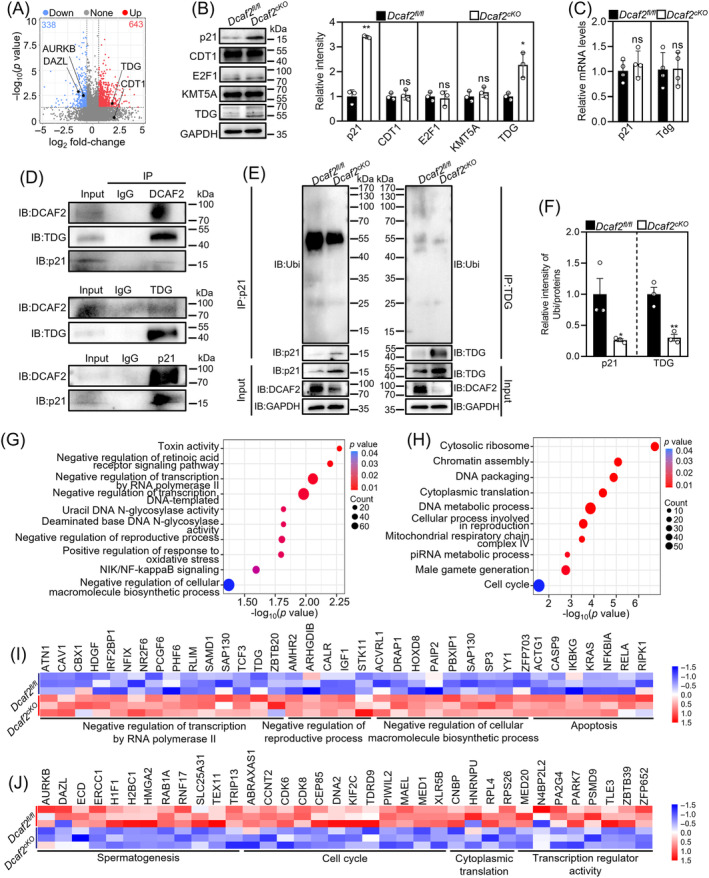
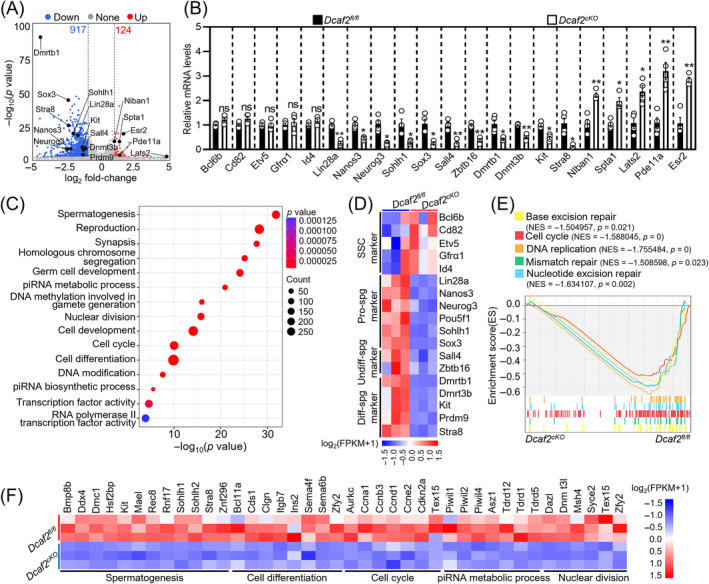
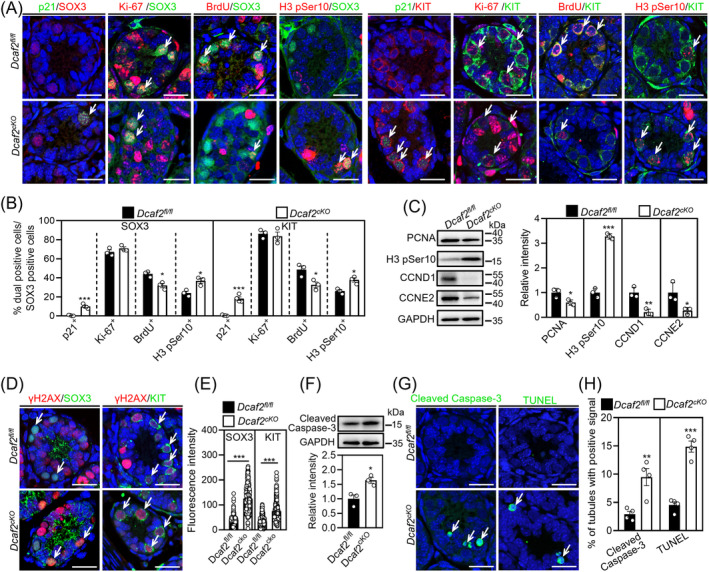
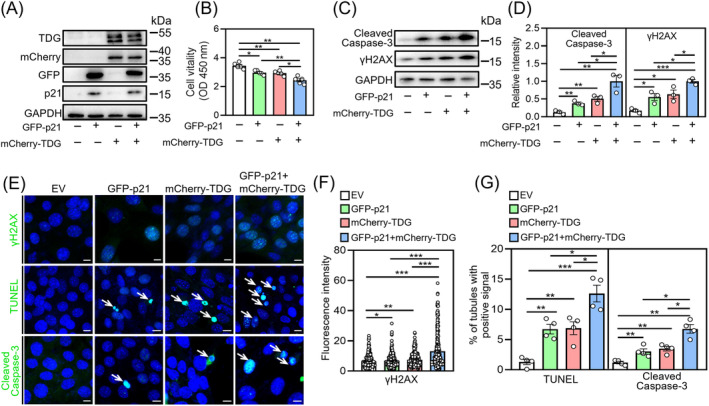
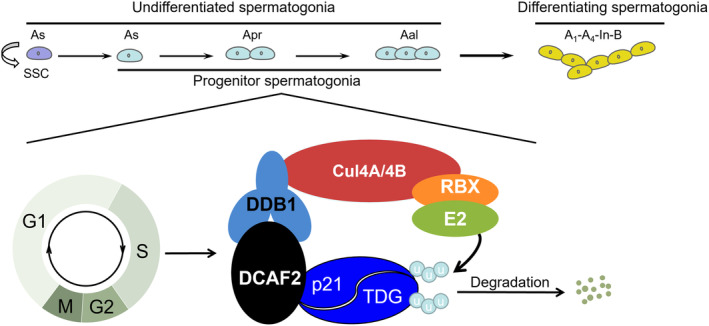
DDB1-Cullin-4-associated factor-2 (DCAF2, also known as DTL or CDT2), a conserved substrate recognition protein of Cullin-RING E3 ligase 4 (CRL4), recognizes and degrades several substrate proteins during the S phase to maintain cell cycle progression and genome stability. Dcaf2 mainly expressed in germ cells of human and mouse. Our study found that Dcaf2 was expressed in mouse spermatogonia and spermatocyte. The depletion of Dcaf2 in germ cells by crossing Dcaf2fl/fl mice with stimulated by retinoic acid gene 8(Stra8)-Cre mice caused a reduction in progenitor spermatogonia and differentiating spermatogonia, eventually leading to the failure of meiosis initiation and male infertility. Further studies showed that depletion of Dcaf2 in germ cells caused abnormal accumulation of the substrate proteins, cyclin-dependent kinase inhibitor 1A (p21) and thymine DNA glycosylase (TDG), decreasing of cell proliferation, increasing of DNA damage and apoptosis. Overexpression of p21 or TDG attenuates proliferation and increases DNA damage and apoptosis in GC-1 cells, which is exacerbated by co-overexpression of p21 and TDG. The findings indicate that DCAF2 maintains the proliferation and differentiation of progenitor spermatogonia by targeting the substrate proteins p21 and TDG during the S phase.


Conflict of interest statement

The authors declare that they have no competing interests.

Figures

FIGURE 1
FIGURE 1
Dcaf2 depletion in germ cells causes male sterility. (A, B) The mRNA (A) and protein (B) levels of DCAF2 in mouse different stages. GAPDH was used as an internal control. (C) Double‐immunofluorescence staining of seminiferous tubule sections from adult mouse testes. DCAF2 (green), PLZF (an undifferentiated spermatogonia marker, red), KIT (a differentiating spermatogonia marker, red) and SYCP3 (a spermatocyte marker, red). White arrowheads indicate representative double‐positive spermatogonia or spermatocytes. Nuclei were counterstained with DAPI (blue). (D) Detection of Dcaf2 knockout efficiency in the adult testes using western blotting. (E) Detection of Dcaf2 knockout efficiency in the adult testes using double‐immunofluorescence staining of DCAF2 (green) and SOX3 (red). Dotted circles indicated representative SOX3+ progenitor spermatogonia; White arrowheads indicate representative DCAF2SOX3+ progenitor spermatogonia. (F–H) The compare of body weight (F), and testis morphology at P70 (G) and the testicular index (H) in cKO and control mice. (I) Haematoxylin and eosin (H&E) staining of testis and cauda epididymis in adult cKO and control mice. (J) Seminiferous tubule diameter curve. (K) Immunofluorescent staining of TRA98 (a germ cell marker, red) in the testis and PNA (an acrosome of spermatid marker, green) in the cauda epididymis of adult mice. T, testes; LC, Leydig cells. For A, B, E F, G and H, n = 3–4 independent experiments. For J, more than 200 tubules from 4 independent experiments were scored in each group. Scale bars, C, D, E and K, 100 μm; G, 2000 μm; I, 50 μm. The p‐values were determined by one‐way ANOVA followed by Tukey's test (A, B). *p < 0.05, **p < 0.01, ***p < 0.001, ns; no significance.
FIGURE 2
FIGURE 2
SOX3+ progenitor spermatogonia are decreased in cKO testes. (A) Immunofluorescent staining of SYCP3 and SYCP1 in cKO and control testes at P21. White arrowheads indicate representative SYCP3+ or SYCP1+ spermatocytes. (B) Immunofluorescent staining of PLZF, STRA8 and KIT in cKO and control testes at P7 and P9. (C) Numbers of PLZF+, STRA8+ and KIT+ cells per seminiferous tubule in cKO and control testes at P7 and P9. (D) Immunofluorescent staining of GFRα1 and SOX3 in cKO and control testes at P7 and P9. (E) Numbers of GFRα1+ and SOX3+ cells per seminiferous tubule in cKO and control testes at P7 and P9. (F) Western blot analysis of PLZF, STRA8, KIT, GFRα1 and SOX3 levels in cKO and control testes at P9. GAPDH was used as an internal control. Nuclei were counterstained with DAPI (blue). Scale bars; 25 μm. For F, n = 3 independent experiments. For C and E, more than 200 tubules from four independent experiments were scored in each group. *p < 0.05, **p < 0.01, ***p < 0.001, ns; no significance.
FIGURE 3
FIGURE 3
Dcaf2 depletion in male germ cells increases the protein levels of p21 and TDG. (A) Volcano plot illustrating differentially expressed proteins in cKO and control testes. (B) Western blot analysis of p21, CDT1, E2F1, KMT5A and TDG levels in cKO and control testes at P9. GAPDH was used as an internal control. (C) mRNA levels of p21 and Tdg in cKO and control testes at P9. (D) Western blot analysis showed that there was an interaction in DCAF2 with p21 and TDG protein in mouse testis tissue. (E, F) ubiquitination assay showed that depletion of Dcaf2 decreased the ubiquitination levels of p21 and TDG. (G, H) Bubble chart illustrating the enriched GO terms associated with significantly upregulated (G) and downregulated (H) proteins in cKO and control testes identified using DIA proteomics. Proteins with a fold‐change ≥1.5 and a p‐value <0.05 were selected for analysis. (I, J) Heatmaps illustrating the differences in the expression of upregulated (I) and downregulated (J) proteins involved in various processes between cKO and control testes. For B, C and F, n = 3–4 independent experiments. *p < 0.05, **p < 0.01, ns; no significance.
FIGURE 4
FIGURE 4
Dcaf2 depletion disturbs the expression of genes involved in progenitor spermatogonia. (A) Volcano plot illustrating differentially expressed transcripts in cKO and control testes. (B) Quantitative RT‐PCR validating changes in representative transcripts selected from the RNA‐seq data. n = 4 independent experiments. (C) Bubble chart illustrating the enriched GO terms associated with the significantly downregulated transcripts identified by RNA‐seq in cKO and control testes. Transcripts with a fold‐change ≥2 and a p‐value 0.05 were selected for analysis. (D) Heatmap showing the mRNA abundance of genes functioning in spermatogonial stem cells (SSCs; e.g., Bcl6b, Etv5, Cd82, Id4 and Gfrα1), progenitor spermatogonia (pro‐spg; e.g., Lin28a, Nanos3, Neurog3, Pou5f1, Sohlh1 and Sox3), undifferentiated spermatogonia (Undiff‐spg; e.g., Sall4 and Zbtb16), and differentiating spermatogonia (Diff‐spg; e.g., Dmrtb1, Dnmt3b, Kit, Stra8 and Prdm9). (E) Gene set enrichment analysis (GSEA) revealing enrichment of the cell cycle, DNA replication and repair in cKO testes relative to the controls. NES, normalized enrichment score. (F) Heatmap illustrating the differences in the expression of downregulated transcripts involved in various processes between cKO and control testes. *p < 0.05, **p < 0.01, ***p < 0.001, ns; no significance.
FIGURE 5
FIGURE 5
Correlation between protein and mRNA expression in cKO testes relative to the controls. (A) Correlated proteins and RNAs were enriched in nine quadrants of the cKO testes. Quadrants 1, 2 and 4 indicate that protein abundance was lower that of RNA. In quadrants 3 and 7, the RNAs correspond with the related proteins. Quadrant 5 showed that proteins and RNAs were commonly expressed with no differences. Quadrants 6, 8 and 9 indicate that the protein abundance was higher than the RNA abundance (if the fold change was reached and the p‐value was not reached, it is shown as a grey point). (B) Number of RNAs and proteins enriched in the nine quadrants. (C) Bubble chart illustrating enriched GO terms associated with genes in quadrants 6, 8 and 9. (D) Protein–protein interaction network (PPI) analysis was performed for genes in quadrants 6, 8 and 9.
FIGURE 6
FIGURE 6
Dcaf2 depletion attenuates proliferation and increases apoptosis of progenitor spermatogonia. (A) Double immunofluorescence staining of SOX3 or KIT with p21, Ki‐67, BrdU and H3 pSer10, respectively, in cKO and control testes at P9. Nuclei were counterstained with DAPI (blue). (B) Ratio of double immunofluorescence staining of SOX3+ and KIT+ cells in cKO and control testes at P9 (shown as %). (C) Western blot analysis of PCNA, H3 pSer10, CCNE2 and CCND1 levels in cKO and control testes. GAPDH was used as an internal control. (D) Double immunofluorescence staining of γH2AX with GFRα1 in cKO and control testes at P9. (E) Fluorescence intensity analysis of γH2AX in SOX3+ and KIT+ cells. (F) Western blotting analysis of cleaved caspase‐3 levels in cKO and control testes. (G) Immunofluorescence staining of cleaved caspase‐3 and TUNEL in cKO and control testes at P9. (H) Ratio of cleaved caspase‐3 and TUNEL positive signal tubule in cKO and control testes at P9 (shown as %). White arrowheads indicate representative double positive cells or apoptotic cells. For C and F, n = 3 independent experiments. For B and E, more than 300 SOX3+ or KIT+ cells from 3 to 4 independent experiments were scored in each group. For H, more than 440 tubules from 4 independent experiments were scored in each group. Scale bars; 25 μm. *p < 0.05, **p < 0.01, ***p < 0.001, ns; no significance.
FIGURE 7
FIGURE 7
p21 and/or TDG overexpression attenuates proliferation and increases DNA damage and apoptosis in GC‐1 cells. (A) Western blot analysis for p21 and/or TDG expression in GC‐1 cells transfected with pcDNA3.1‐NC (EV), pcDNA3.1‐EGFP‐p21, pSC2‐mCherry‐TDG or pcDNA3.1‐EGFP‐p21 + pSC2‐mCherry‐TDG. (B) CCK‐8 assay for cell viability. (C, D) Western blot analysis of γH2AX and cleaved caspase‐3 expression in GC‐1 cells transfected with pcDNA3.1‐NC, pcDNA3.1‐EGFP‐p21, pSC2‐mcherry‐TDG or pcDNA3.1‐EGFP‐p21 + pSC2‐mCherry‐TDG. (E) TUNEL assay for apoptosis and immunofluorescence staining for γH2AX and cleaved caspase‐3. Nuclei were counterstained with DAPI (blue). White arrowheads indicate representative apoptotic cells. (F) Fluorescence intensity analysis of γH2AX in GC‐1 cells. (G) Ratio of cleaved caspase‐3 and TUNEL‐positive signals in GC‐1 cells. Scale bars; 10 μm. For B, n = 5 independent experiments. For D, n = 3 independent experiments. More than 300 cells (F) from 3 independent experiments and more than 800 cells (G) from 4 independent experiments were scored in each group. p‐values were determined by one‐way ANOVA followed by Tukey's test *p < 0.05, **p < 0.01, ***p < 0.001, ns; no significance.
FIGURE 8
FIGURE 8
Schematic diagram of the CRL4DCAF2 ubiquitin complex in mouse progenitor spermatogonia. CUL4 serves as a scaffold that binds to the adaptor protein DDB1 and the substrate receptor protein DCAF2 at the N‐terminus and interacts with the ring‐finger protein RBX at the C‐terminus, thereby forming the CRL4DCAF2 E3 ligase complex. CRL4DCAF2 E3 ligase can promote ubiquitin transfer from RBX‐bound E2 ubiquitin‐conjugating enzymes to the DCAF2 substrate proteins p21 and TDG, promoting their degradation during the S phase. Degradation of these proteins maintains the proliferation and differentiation of progenitor spermatogonia. u, ubiquitin.

Similar articles

Cited by

References

    1. Umehara T, Tsujita N, Shimada M. Activation of Toll‐like receptor 7/8 encoded by the X chromosome alters sperm motility and provides a novel simple technology for sexing sperm. PLoS Biol. 2019;17(8):e3000398. - PMC - PubMed
    1. Wang Z, Xu X, Li J‐L, Palmer C, Maric D, Dean J. Sertoli cell‐only phenotype and scRNA‐seq define PRAMEF12 as a factor essential for spermatogenesis in mice. Nat Commun. 2019;10(1):5196. - PMC - PubMed
    1. Liu W, Lu X, Zhao Z‐H, et al. SRSF10 is essential for progenitor spermatogonia expansion by regulating alternative splicing. eLife. 2022;11:11. - PMC - PubMed
    1. Teletin M, Vernet N, Yu J, et al. Two functionally redundant sources of retinoic acid secure spermatogonia differentiation in the seminiferous epithelium. Development (Cambridge, England). 2019;146(1):dev170225. - PMC - PubMed
    1. Bae MJ, Kang MK, Kye YU, et al. Differential effects of low and high radiation dose rates on mouse spermatogenesis. Int J Mol Sci. 2021;22(23):12834. - PMC - PubMed

Substances

LinkOut - more resources