. 2024 Jun;12(11):e16047.
doi: 10.14814/phy2.16047.

Acetate derived from the intestinal tract has a critical role in maintaining skeletal muscle mass and strength in mice

Affiliations

Acetate derived from the intestinal tract has a critical role in maintaining skeletal muscle mass and strength in mice

Saki Kobayashi et al. Physiol Rep. 2024 Jun.

Erratum in

Abstract

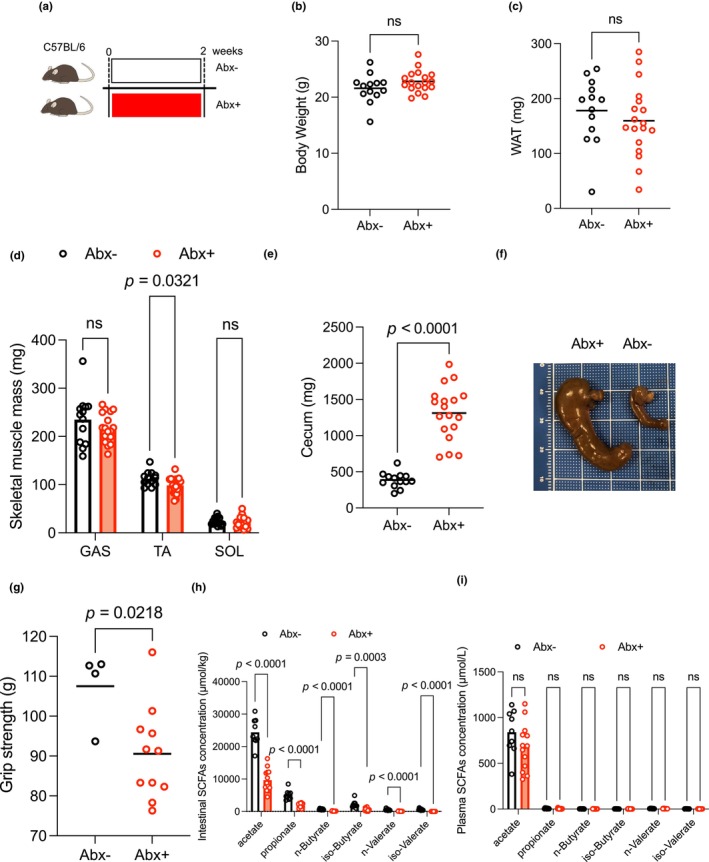
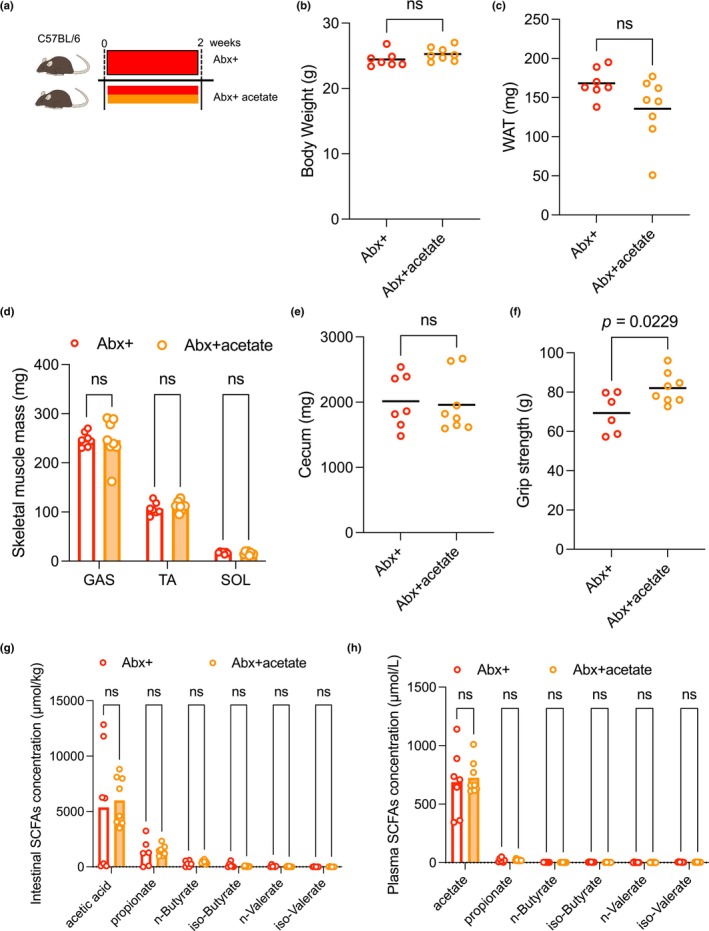
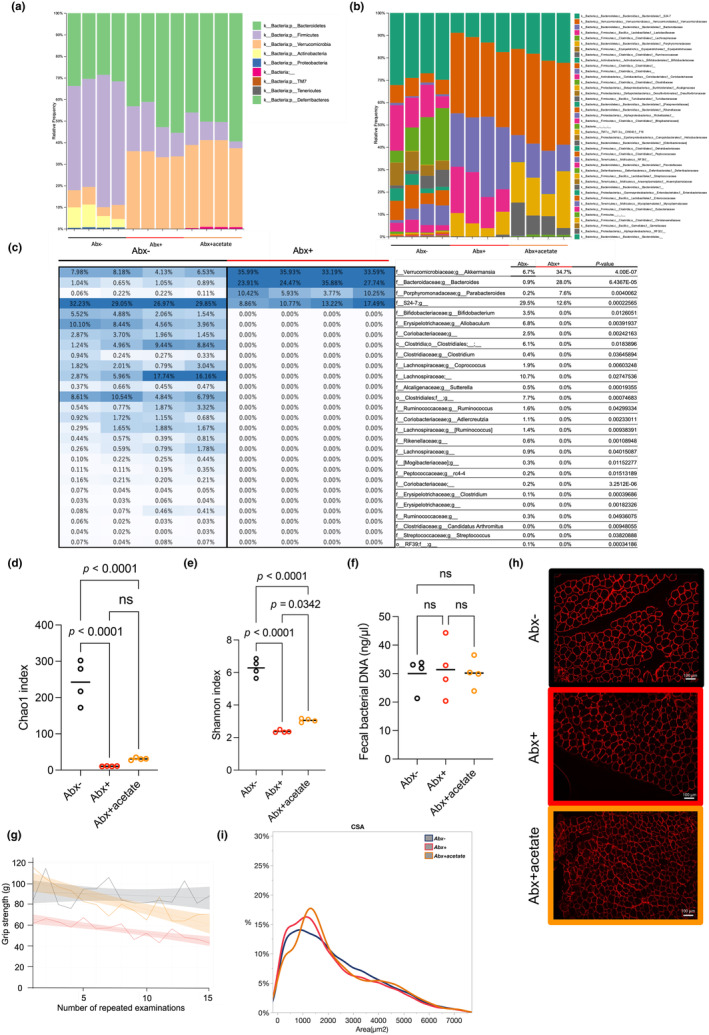
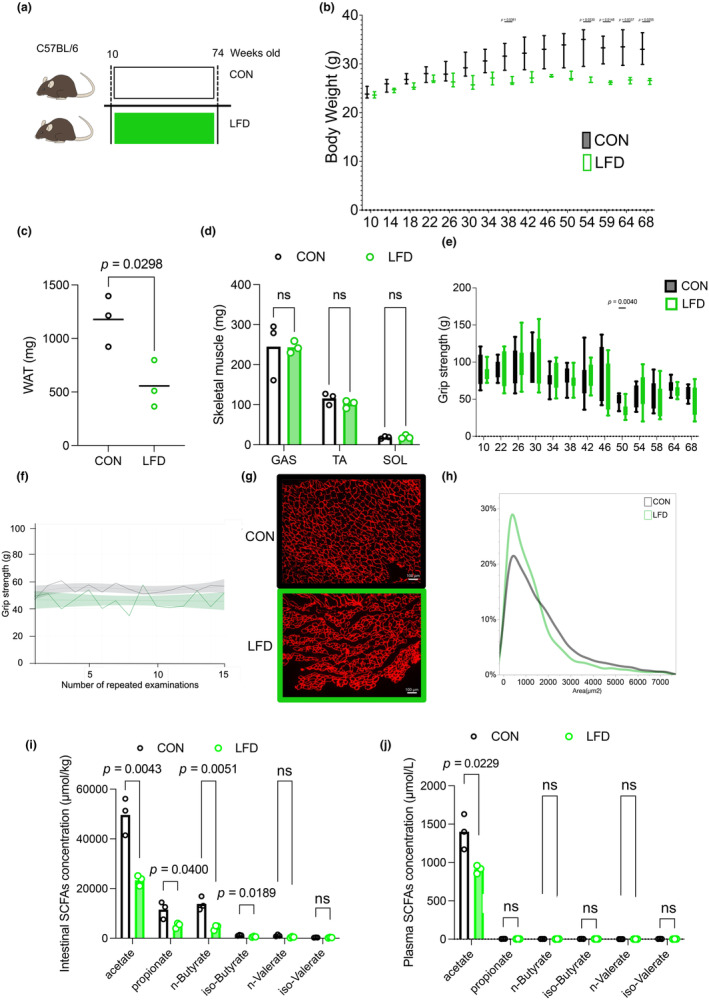
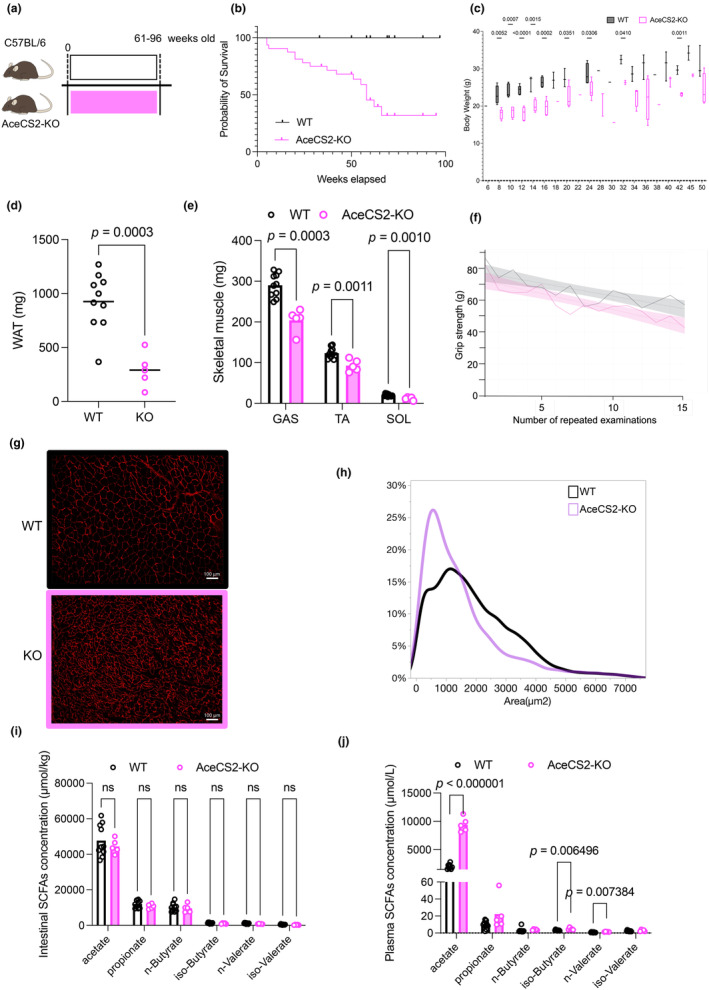
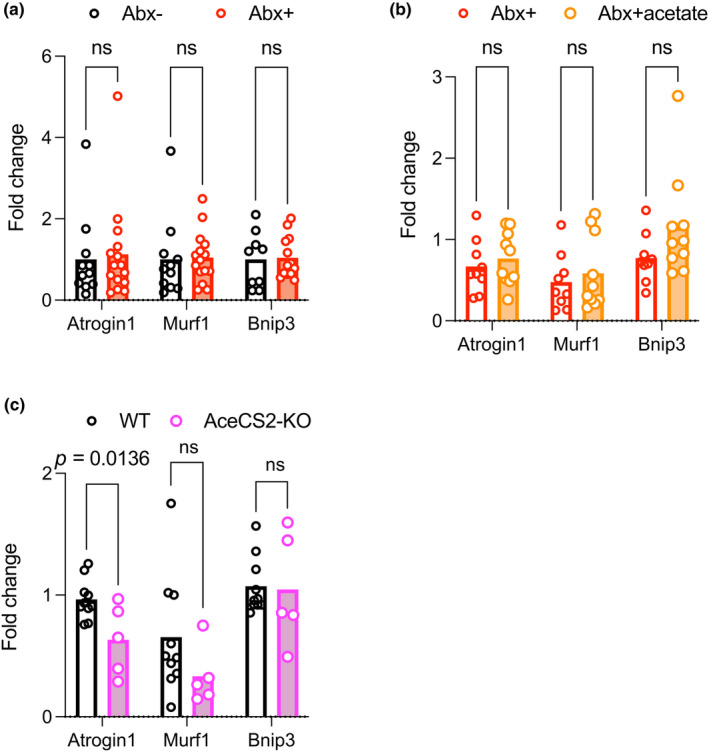
Acetate is a short-chain fatty acid (SCFA) that is produced by microbiota in the intestinal tract. It is an important nutrient for the intestinal epithelium, but also has a high plasma concentration and is used in the various tissues. Acetate is involved in endurance exercise, but its role in resistance exercise remains unclear. To investigate this, mice were administered either multiple antibiotics with and without oral acetate supplementation or fed a low-fiber diet. Antibiotic treatment for 2 weeks significantly reduced grip strength and the cross-sectional area (CSA) of muscle fiber compared with the control group. Intestinal concentrations of SCFAs were reduced in the antibiotic-treated group. Oral administration of acetate with antibiotics prevented antibiotic-induced weakness of skeletal muscle and reduced CSA of muscle fiber. Similarly, a low-fiber diet for 1 year significantly reduced the CSA of muscle fiber and fecal and plasma acetate concentrations. To investigate the role of acetate as an energy source, acetyl-CoA synthase 2 knockout mice were used. These mice had a shorter lifespan, reduced skeletal muscle mass and smaller CSA of muscle fiber than their wild type littermates. In conclusion, acetate derived from the intestinal microbiome can contribute to maintaining skeletal muscle performance.

Keywords: acetate; microbiome; short‐chain fatty acid; skeletal muscle.


Conflict of interest statement

No conflicts of interest, financial or otherwise, are declared by the authors.

Figures

FIGURE 1
FIGURE 1
Antibiotic treatment for 2 weeks reduced grip strength in mice. (a) Experimental protocol. C57BL/6 mice were allocated to two groups and administered antibiotics (100 μg/mL neomycin, 50 μg/mL streptomycin, 100 U/mL penicillin, 50 μg/mL vancomycin, 100 μg/mL metronidazole, 125 μg/mL ciprofloxacin, 100 μg/mL ceftazidime, and 170 μg/mL gentamicin in their drinking water) or not for 2 weeks (Abx‐, n = 13; Abx+, n = 18). (b) The bodyweight of Abx‐ and Abx + mice (Abx‐, n = 13; Abx+, n = 18). (c) WAT mass of Abx‐ and Abx + mice (Abx‐, n = 13; Abx+, n = 18). (d) Skeletal muscle masses of Abx‐ and Abx + mice (Abx‐, n = 13; Abx+, n = 18). (e and f) Cecum of Abx‐ and Abx + mice (Abx‐, n = 13; Abx+, n = 18). (g) Grip strength of Abx‐ and Abx + mice (Abx‐, n = 4; Abx+, n = 11). (h) Intestinal SCFA concentrations of Abx‐ and Abx + mice (Abx‐, n = 9; Abx+, n = 13). (I) Plasma SCFA concentration of Abx‐ and Abx + mice (Abx‐, n = 9; Abx+, n = 13). Data expressed as mean; ns, not statistically significant. The lines indicate the means; analyzed using Student's t‐tests. Abx‐, antibiotics untreated; Abx+, antibiotics treated; GAS, gastrocnemius muscle; SCFA, short‐chain fatty acid; SOL, soleus muscleTA, tibialis anterior muscle; WAT, white adipose tissue.
FIGURE 2
FIGURE 2
Effects of oral acetate supplementation on antibiotic treatment for 2 weeks. (a) Experimental protocol. C57BL/6 mice were allocated to two groups and administered antibiotics and acetate with antibiotics for 2 weeks (Abx+, n = 7; Abx + acetate, n = 8). (b) The bodyweight of Abx + and Abx + acetate mice (Abx+, n = 7; Abx + acetate, n = 8). (c) WAT of Abx + and Abx + acetate mice (Abx+, n = 7; Abx + acetate, n = 8). (d) Skeletal muscles of Abx + and Abx + acetate mice (Abx+, n = 7; Abx + acetate, n = 8). (e) Cecum of Abx + and Abx + acetate mice (Abx+, n = 7; Abx + acetate, n = 8). (f) Grip strength of Abx + and Abx + acetate mice (Abx+, n = 6; Abx + acetate, n = 8). (g) Intestinal SCFA concentrations of Abx + and Abx + acetate mice (Abx+, n = 6; Abx + acetate, n = 8). (h) Plasma SCFA concentrations of Abx + and Abx + acetate mice (Abx+, n = 6; Abx + acetate, n = 8). Data expressed as mean; ns, not statistically significant. The lines indicate the means; analyzed using Student's t‐tests. Abx+, antibiotics treated; Abx + acetate, antibiotics with acetate treated; WAT, white adipose tissue; SCFA, short‐chain fatty acid; GAS, gastrocnemius muscle; TA, tibialis anterior muscle; SOL, soleus muscle.
FIGURE 3
FIGURE 3
Analysis of the fecal microbiome in Abx‐, Abx+, and Abx + acetate groups. (a) Composition of the fecal microbiome at the phylum level. (b) Composition of the fecal microbiome at the family level. (c) Heat map and list of bacterial taxa showing significant differences in the percentage composition of the entire microbiome, analyzed using the Student's t‐test. Values are averages and P‐values. (d and e) Fecal bacterial diversity assessed using the Chao1 and Shannon indices, respectively. (f) Concentration of fecal bacterial DNA. (g) Repeated grip strength test of Abx‐, Abx + and Abx + acetate mice. Spline curves with 95% confidence intervals. (h) Representative cross‐sectional images of the TA from Abx‐, Abx + and Abx + acetate mice. Muscle fibers were immunostained with anti‐laminin antibody in red. I: CSA of Abx‐, Abx + and Abx + acetate mice. n = 4 per group. Data expressed as mean; ns, not statistically significant; analyzed using one‐way analysis of variance and subsequent post hoc Tukey tests (d and e) or Student's t‐tests (f). Abx + acetate+, antibiotics with acetate treated; Abx‐, antibiotics untreated; Abx+, antibiotics treated; CSA, cross‐sectional area; TA, tibialis anterior muscle.
FIGURE 4
FIGURE 4
Metabolic phenotype of mice fed an LFD or control diet (CON). (a) Experimental protocol: C57BL/6 mice were allocated to two groups and fed either LFD or CON for 64 weeks starting at 10 weeks of age. n = 3 per group. The LFD contained low dietary fiber. (b) The bodyweight of LFD and CON mice. (c) WAT of LFD and CON mice. D: Skeletal muscles of LFD and CON mice. (e) Grip strength of LFD and CON mice. F: Repeated grip strength test at 58 weeks of age. Spline curves with 95% confidence intervals. G: Representative cross‐sectional images of the TA from LFD and CON mice. Muscle fibers are immunostained with anti‐laminin antibody in red. (h) Cross‐sectional area of LFD and CON mice. (i) Intestinal SCFA concentrations of LFD and CON mice. (j) Plasma SCFA concentrations of LFD and CON mice. Data expressed as mean; ns, not statistically significant; analyzed using Student's t‐tests. The boxes indicate the interquartile ranges and the lines within the boxes indicate the medians. Lines show the minimum and maximum values. CON, control diet; CSA, cross‐sectional area; GAS, gastrocnemius muscle; LFD, low‐fiber diet; SCFA, short‐chain fatty acid; SOL, soleus muscle; TA, tibialis anterior muscle; WAT, white adipose tissue.
FIGURE 5
FIGURE 5
Metabolic phenotype of AceCS2‐KO or WT mice. (a) Mice were fed standard diet for 61–96 weeks. (b) Kaplan–Meier analysis of survival in males of WT and AceCS2‐KO mice (WT, n = 22; AceCS2‐KO, n = 32). (c) The bodyweight of WT and AceCS2‐KO mice (WT, n = 10; AceCS2‐KO, n = 14). (d) WAT mass of WT and AceCS2‐KO mice (WT, n = 10; AceCS2‐KO, n = 5). (e) Skeletal muscle masses of WT and AceCS2‐KO mice (WT, n = 10; AceCS2‐KO, n = 5). (f) Repeated grip strength test. Spline curves with 95% confidence intervals. (g) Representative cross‐sectional images of the TA from WT and AceCS2‐KO mice. Muscle fibers are immunostained with anti‐laminin antibody in red. (h) Cross‐sectional area of WT and AceCS2‐KO mice. (i) Intestinal SCFA concentrations of WT and AceCS2‐KO mice (WT, n = 10; AceCS2‐KO, n = 5). (j) Plasma SCFA concentrations of WT and AceCS2‐KO mice (WT, n = 10; AceCS2‐KO, n = 5). Data expressed as mean; ns, not statistically significant; analyzed using Student's t‐test (c, d, e, i and j). Lines show the minimum and maximum values. AceCS2, acetyl‐CoA synthetase 2; CSA, cross‐sectional area; GAS, gastrocnemius muscle; SCFA, short‐chain fatty acid; SOL, soleus muscle; TA, tibialis anterior muscle; WAT, white adipose tissue; WT, wild type.
FIGURE 6
FIGURE 6
Expression profile of genes related to skeletal muscle degradation in TA muscle. Quantitative PCR analysis of intracellular ubiquitin ligases‐muscle atrophy F‐box (Atrogin1/MAFbx), muscle RING finger 1 (Murf1), and the autophagy‐related gene, Bcl‐2 and 19‐kDa interacting protein 3 (Bnip3). (a) Abx‐ (n = 10) and Abx + mice (n = 15). (b) Abx + (n = 8), Abx + acetate (n = 10). (c) WT (n = 7), AceCS2‐KO (n = 5). Data expressed as mean; ns, not statistically significant. Analyzed using Student's t‐test. TA muscles were harvested after 12 h of fasting (a and b) and in ad libitum conditions (c). TA, tibialis anterior muscle.

Similar articles

Cited by

References

    1. Aartsma‐Rus, A. , & van Putten, M. (2014). Assessing functional performance in the mdx mouse model. Journal of Visualized Experiments, 85, 51303. - PMC - PubMed
    1. Agirman, G. , & Hsiao, E. Y. (2022). Gut microbes shape athletic motivation. Nature, 612(7941), 633–634. - PubMed
    1. Bano, G. , Trevisan, C. , Carraro, S. , Solmi, M. , Luchini, C. , Stubbs, B. , Manzato, E. , Sergi, G. , & Veronese, N. (2017). Inflammation and sarcopenia: A systematic review and meta‐analysis. Maturitas, 96, 10–15. - PubMed
    1. Bernabeu‐Wittel, M. , González‐Molina, Á. , Fernández‐Ojeda, R. , Díez‐Manglano, J. , Salgado, F. , Soto‐Martín, M. , Muniesa, M. , Ollero‐Baturone, M. , & Gómez‐Salgado, J. (2019). Impact of sarcopenia and frailty in a multicenter cohort of Polypathological patients. Journal of Clinical Medicine, 8(4), 535. - PMC - PubMed
    1. Braden, B. , Adams, S. , Duan, L.‐P. , Orth, K.‐H. , Maul, F.‐D. , Lembcke, B. , Hör, G. , & Caspary, W. F. (1995). The [13C]acetate breath test accurately reflects gastric emptying of liquids in both liquid and semisolid test meals. Gastroenterology, 108(4), 1048–1055. - PubMed

LinkOut - more resources