Case Reports
. 2024 Jul;11(7):1715-1731.
doi: 10.1002/acn3.52078. Epub 2024 Jun 4.

Late-onset Krabbe disease presenting as spastic paraplegia - implications of GCase and CTSB/D

Affiliations
Case Reports

Late-onset Krabbe disease presenting as spastic paraplegia - implications of GCase and CTSB/D

Rebecca Mächtel et al. Ann Clin Transl Neurol. 2024 Jul.

Abstract

Objective: Krabbe disease (KD) is a multisystem neurodegenerative disorder with severe disability and premature death, mostly with an infancy/childhood onset. In rare cases of late-onset phenotypes, symptoms are often milder and difficult to diagnose. We here present a translational approach combining diagnostic and biochemical analyses of a male patient with a progressive gait disorder starting at the age of 44 years, with a final diagnosis of late-onset KD (LOKD).

Methods: Additionally to cerebral MRI, protein structural analyses of the β-galactocerebrosidase protein (GALC) were performed. Moreover, expression, lysosomal localization, and activities of β-glucocerebrosidase (GCase), cathepsin B (CTSB), and cathepsin D (CTSD) were analyzed in leukocytes, fibroblasts, and lysosomes of fibroblasts.

Results: Exome sequencing revealed biallelic likely pathogenic variants: GALC exons 11-17: 33 kb deletion; exon 4: missense variant (c.334A>G, p.Thr112Ala). We detected a reduced GALC activity in leukocytes and fibroblasts. While histological KD phenotypes were absent in fibroblasts, they showed a significantly decreased activities of GCase, CTSB, and CTSD in lysosomal fractions, while expression levels were unaffected.

Interpretation: The presented LOKD case underlines the age-dependent appearance of a mildly pathogenic GALC variant and its interplay with other lysosomal proteins. As GALC malfunction results in reduced ceramide levels, we assume this to be causative for the here described decrease in CTSB and CTSD activity, potentially leading to diminished GCase activity. Hence, we emphasize the importance of a functional interplay between the lysosomal enzymes GALC, CTSB, CTSD, and GCase, as well as between their substrates, and propose their conjoined contribution in KD pathology.

Keywords: Krabbe disease; cathepsin B; cathepsin D; enzymatic activity; late‐onset; β‐glucocerebrosidase.


Conflict of interest statement

The authors declare that they have no known competing financial interests or personal relationships that could have appeared to influence the work reported in this paper.

Figures

Figure 1
Figure 1
Schematic overview of glycosphingolipid metabolism and associated enzymes and diseases. Galactosylceramide, glucosylceramide, and sphingomyelin are metabolized to ceramide (and the respective carbohydrate residue (not shown)) by different lysosomal enzymes (green). Dysfunction or lack of each enzyme can lead to specific lysosomal storage disorders (LSDs, orange) with severe neurodegeneration effects. Deficiencies in β‐galactocerebrosidase (GALC) can also cause accumulation of cytotoxic galactosylsphingosin (psychosine). All named diseases are related to impaired sphingolipid (i.e., ceramide) metabolism, thus being classified as sphingolipidoses. See text for more details. Figure created with Inkscape and BioRender.com.
Figure 2
Figure 2
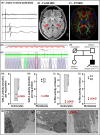
Clinical and genetic characterization of the index patient. (A) Matching the spastic paraplegia phenotype, motor evoked potentials to the Tibialis anterior muscle were bilaterally absent upon motor cortex stimulation (first trace: left motor cortex/right leg, second trace: right motor cortex/left leg, three repetitions each), but unaffected upon lumbar stimulation (third trace: right leg, fourth trace: left leg, two repetitions each). Vertical division 2 mV, horizontal division 20 ms. (B) Representative image of a fluid attenuated inversion recovery sequence (FLAIR, transversal plane) upon 3.0 Tesla magnetic resonance imaging showing no abnormalities. Specifically, there were no signs of a leukodystrophy and no abnormal hyperintensity of the pyramidal tracts (red arrows). (C) Diffusion tensor imaging (DTI) sequences also showed integrity of all major fiber tracts. (D) Exome sequencing revealed a gene dosage loss of 33 kb (red) spanning exons 11–17 of GALC. (E) Moreover, there was a heterozygous c.334A>G variant in GALC, leading to a Thr112Ala missense mutation. (F) Segregation analysis was performed both in the father and the sister of the index patient, confirming the compound heterozygous constellation of both, the deletion and the point mutation, variants. (G) In a fluorimetric substrate assay, the GALC activity in the patient leukocyte lysates was not reduced in two repetitive measurements compared to the standard reference range. (H) The same assay applied to fibroblast samples showed a strongly reduced GALC activity in the patient cells compared to two control cultures. Shown is one of three independent time points, all showing the same trend. (I) Utilizing radioimmunoassay (RIA), the relative activity of GALC was reduced (<0.5%) in two repetitive measurements compared to the reference range of healthy controls (>2%). (J) In fibroblast lysates of healthy controls (C1 and C2), GALC activity in RIA was more than three times higher compared to the patient fibroblasts (index case, LOKD). (K) Using transmission electron microscopy (TEM), no changes between control and patient fibroblasts were found regarding the distribution of mitochondria, storage vesicles, or other organelles. No Krabbe bodies were detected. Scale bar: 2 μm.
Figure 3
Figure 3
Homology modeling of GALC wt, T112A, and the deletion variant. (A) Homology modeling of human GALC wt (gray, based on PDB file 3ZR5 39 ) with bound substrate (yellow, implemented from PDB file 4CCC 41 ). Thr112 (green) is in close distance to the residues interacting with the substrate (brown), yet not directly involved in substrate binding. Thr112 builds hydrogen bonds with Asp509 and Gly512 (red dashed lines, wt/top), while the variant with Ala112 (red) seems to lose at least one hydrogen bond to Gly512 (red dashed line, T112/bottom). Glycosylation sides are not shown. (B) The deletion variant of GALC lacks residues originated from exon 11 to 17. In consequence, a large part of the protein, including the substrate interaction side/binding pocket, is missing (black); thus, the functionality of the remaining protein (orange) is unlikely. (C) BLAST alignment (https://www.uniprot.org/blast) of GALC residues around Thr112 between human and six other mammalians. Except for GALC of species like Beluga whale, which has over 100 residues less than human GALC, the region around Thr112 and is highly conserved within species.
Figure 4
Figure 4
Protein levels of lysosomal proteins in lysates of control and patient fibroblasts. (A and B) Comparison of protein expression patterns of LAMP‐2 in whole fibroblast lysates (A) and lysosome‐enriched fibroblast lysates (B). In lysosomes, LAMP‐2 is in a more glycosylated state. (C–H) Western blots and signal intensities of lysosomal enzymes: GCase (C and D), CTSB (E and F), and CTSD (G and H) expression levels. C, E, and G display protein levels from whole‐cell fibroblast lysates, normalized to β‐actin, with an n = 3 of two control (C1 and C2) and the patient (LOKD) fibroblast lines. GCase levels were significantly higher for LOKD in comparison with C1 in whole‐cell lysates (C). CTSB and CTSD expressed at similar levels in control and LOKD (E and G). D, F, and H display protein levels from lysosome‐enriched fibroblast lysates, normalized to total protein load (Coomassie Brilliant Blue (CBB)) with an n = 5 of three controls (C1–C3) and patient line (LOKD). All three proteins have comparable levels between all controls and LOKD. Statistics: Welch's ANOVA test with Dunnett's T3 multiple comparison: *p < 0.05. (I–K) Immunofluorescence staining of control (C2) and LOKD fibroblast utilizing LAMP‐2 (purple) as lysosomal marker, and correlating to different lysosomal enzymes (GCase (I), CTSB (J), or CTSD (K); turquois). Shown are representative pictures. No obvious alterations in location or distribution could be seen, and the Pearson's coefficient was similar between C2 and LOKD (n = 30–40). Blue: nucleus (DAPI); scale bar: 25 μm.
Figure 5
Figure 5
Analyses of lysosomal enzyme activities in fibroblasts and leukocytes. (A–C) Activities of GCase (A), CTSB (B), and CTSD (C) were determined in lysates of fibroblasts using artificial fluorogenic substrates. The activity of all measured enzymes was ranging in the same level in LOKD fibroblast (red dots) in comparison with all control samples (C1–C3, gray violin plot, n = 6–8). (D and E), Lysosomal enzyme activities of GCase (D) and CTSB (E) were measured in live fibroblasts by an established assays utilizing cell membrane‐permeable fluorogenic substrates and normalization to cell volume (CellTag700 signal). Raw values of lysosomal activities of individual samples can be found in Figure S3. The enzyme activity of both proteins was significantly reduced in the LOKD samples (n = 4). (F) Activity of CTSD in lysosome‐enriched fibroblast lysates (n = 4), determined using artificial fluorogenic substrate. Statistics: Welch's ANOVA test with Dunnett's T3 multiple comparison: ****p < 0.0001, ***p < 0.001, **p < 0.01, *p < 0.05. (G and H) Degradation capacity of glucocerebroside in LOKD leukocytes determined by radioactivity analysis was within the reference range (n = 3, G). Fluorometry analysis revealed values above the lower boundary value of 80 nmol/h/106 cells (n = 3, H).
Figure 6
Figure 6
Overview of interaction and interdependence of GALC with other lysosomal enzymes and substrates. Reduced activity of GCase, CTSB, and CTSD – as seen in our study – can be correlated to ceramide levels: Fully functional (left) GALC produces, together with other enzymes, sufficient amounts of ceramides, which is essential for appropriate activation or maturation of CTSB and CTSD. These subsequently promote maturation of pro‐saposin to saposin C, which serves as a co‐activator for GCase. In consequence, reduced GALC activity (right) as in our LOKD patient leads to reduced ceramide levels. Less CTSB and CTSD is activated and pro‐saposin remains in its non‐maturated state. Missing the co‐activation, GCase activity is reduced and, as already caused by malfunctioning GALC, ceramide levels decrease even further. Figure created with Inkscape and BioRender.com.

Similar articles

Cited by

References

    1. Ghabash G, Wilkes J, Barney BJ, Bonkowsky JL. Hospitalization burden and incidence of Krabbe disease. J Child Neurol. 2022;37:12‐19. - PMC - PubMed
    1. Heim P, Claussen M, Hoffmann B, et al. Leukodystrophy incidence in Germany. Am J Med Genet. 1997;71:475‐478. - PubMed
    1. Zhang X, Niu G, Song P, et al. Compound heterozygous pathogenic variants in the GALC gene cause infant‐onset Krabbe disease. Transl Pediatr. 2021;10:2552‐2562. - PMC - PubMed
    1. Harzer K, Knoblich R, Rolfs A, Bauer P, Eggers J. Residual galactosylsphingosine (psychosine) β‐galactosidase activities and associated GALC mutations in late and very late onset Krabbe disease. Clin Chim Acta. 2002;317:77‐84. - PubMed
    1. Duffner PK, Barczykowski A, Kay DM, et al. Later onset phenotypes of Krabbe disease: results of the world‐wide registry. Pediatr Neurol. 2012;46:298‐306. - PubMed

Publication types