

Joint modeling of monocyte HLA-DR expression trajectories predicts 28-day mortality in severe SARS-CoV-2 patients
- PMID: 38837680
- PMCID: PMC11247117
- DOI: 10.1002/psp4.13145
Joint modeling of monocyte HLA-DR expression trajectories predicts 28-day mortality in severe SARS-CoV-2 patients
Abstract
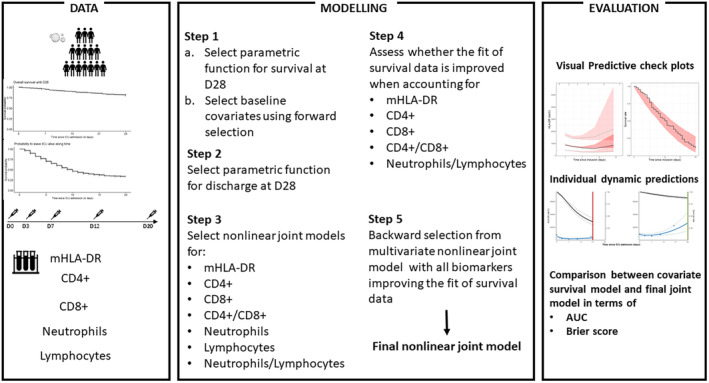
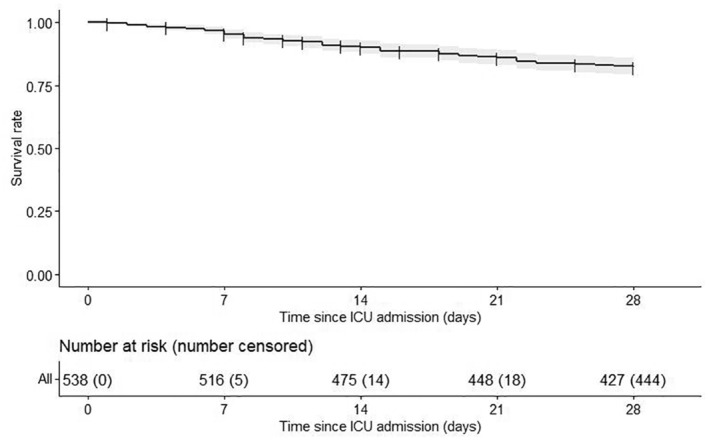
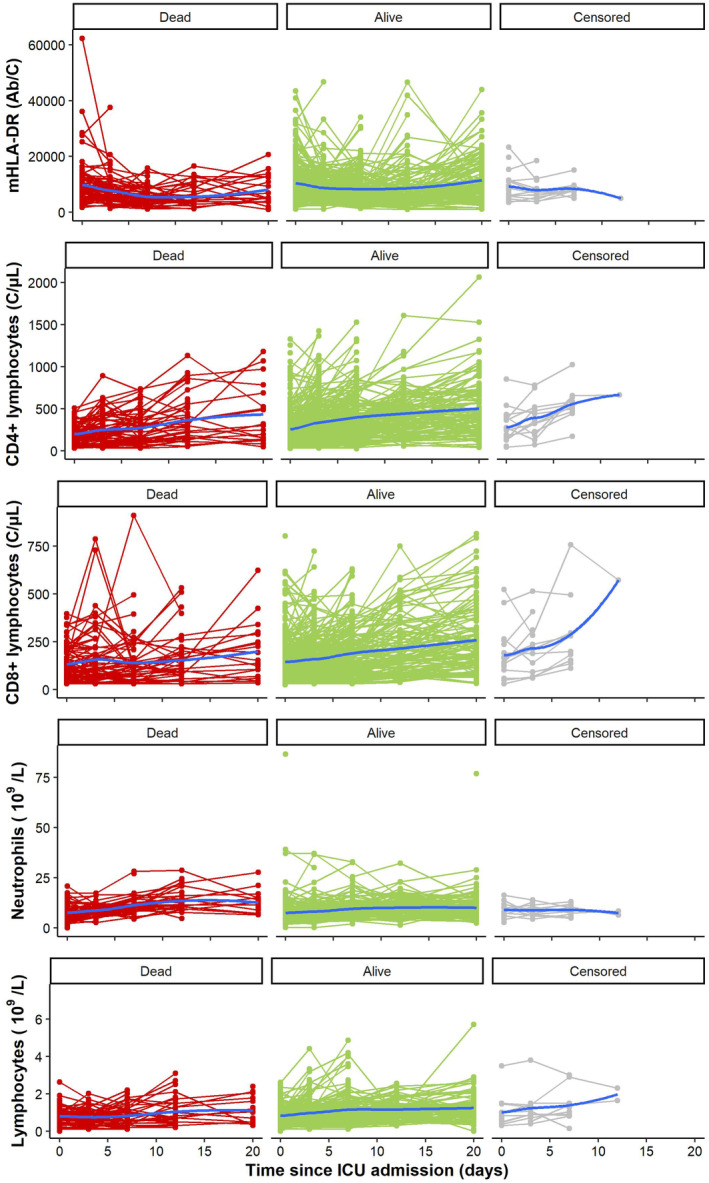
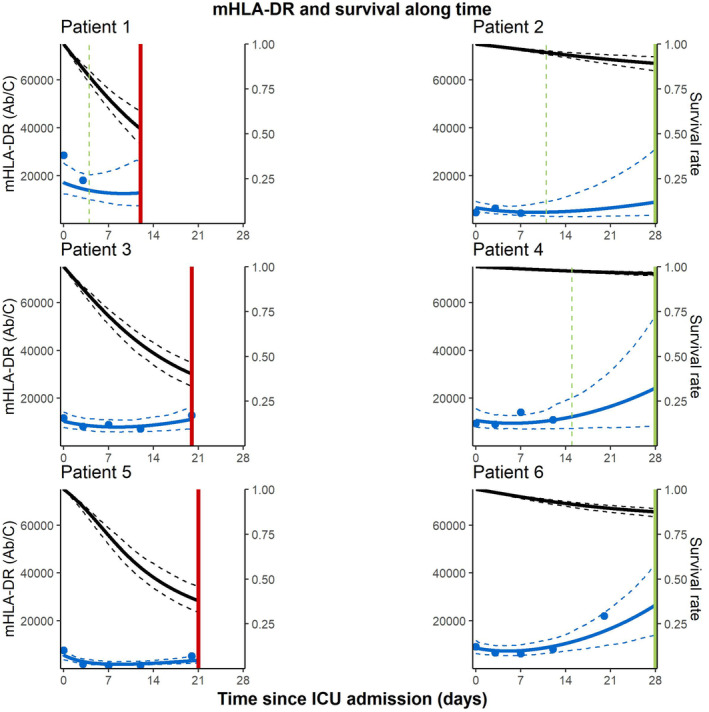
The recent SarsCov2 pandemic has disrupted healthcare system notably impacting intensive care units (ICU). In severe cases, the immune system is dysregulated, associating signs of hyperinflammation and immunosuppression. In the present work, we investigated, using a joint modeling approach, whether the trajectories of cellular immunological parameters were associated with survival of COVID-19 ICU patients. This study is based on the REA-IMMUNO-COVID cohort including 538 COVID-19 patients admitted to ICU between March 2020 and May 2022. Measurements of monocyte HLA-DR expression (mHLA-DR), counts of neutrophils, of total lymphocytes, and of CD4+ and CD8+ subsets were performed five times during the first month after ICU admission. Univariate joint models combining survival at day 28 (D28), hospital discharge and longitudinal analysis of those biomarkers' kinetics with mixed-effects models were performed prior to the building of a multivariate joint model. We showed that a higher mHLA-DR value was associated with a lower risk of death. Predicted mHLA-DR nadir cutoff value that maximized the Youden index was 5414 Ab/C and led to an AUC = 0.70 confidence interval (95%CI) = [0.65; 0.75] regarding association with D28 mortality while dynamic predictions using mHLA-DR kinetics until D7, D12 and D20 showed AUCs of 0.82 [0.77; 0.87], 0.81 [0.75; 0.87] and 0.84 [0.75; 0.93]. Therefore, the final joint model provided adequate discrimination performances at D28 after collection of biomarker samples until D7, which improved as more samples were collected. After severe COVID-19, decreased mHLA-DR expression is associated with a greater risk of death at D28 independently of usual clinical confounders.
© 2024 The Authors. CPT: Pharmacometrics & Systems Pharmacology published by Wiley Periodicals LLC on behalf of American Society for Clinical Pharmacology and Therapeutics.
Conflict of interest statement
The authors declare no competing financial interests in relation to the work.
Figures
References
-
- Latouche A, Porcher R, Chevret S. A note on including time‐dependent covariate in regression model for competing risks data. Biom J. 2005;47(6):807‐814. - PubMed
MeSH terms
Substances
LinkOut - more resources
Full Text Sources
Medical
Research Materials
Miscellaneous
