. 2024 Jun 15;38(11):e23720.
doi: 10.1096/fj.202400210RR.

Impaired cathepsin D in retinal pigment epithelium cells mediates Stargardt disease pathogenesis

Affiliations

Impaired cathepsin D in retinal pigment epithelium cells mediates Stargardt disease pathogenesis

Eunice Sze Yin Ng et al. FASEB J. .

Abstract

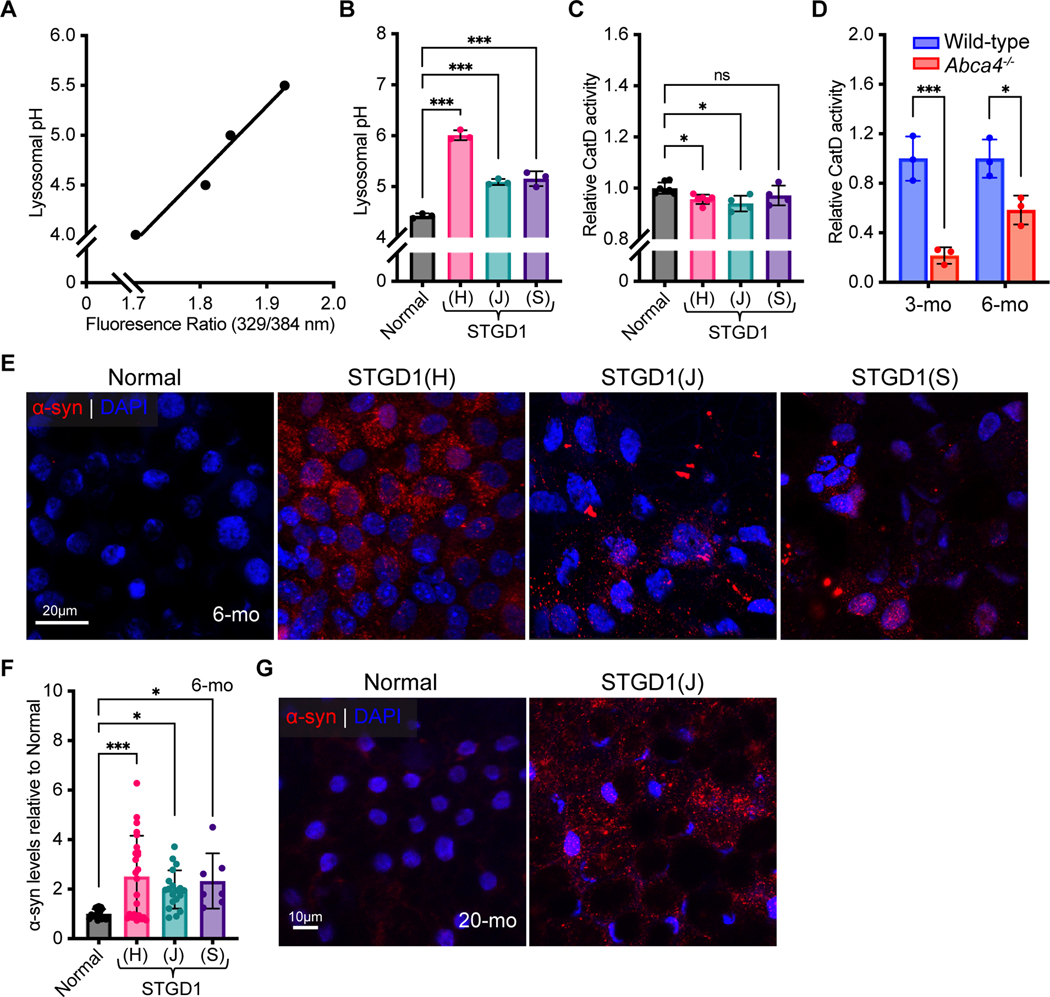
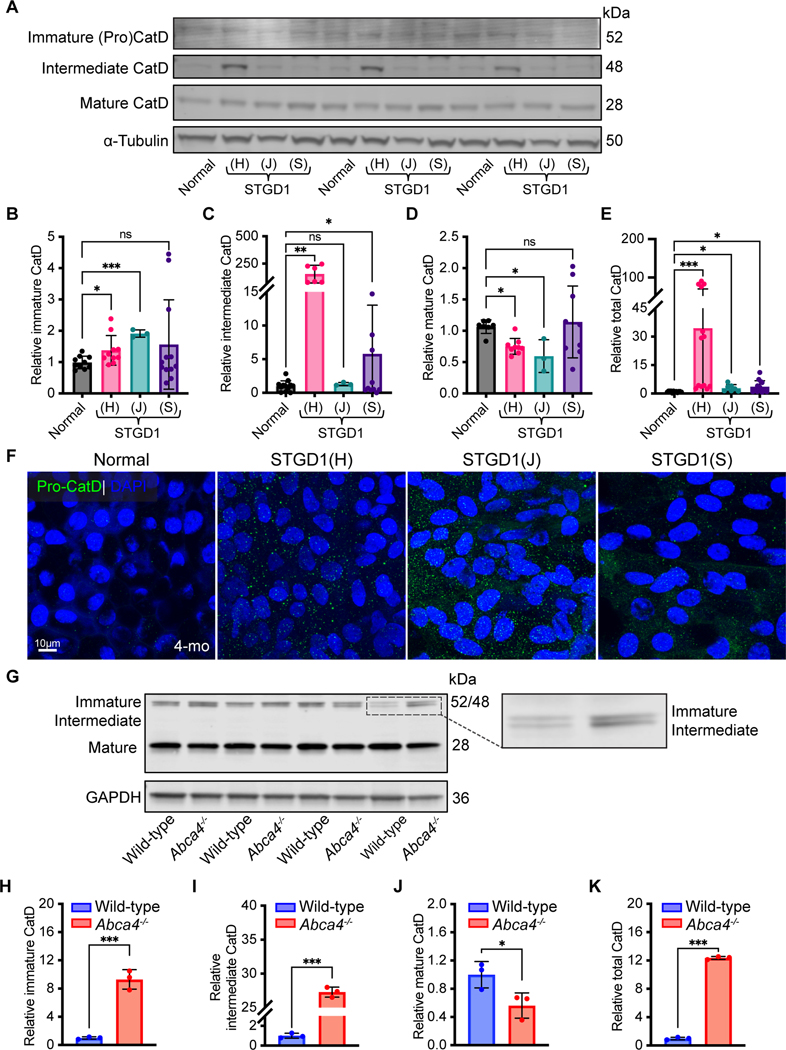
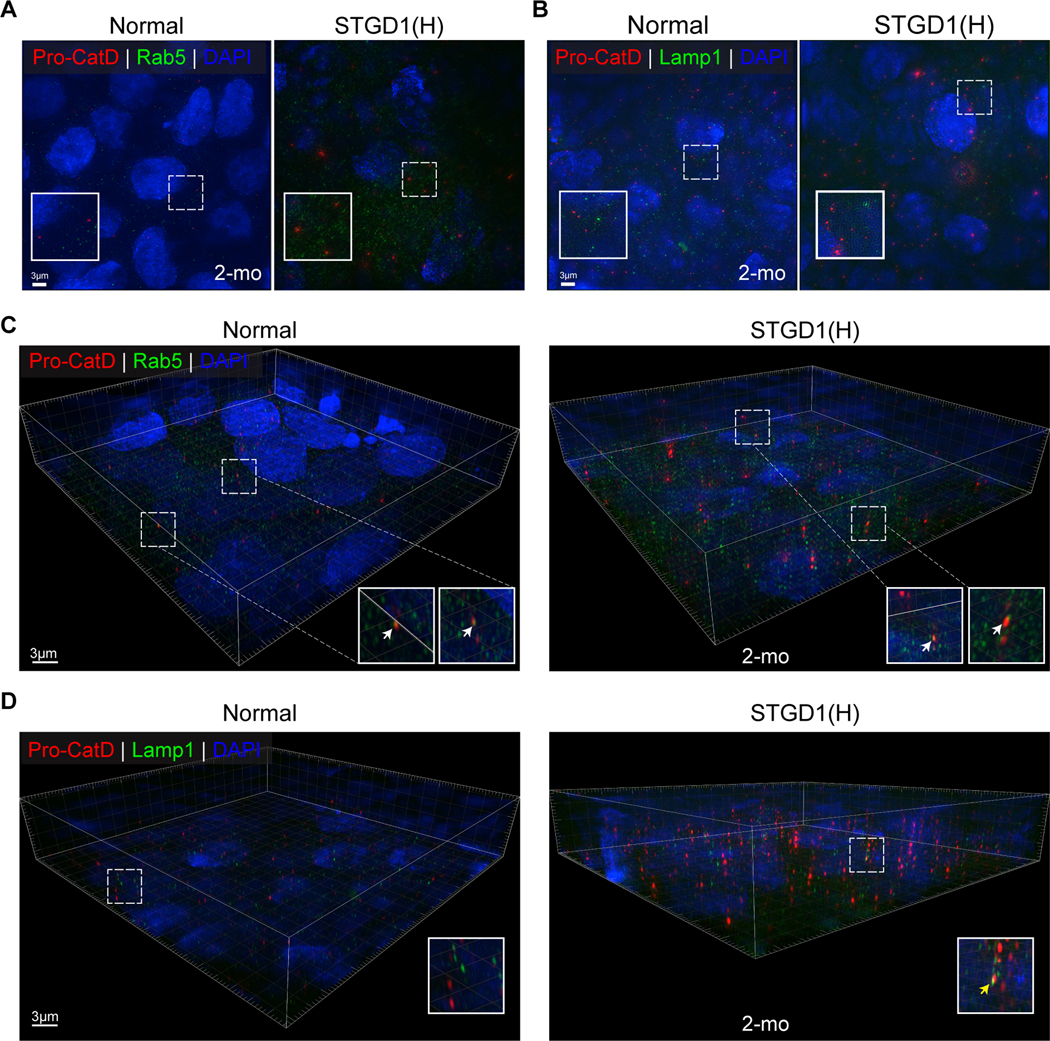
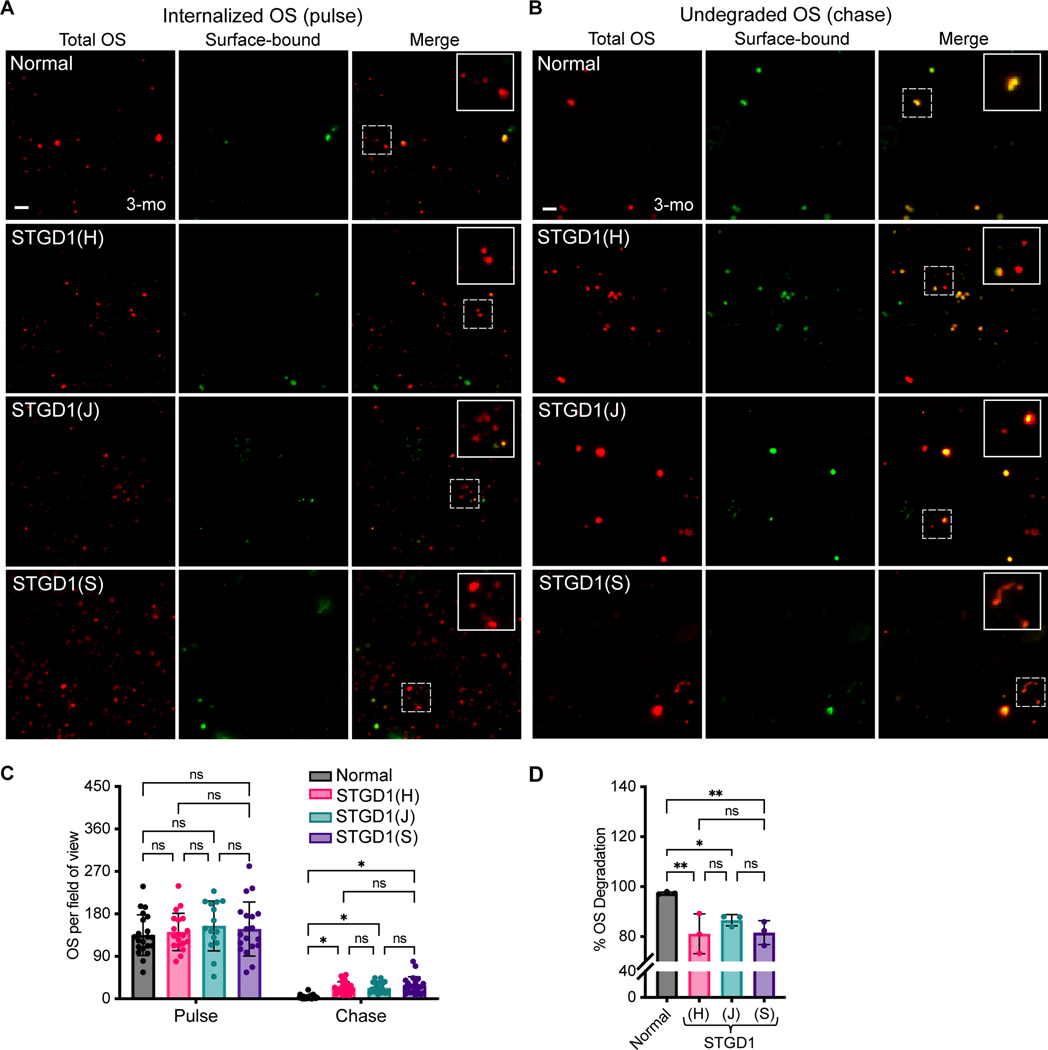
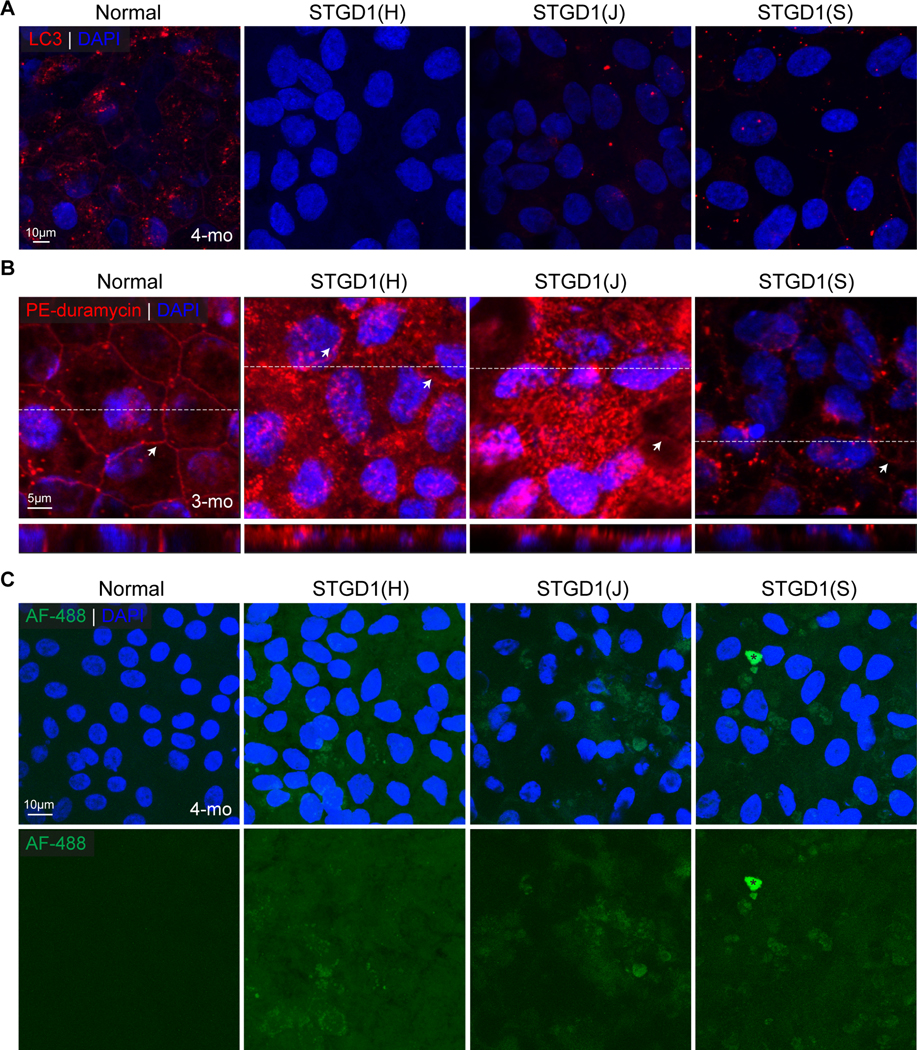
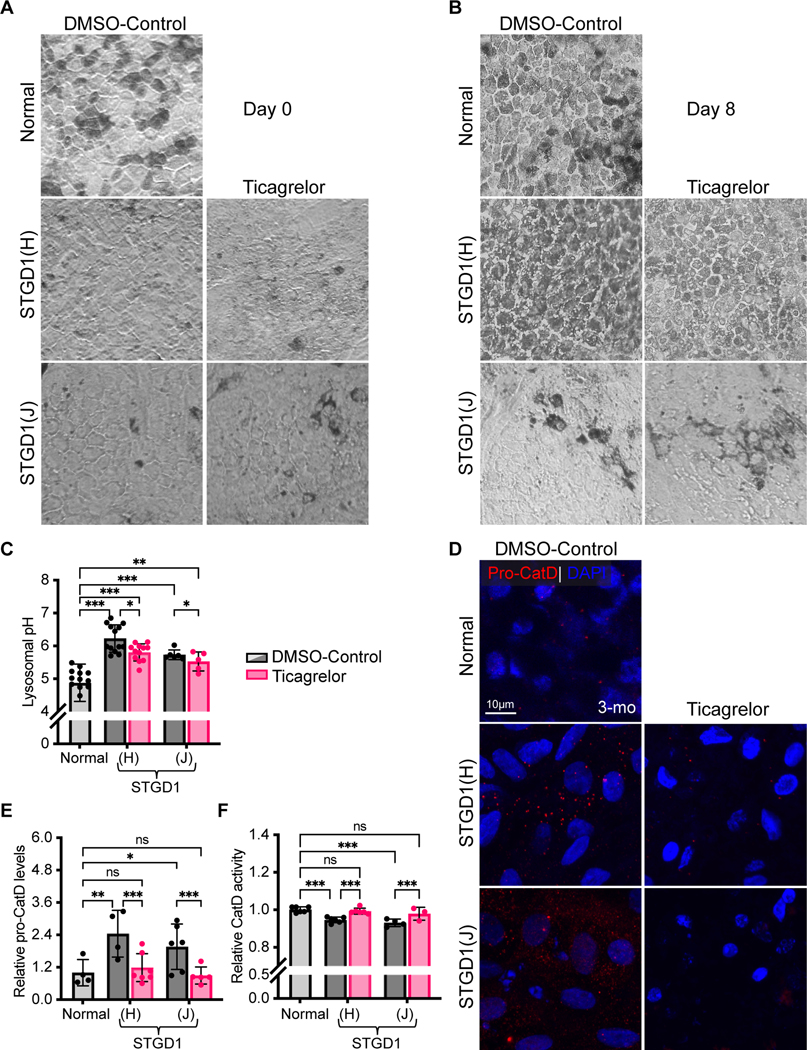
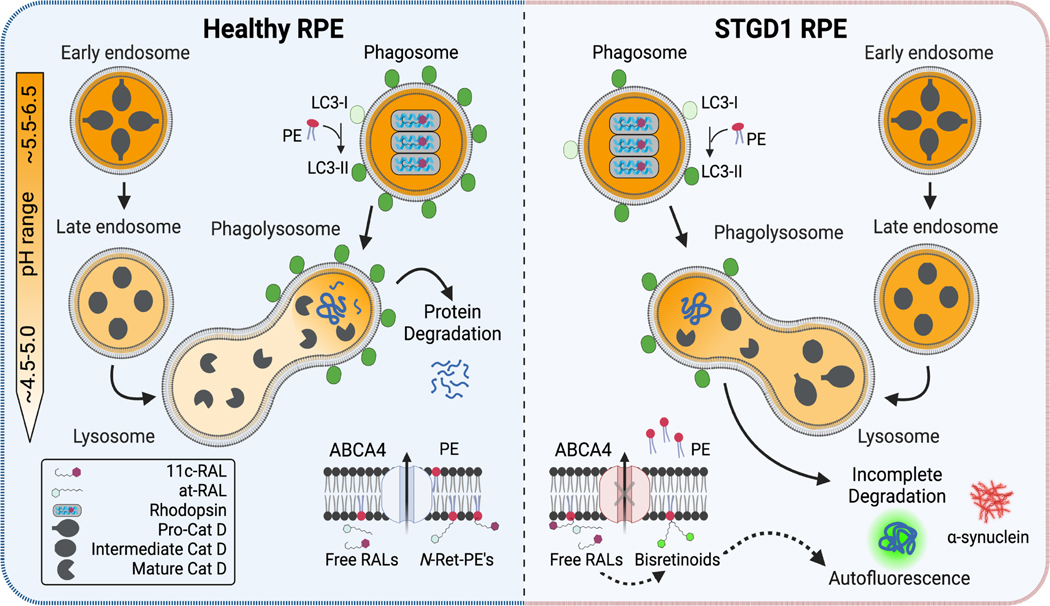
Recessive Stargardt disease (STGD1) is an inherited juvenile maculopathy caused by mutations in the ABCA4 gene, for which there is no suitable treatment. Loss of functional ABCA4 in the retinal pigment epithelium (RPE) alone, without contribution from photoreceptor cells, was shown to induce STGD1 pathology. Here, we identified cathepsin D (CatD), the primary RPE lysosomal protease, as a key molecular player contributing to endo-lysosomal dysfunction in STGD1 using a newly developed "disease-in-a-dish" RPE model from confirmed STGD1 patients. Induced pluripotent stem cell (iPSC)-derived RPE originating from three STGD1 patients exhibited elevated lysosomal pH, as previously reported in Abca4-/- mice. CatD protein maturation and activity were impaired in RPE from STGD1 patients and Abca4-/- mice. Consequently, STGD1 RPE cells have reduced photoreceptor outer segment degradation and abnormal accumulation of α-synuclein, the natural substrate of CatD. Furthermore, dysfunctional ABCA4 in STGD1 RPE cells results in intracellular accumulation of autofluorescent material and phosphatidylethanolamine (PE). The altered distribution of PE associated with the internal membranes of STGD1 RPE cells presumably compromises LC3-associated phagocytosis, contributing to delayed endo-lysosomal degradation activity. Drug-mediated re-acidification of lysosomes in the RPE of STGD1 restores CatD functional activity and reduces the accumulation of immature CatD protein loads. This preclinical study validates the contribution of CatD deficiencies to STGD1 pathology and provides evidence for an efficacious therapeutic approach targeting RPE cells. Our findings support a cell-autonomous RPE-driven pathology, informing future research aimed at targeting RPE cells to treat ABCA4-mediated retinopathies.

Keywords: cathepsin D; endo‐lysosome; phagocytosis; phosphatidylethanolamine; recessive Stargardt disease; retinal pigment epithelium.


Conflict of interest statement

Conflict of Interest Statement

ESYN, JH, and ZJ declare no conflicts of interest. Unrelated to this study, RAR served as a Principal Investigator for Sponsor Initiated Research Programs for: Eudora Therapeutics Inc., Biogen Inc., and NightStar Therapeutics. RAR served as a consultant for Replay Holdings, LLC; Oak Bay Biosciences, LTD; and Alexion Pharmaceuticals, Inc.

Figures

Figure 1.
Figure 1.. Lysosomal pH and CatD activity are compromised in STGD1 RPE cells.
Lysosomal pH was assessed using the LysoSensor Yellow/Blue DND-160 ratiometric probe comparing fluorescence excited at 329nm/384nm. (A) Representative calibration curve for lysosomal pH calculated from fluorescence ratios of normal RPE cells in the presence of dual ionophores (monensin and nigericin) to clamp intra-vesicular pH to known values. (B) At 10-weeks, lysosomal pH is elevated in all three STGD1 patient derived RPE cells compared to normal. (C) Relative CatD activity was measured by fluorometric assay with a CatD specific substrate. At 2-months, functional activity is reduced in STGD1(H) and STGD1(J) compared to normal. (D) Relative CatD activity was measured by fluorometric assay with a CatD specific substrate in RPE cells from wild-type (blue) and Abca4−/− mice (red) at 3-months (3-mo) and 6-months (6-mo). (E) Representative confocal images of RPE cells stained for α-synuclein (red), the physiological substrate of CatD, grown in transwell inserts for 6-months (6-mo). Scale bar = 20μm. (F) Quantification of α-synuclein pixel intensity from 2–5 fields of view/transwell. Compared to normal, STGD1 RPE cells showed ~2-fold increase in α-synuclein levels. (G) Representative confocal images of normal and STGD1(J) RPE cells grown in culture for 20-months (20-mo) and stained for α-synuclein. Scale bar = 10μm. Nuclei stained by DAPI (blue). Data presented as mean ± S.D.; *p<0.05, **p<0.01, *** p<0.001; n=3–4 biological samples (each containing pooled iPSC-RPE from two transwells or RPE from 2–3 mice)/genotype for B-D, and n=3 biological samples for E-G, experiments were repeated twice.
Figure 2.
Figure 2.. CatD protein maturation is impaired in STGD1 RPE cells.
CatD is first synthesized as a precursor protein. As CatD is transported from endosomes to lysosomes with increasing acidity, the immature CatD undergoes proteolytic processing to generate the functionally active mature form. (A) Representative immunoblots and (B-E) quantification of RPE cells at 10-weeks for relative levels of (B) immature, using an antibody specific to the pro-peptide domain (Abcam, ab134169) and (C) intermediate, (D) mature (heavy-chain) using an antibody recognizing the intermediate and mature domain of CatD (Abcam, ab75852). (E) Total CatD levels consisting of all three forms are quantified. All immunoblot quantifications were normalized to α-Tubulin. Immature CatD levels were increased by ~38% in STGD1(H), ~90% in STGD1(J) compared to normal. Mature CatD levels were decreased by ~25% to ~40% in STGD1 versus normal. (F) Representative confocal images of RPE cells grown on transwell inserts for 4-months (4-mo), then stained for immature CatD (Pro-CatD) in green using an antibody specific for the pro-peptide domain of CatD. Nuclei stained by DAPI (blue). Scale bar = 10μm. (G) Representative immunoblot, with zoomed-in view (right), and quantification for (H) immature, (I) intermediate, and (J) mature CatD protein levels (Abcam, ab6313). (K) Total CatD levels consisting of all three forms are quantified. All immunoblot quantifications were normalized to GAPDH, in RPE homogenates from 6-month-old wild-type and Abca4−/− mice. Data presented as mean ± S.D.; *p<0.05, **p<0.01, *** p<0.001; n=3–6 biological samples (each containing pooled iPSC-RPE from two transwells or RPE from 2–3 mice)/genotype for A-E and G-K, and n=3 transwells for F with experiments were repeated twice.
Figure 3.
Figure 3.. Mis-localization of immature CatD in STGD1(H) RPE cells.
Representative Super Resolution (SR) images showing en-face view of RPE cells grown in coverslips for 2-months (2-mo), then stained for immature CatD (Pro-CatD) in red and (A) endosomal marker Rab5 (green) or (B) lysosomal marker Lamp1 (green). Pro-CatD aggregates are evidenced in STGD1(H) RPE cells. Scale bar = 3μm. Representative 3D-SIM images of stained for Pro-CatD with (C) Rab5 (green) or (D) Lamp1 (green) in normal and STGD1(H) RPE cells. In normal cells, Pro-CatD only co-localizes with Rab5, indicated by white arrows. In contrast, Pro-CatD co-localizes with both Rab5 (white arrows) and Lamp1 (yellow arrow) in STGD1(H) RPE cells, indicative of mis-localization. Scale bar = 3μm. Magnified regions are outlined by white dotted boxes. Nuclei stained with DAPI (blue). n=3 coverslips/genotype, experiment repeated twice.
Figure 4.
Figure 4.. STGD1 RPE cells exhibit reduced outer segment processing.
Representative pulse-chase assay using OS conjugated to Alexa Fluor 647nm succinimidyl ester (red). RPE cells grown on transwells for 3-months (3-mo) were incubated with OS for 2-hours and fixed immediately (pulse, A) or unincorporated OS removed, followed by 2-hours chase, allowing for internalized OS to be degraded, and then fixed (chase, B). Surface-bound OS were labeled with antibody staining for rhodopsin (green) on unpermeabilized cells. In merged panels, internalized OS appear red only, while surface-bound OS appear yellow due to dual-labeling in red and green channels. (C) Quantification of internalized OS (pulse) or undegraded OS (chase) using ImageJ from 6–13 fields of view per transwell. (D) Percentage of OS degradation estimated from average internalized OS and undegraded OS for each transwell/genotype. STGD1 iPSC-RPE degraded ~80–85% of total internalized OS compared to ~98% digestion in normal. Scale bar = 2μm. Data presented as mean ± S.D.; *p<0.05, **p<0.01; n=3 biological samples/genotype for each phase (pulse or chase); experiments were repeated twice.
Figure 5.
Figure 5.. Compromised endo-lysosomal dynamics in STGD1 RPE cells.
(A) Representative confocal images staining for LC3 (red) in normal and STGD1 (H, J, S) RPE cells grown on transwell inserts for 4-months (4-mo). Scale bar = 10μm. (B) Representative confocal images of 3-months (3-mo) normal and STGD1 patient-derived RPE cells (H, J, S) treated with 1 μM Duramycin (red), specifically labeling the head-group of phosphatidylethanolamines (PE). Corresponding z-orthogonal representative confocal images are shown below the en-face images. Plasma membrane labeling of PE is indicated by white arrows in en-face images and observed by apical localization in z-orthogonal images of STGD1 and normal RPE cells. Scale bar = 5 μm. Nuclei stained by DAPI (blue). (C) Representative confocal images of merged autofluorescence (AF, green) and DAPI (top row) or AF alone (bottom row) in normal and STGD1 (H, J, S) RPE cells at 4-months (4-mo). AF was acquired with excitation at 488nm. Staining artefact is indicated by asterisks (*). Scale bar = 10μm. n=3 biological samples/genotype for each experiment; experiments were repeated three times.
Figure 6.
Figure 6.. Rescue of CatD deficiencies with Ticagrelor treatment.
STGD1 RPE cells were treated with 50μM Ticagrelor or DMSO (as vehicle control) for 1-week. Representative light micrographs of normal and STGD1 RPE cells, 3-months (3-mo) in culture, and prior to (A) treatment with Ticagrelor (on day 0) and (B) after 8-days in culture with media supplemented with Ticagrelor. Media was refreshed every other day. No gross morphological changes were evidenced comparing DMSO-Control and Ticagrelor treated STGD1 RPE cells. Normal RPE cells were treated with DMSO for control only. (C) Lysosomal pH was assessed using LysoSensor Yellow/Blue DND-160 probe along and pH values calculated from calibration curve from fluorescence ratios of normal cells in the presence of dual ionophores. Ticagrelor-treated STGD1 cells compared to DMSO-Control, showed reduced lysosomal pH. (D) Representative confocal images of RPE cells stained for Pro-CatD (red). STGD1 RPE cells treated with ticagrelor show diminished aggregation of Pro-CatD. (E) Quantification of pixel intensity from confocal images showed levels of Pro-CatD in Ticagrelor-treated STGD1 RPE were reduced to near normal control (light grey). (F) Relative CatD activity was measured by fluorometric assay with CatD specific substrate in RPE cells. CatD activity is restored to normal levels (light grey) in Ticagrelor-treated STGD1 cells. Nuclei stained by DAPI (blue). Scale bar = 10μm. Data presented as mean ± S.D.; *p<0.05, **p<0.01, *** p<0.001; n=3–6 transwells/genotype; experiment was repeated twice.
Figure 7.
Figure 7.. Mechanism of endo-lysosomal dysfunction in STGD1 RPE cells.
Schematic diagram summarizing our data in healthy RPE (left) and STGD1 RPE (right). A key pathological feature observed in STGD1 RPE cells is elevated endo-lysosomal pH. Thus, CatD protein maturation and its activity is perturbed resulting in reduced clearance of lysosomal waste, including OS-derived material, immature CatD, and α-synuclein. Consequently, incomplete degradation contributes to the pathological buildup of lipofuscin in STGD1 RPE cells. Additionally, free retinaldehydes (RALs) in the form of 11c-RAL or at-RAL, originating from proteolysis of rhodopsin, condense with phosphatidylethanolamine (PE) to form N-Ret-PE. In healthy RPE cells, ABCA4 translocates both N-Ret-PE and PE alone across internal membranes. In STGD1 RPE cells, deficiency in ABCA4 flippase activity results in perturbed PE internal membrane distribution and accumulation of PE aggregates along with autofluorescent-lipofuscin containing bisretinoids. CatD-mediated visual pigment degradation in the lysosomes is part of the hybrid autophagy-phagocytosis pathway (LAP) involving the microtubule-associated protein light chain 3 (LC3) protein. Conjugation of LC3-I (unlipidated) to the lipid phosphatidylethanolamine (PE) forming LC3-II is an essential step to mark the phagosomes for degradation by lysosomes. In STGD1 RPE cells, PE-mediated LAP dysfunction contributes further to defective phagolysosome activity. Diagram was created using BioRender.com.

Similar articles

Cited by

References

    1. Briggs CE, Rucinski D, Rosenfeld PJ, Hirose T, Berson EL, Dryja TP. Mutations in ABCR (ABCA4) in patients with Stargardt macular degeneration or cone-rod degeneration. Investigative ophthalmology & visual science. Sep 2001;42(10):2229–36. - PubMed
    1. Al-Khuzaei S, Broadgate S, Foster CR, et al. An Overview of the Genetics of ABCA4 Retinopathies, an Evolving Story. Genes (Basel). Aug 13 2021;12(8)doi: 10.3390/genes12081241 - DOI - PMC - PubMed
    1. Molday RS, Garces FA, Scortecci JF, Molday LL. Structure and function of ABCA4 and its role in the visual cycle and Stargardt macular degeneration. Prog Retin Eye Res. Jul 2022;89:101036. doi: 10.1016/j.preteyeres.2021.101036 - DOI - PubMed
    1. Allikmets R, Shroyer NF, Singh N, et al. Mutation of the Stargardt disease gene (ABCR) in age-related macular degeneration. Science. Sep 19 1997;277(5333):1805–7. doi: 10.1126/science.277.5333.1805 - DOI - PubMed
    1. Maugeri A, Klevering BJ, Rohrschneider K, et al. Mutations in the ABCA4 (ABCR) gene are the major cause of autosomal recessive cone-rod dystrophy. Am J Hum Genet. Oct 2000;67(4):960–6. doi: 10.1086/303079 - DOI - PMC - PubMed

MeSH terms

LinkOut - more resources