. 2024 Jun;28(11):e18443.
doi: 10.1111/jcmm.18443.

Decreased Tiam1-mediated Rac1 activation is responsible for impaired directional persistence of chondrocyte migration in microtia

Affiliations

Decreased Tiam1-mediated Rac1 activation is responsible for impaired directional persistence of chondrocyte migration in microtia

Yi Wu et al. J Cell Mol Med. 2024 Jun.

Abstract

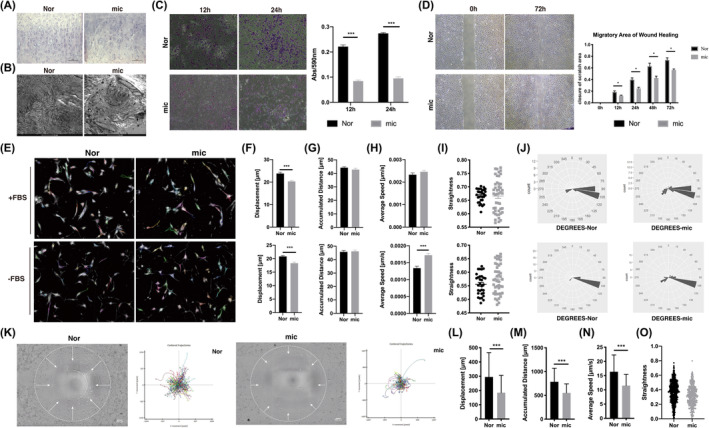
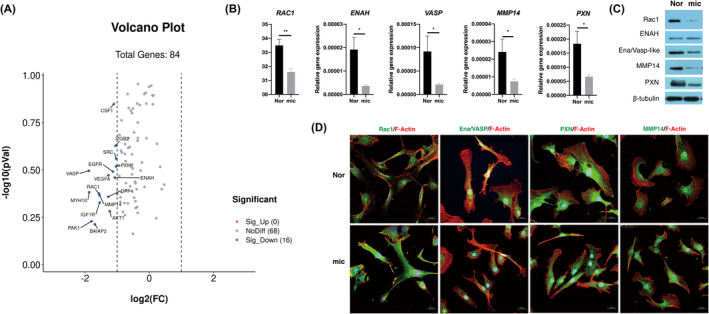
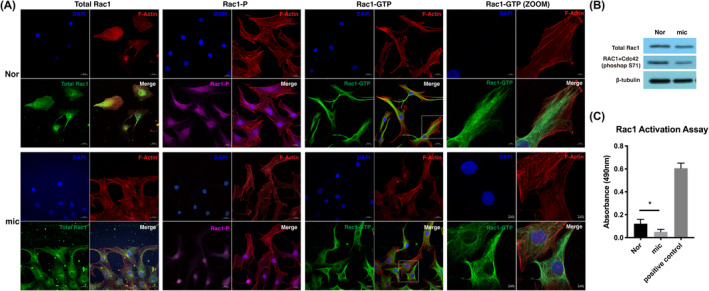
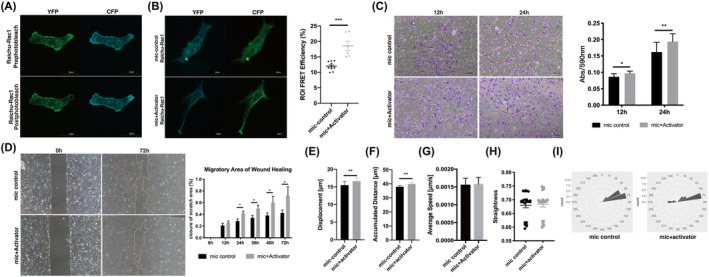
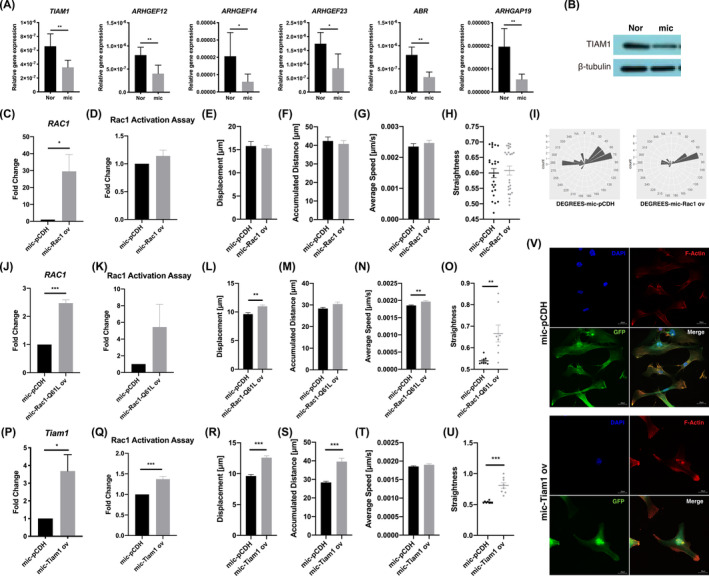
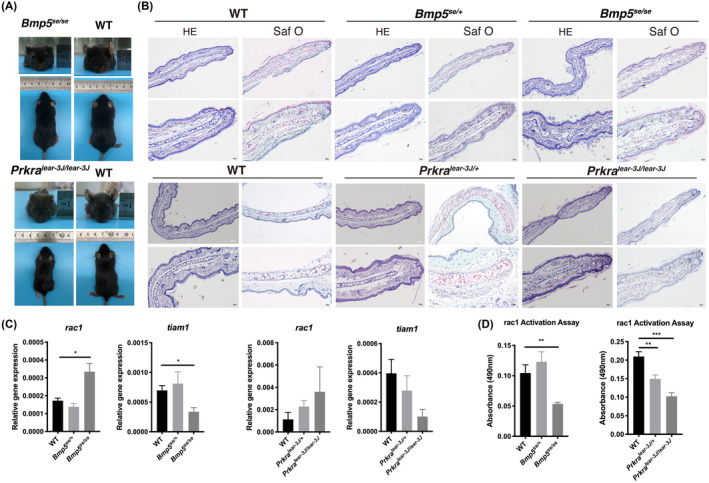
The human auricle has a complex structure, and microtia is a congenital malformation characterized by decreased size and loss of elaborate structure in the affected ear with a high incidence. Our previous studies suggest that inadequate cell migration is the primary cytological basis for the pathogenesis of microtia, however, the underlying mechanism is unclear. Here, we further demonstrate that microtia chondrocytes show a decreased directional persistence during cell migration. Directional persistence can define a leading edge associated with oriented movement, and any mistakes would affect cell function and tissue morphology. By the screening of motility-related genes and subsequent confirmations, active Rac1 (Rac1-GTP) is identified to be critical for the impaired directional persistence of microtia chondrocytes migration. Moreover, Rho guanine nucleotide exchange factors (GEFs) and Rho GTPase-activating proteins (GAPs) are detected, and overexpression of Tiam1 significantly upregulates the level of Rac1-GTP and improves directional migration in microtia chondrocytes. Consistently, decreased expression patterns of Tiam1 and active Rac1 are found in microtia mouse models, Bmp5se/J and Prkralear-3J/GrsrJ. Collectively, our results provide new insights into microtia development and therapeutic strategies of tissue engineering for microtia patients.

Keywords: Rac1‐GTP; Tiam1; chondrocytes; directional cell migration; microtia.


Conflict of interest statement

The authors declare no conflicts of interest.

Figures

FIGURE 1
FIGURE 1
Microtia chondrocytes showed impaired directional persistence during cell migration. (A) Representative haematoxylin and eosin (H&E) staining of normal auricle and microtia cartilage. Scale bars, 100 μm. (B) Representative photographs of transmission electron microscopy of normal auricle and microtia cartilage. Scale bars, 2 μm. (C) The Transwell assay and statistical analysis of Nor (n = 3) and mic (n = 9). (D) The wound healing assay and migratory area statistics of Nor (n = 3) and mic (n = 3). (E–J) Trajectories and analysis of spontaneous cell migration with the CLS high‐content cell imaging system, and the coefficient of variation of straightness and rotation degrees were shown as rose plots. Nor (n = 10), mic (n = 16). (K–O) The Oris™ Cell Migration Assay and statistical analysis of Nor (n = 4) and mic (n = 4), data were analysed using single cell tracking. The white circle indicates the initial state of cell migration, and the white arrow represents the cell migration stream. Scale bars, 200 μm. Nor indicates normal chondrocytes, mic indicates microtia chondrocytes. Data were analysed using unpaired two‐tailed Student's t test. Values are presented as the mean ± SEM. *Indicates p < 0.05 and ***indicates p < 0.001.
FIGURE 2
FIGURE 2
The expression of motility‐related genes decreased with aberrant localization in microtia chondrocytes. (A) Volcano plot of differentially expressed motility‐related genes in Nor (n = 3) and mic (n = 3) (Log2(FC) < −1). (B) The mRNA expression of RAC1, ENAH, VASP, MMP14 and PXN between Nor (n = 13) and mic (n = 12). Relative gene expression was normalized to GAPDH. (C) The protein level of Rac1, ENAH, Ena/VASP‐like, MMP14 and PXN in normal and microtia chondrocytes. (D) Representative immunofluorescence staining of five candidate proteins in normal and microtia chondrocytes. Experiment was repeated three times independently. Scale bars, 20 μm. Nor indicates normal chondrocytes, mic indicates microtia chondrocytes. Data were analysed using two‐tailed Student's t test. Values are presented as the mean ± SEM. *Indicates p < 0.05 and **indicates p < 0.01.
FIGURE 3
FIGURE 3
Rac1 showed abnormal conformational states in microtia chondrocytes. (A) Representative immunofluorescence imaging of different states of Rac1 in migratory chondrocytes based on wound healing assay. Scale bars, 20 μm, 5 μm. (B) The protein expression level of total Rac1 and phosphorylated Rac1 (S71) in microtia chondrocytes and normal chondrocytes. (C) The active Rac1 level of normal chondrocytes (n = 3) and microtia chondrocytes (n = 3). The relative content of active Rac1 was normalized by comparison with total protein, and the results were corrected with the positive control by the standard protein attached to the kit (n = 3). Nor indicates normal chondrocytes, mic indicates microtia chondrocytes. Data were analysed using two‐tailed Student's t test. Values are presented as the mean ± SEM. *Indicates p < 0.05.
FIGURE 4
FIGURE 4
Active Rac1 was critical for directional persistence of microtia chondrocyte migration. (A) Spatiotemporal maps of active Rac1 dynamics were imaged with a FRET‐based Rac1 biosensor in microtia chondrocytes. The white circle indicates photobleached area (ROI). Scale bars, 20 μm. (B) The FRET efficiency of microtia chondrocytes after 5 min of stimulation. Scale bars, 20 μm. (C) Transwell assay and statistical analysis of microtia chondrocytes (n = 4) with stimulation. (D) The wound healing assay and migratory area statistics of microtia chondrocytes (n = 3) and the corresponding stimulation group. (E–I) Trajectories and analysis of spontaneous cell migration of microtia chondrocytes and the corresponding stimulation group (n = 4). Mic indicates microtia chondrocytes. Data were analysed using two‐tailed Student's t test. Values are presented as the mean ± SEM. *Indicates p < 0.05, **indicates p < 0.01, and ***indicates p < 0.001.
FIGURE 5
FIGURE 5
The Rho guanine nucleotide exchange factor Tiam1 activated Rac1 and improved directional migration in microtia chondrocytes. (A) The mRNA expression of TIAM1, ARHGEF12, ARHGEF14, ARHGEF23, ABR and ARHGAP19 in mic (n = 9) and Nor (n = 4). (B) The protein level of TIAM1 in mic and Nor. (C) The mRNA expression of RAC1 in microtia chondrocytes after overexpression (n = 9). (D) The active Rac1 level of microtia chondrocytes (n = 3) after Rac1 overexpression. (E–I) Trajectories and analysis of spontaneous cell migration with the CLS high‐content cell imaging system in microtia chondrocytes after Rac1 overexpression. (J) The mRNA expression of RAC1 in microtia chondrocytes after Rac1‐Q61L overexpression (n = 4). (K) The active Rac1 level in microtia chondrocytes after Rac1‐Q61L overexpression (n = 4). (L–O) Trajectories and analysis of spontaneous cell migration in microtia chondrocytes after Rac1‐Q61L overexpression (n = 3). (P) The mRNA expression of Tiam1 in microtia chondrocytes after Tiam1 overexpression (n = 4). (Q) The active Rac1 level in microtia chondrocytes after Tiam1 overexpression (n = 3). (R–U) Trajectories and analysis of spontaneous cell migration in microtia chondrocytes after Tiam1 overexpression (n = 8). (V) Representative immunofluorescence imaging of microtia chondrocytes after Tiam1 overexpression. Scale bars, 20 μm. Nor indicates normal chondrocytes, mic indicates microtia chondrocytes. Data were analysed using two‐tailed Student's t test. Values are presented as the mean ± SEM. *Indicates p < 0.05, **indicates p < 0.01, and ***indicates p < 0.001.
FIGURE 6
FIGURE 6
Microtia mouse models exhibited an abnormal expression pattern of Tiam1/Rac1 in ear tissues. (A) The gross view of homozygous mutants of the Bmp5 se /J and Prkra lear ‐3J/GrsrJ microtia mouse models and wild‐type control. (B) Representative haematoxylin and eosin (H&E) staining and Saf O staining of auricular cartilage in Bmp5 se / se and Prkra lear‐3J/lear‐3J individuals, corresponding heterozygotes and WT mouse. Scale bars, 100 μm, 20 μm. (C) The rac1 and tiam1 mRNA expression of Bmp5 se/se (n = 4) mutant, prkra lear‐3J/lear‐3J mutant (n = 4), corresponding heterozygotes and WT individuals (n = 4), respectively. (D) The active rac1 level of Bmp5 se/se individuals (n = 6), prkra lear‐3J/lear‐3J individuals (n = 6), corresponding heterozygotes (n = 6) and WT control (n = 9). Data were analysed using one‐way ANOVA for multiple comparisons. Values are presented as the mean ± SEM. *Indicates p < 0.05, **indicates p < 0.01, and ***indicates p < 0.001.

Similar articles

Cited by

References

    1. Landau S, Szklanny AA, Machour M, et al. Human‐engineered auricular reconstruction (hEAR) by 3D‐printed molding with human‐derived auricular and costal chondrocytes and adipose‐derived mesenchymal stem cells. Biofabrication. 2021;14(1):015010. doi:10.1088/1758-5090/ac3b91 - DOI - PubMed
    1. Luquetti DV, Saltzman BS, Sie KC, et al. Interrater reliability of a phenotypic assessment tool for the ear morphology in microtia. Am J Med Genet A. 2013;161A(6):1264‐1272. doi:10.1002/ajmg.a.35963 - DOI - PMC - PubMed
    1. Huang Xin WC, Lei L, Yang M, Ye Z, Bo P. The phenolyzer suite: prioritizing the candidate genes involved in microtia. Ann Otol Rhinol Laryngol. 2019;128(6):556‐562. doi:10.1177/0003489419840052 - DOI - PubMed
    1. Yang R, Li R, Huang Z, et al. Mycn deficiency underlies the development of orofacial clefts in mice and humans. Hum Mol Genet. 2021;31:803‐815. doi:10.1093/hmg/ddab288 - DOI - PubMed
    1. Duan X, Bradbury SR, Olsen BR, Berendsen AD. VEGF stimulates intramembranous bone formation during craniofacial skeletal development. Matrix Biol. 2016;52–54:127‐140. doi:10.1016/j.matbio.2016.02.005 - DOI - PMC - PubMed

Substances

LinkOut - more resources