. 2025 Feb;14(5):e2401192.
doi: 10.1002/adhm.202401192. Epub 2024 Jun 28.

T Cells Spatially Regulate B Cell Receptor Signaling in Lymphomas through H3K9me3 Modifications

Affiliations

T Cells Spatially Regulate B Cell Receptor Signaling in Lymphomas through H3K9me3 Modifications

Lucy S Britto et al. Adv Healthc Mater. 2025 Feb.

Abstract

Activated B cell-like diffuse large B-cell lymphoma (ABC-DLBCL) is a subtype associated with poor survival outcomes. Despite identifying therapeutic targets through molecular characterization, targeted therapies have limited success. New strategies using immune-competent tissue models are needed to understand how DLBCL cells evade treatment. Here, synthetic hydrogel-based lymphoma organoids are used to demonstrate how signals in the lymphoid tumor microenvironment (Ly-TME) can alter B cell receptor (BCR) signaling and specific histone modifications, tri-methylation of histone 3 at lysine 9 (H3K9me3), dampening the effects of BCR pathway inhibition. Using imaging modalities, T cells increase DNA methyltransferase 3A expression and cytoskeleton formation in proximal ABC-DLBCL cells, regulated by H3K9me3. Expansion microscopy on lymphoma organoids reveals T cells increase the size and quantity of segregated H3K9me3 clusters in ABC-DLBCL cells. Findings suggest the re-organization of higher-order chromatin structures that may contribute to evasion or resistance to therapy via the emergence of novel transcriptional states. Treating ABC-DLBCL cells with a G9α histone methyltransferase inhibitor reverses T cell-mediated modulation of H3K9me3 and overcomes T cell-mediated attenuation of treatment response to BCR pathway inhibition. This study emphasizes the Ly-TME's role in altering DLBCL fate and suggests targeting aberrant signaling and microenvironmental cross-talk that can benefit high-risk patients.

Keywords: B cell; T cell; immunoengineering; lymphoid; organoids; tumor.


Conflict of interest statement

The authors declare no conflict of interest.

Figures

Figure 1
Figure 1
Unique signatures of posttranslational modification mediators in activated B cell‐like diffuse large B‐cell lymphoma (ABC‐DLBCL) tumors. a–e) Normalized gene expression in ABC‐DLBCL patients from the HMRC cohort of histone methyltransferases classified by histone H3 target, histone demethylases, histone deacetylases, heterochromatin proteins, and DNA methyltransferases. N = 246 patients, each dot represents a patient. f) Immunohistochemistry of CD20+ B cells (purple), CD4+ T cells (yellow), tri‐methylation of histone 3 at lysine 9 (H3K9me3) (green), DAPI (blue) in ABC‐DLBCL tissue microarrays from three different patients demonstrating regions of low and high CD4+ expression. g) Schematic of synthetic maleimide end‐functionalized 4‐arm polyethylene glycol (PEG‐4MAL) hydrogel‐based organoids functionalized with REDV adhesive peptides and protease‐degradable crosslinkers to study the effect of T cells on B cell receptor (BCR) signaling and histone modifications.
Figure 2
Figure 2
T cells dampen the killing efficacy of mucosa‐associated lymphoid tissue lymphoma translocation protein 1 (MALT1) inhibition. a) Representative image of CD20+ HBL‐1 ABC‐DLBCL cells (purple), CD3+ T cells (yellow), and DAPI (blue) in PEG‐4MAL hydrogel‐based organoids. b,c) Flow cytometry gating of side scatter plus area (SSC‐A) versus live/dead of HBL‐1 cells cultured with or without Jurkat T cells after 48 h of culture, followed by 48 h of MALT1 inhibition with 1000 nm or 2000 nm MI‐2 quantified as normalized survival. Mean ± SD. Two‐way ANOVA with Turkey's multiple comparison test. N = 6 to 12 organoids. d) Flow cytometry viability analysis was performed on Jurkat T cells after treatment with 2000 nm MI‐2 and quantified as normalized survival. Mean ± S.D. Two‐tailed unpaired t‐test. N = 5 technical replicates. e) Flow cytometry analysis of caspase‐3/‐7 activity and f) normalized cell viability of HBL‐1 cells co‐cultured with or without Jurkat T cells for 48 h, followed by 48 h MALT1 inhibition with 500, 1000, and 2000 nm MI‐2. Mean ± S.D. Two‐way ANOVA with Turkey's multiple comparison test. N = 6 organoids. g,h) Flow cytometry viability analysis was repeated with OCI‐LY10 cells cultured with or without Jurkat T cells for 48 h ± 1000 nm MI‐2 for 48 h quantified as normalized survival. Mean ± S.D. Two‐way ANOVA with Turkey's multiple comparison test. N = 5 to 6 organoids. i,j). Flow cytometry viability analysis of HBL‐1 cells cultured with or without primary CD4+ T cells for 48 h ± 1000 nm MI‐2 for 48 h quantified as normalized survival. Mean ± SD. Two‐way ANOVA with Turkey's multiple comparison test. N = 5 to 6 organoids. Each dot in (c), (h), and (j) represents a hydrogel‐based organoid.
Figure 3
Figure 3
T cells alter BCR signaling and DNA methyltransferase 3A (DNMT3A) expression in lymphoma organoids. a) Hypothetical T cell‐mediated changes to BCR signaling and methylation underlying dampening of MALT1 inhibition in ABC‐DLBCL. b,c) Flow cytometry histograms of Ki67 and mean fluorescent intensity (MFI) quantification in HBL‐1 cells and OCI‐LY10 cells cultured with and without Jurkat T cells for 48 h. Mean ± SD. Two‐tailed Mann‐Whitney test. N = 5 or 6 organoids. d,e) Flow cytometry MALT1 MFI output in HBL‐1 cells and OCI‐LY10 cells cultured with and without Jurkat T cells for 48 h. Mean ± SD. HBL‐1, two‐tailed unpaired t‐test. OCI‐LY10, two‐tailed Mann–Whitney test. N = 6 organoids. f,g) Flow cytometry phosphorylated Bruton's tyrosine kinase (pBTK) MFI output in HBL‐1 cells and Ly10 cells cultured with and without Jurkat T cells for 48 h. Mean ± SD. HBL‐1, two‐tailed Mann–Whitney test. Ly10, two‐tailed unpaired t‐test. N = 6 organoids. h) Flow cytometry DNMT3A MFI output in HBL‐1 cultured with and without Jurkat T cells for 48 h. Mean ± SD. Two‐tailed unpaired t‐test. N = 6 organoids. i) Representative images of DNMT3A (green), CD20 (purple), and DAPI (blue) staining in HBL‐1 cells cultured with or without Jurkat T cells for 48 h (top) and with and without subsequent 48 h treatment with G9α histone methyltransferase inhibitor, BRD4770, (bottom). j) DNMT3A expression in non‐treated conditions was quantified as integrated density per cell in defined aggregates (Singlet, Doublet, Cluster) in HBL‐1‐only organoids and in isolated B cell clusters (Cluster), clusters with T cells (Cluster + T Cell), and B cells contacting T cells (B Cell‐T Cell) in co‐culture organoids. The line represents the mean. Nested one‐way ANOVA with Turkey's multiple comparison test. N = 3 organoids. k) DNMT3A expression in BRD4770‐treated conditions was quantified as integrated density per cell in HBL‐1‐ only organoids and in B cell‐T cell niches in co‐culture organoids. The line represents the mean. Nested one‐way ANOVA with Turkey's multiple comparison test. N = 3 organoids. Each dot in b‐h represents a hydrogel‐based organoid. Each dot in (j) and (k) represents a single cell.
Figure 4
Figure 4
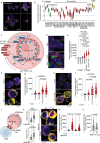
T cells alter H3K9me3 expression in ABC‐DLBCL organoids. a) Representative images of H3K9me3 (green), CD20 (purple), CD3 (orange), and DAPI (blue) staining before and after expansion in HBL‐1 ABC‐DLBCL organoids cultured alone or with Jurkat T cells for 48 h quantified as b) integrated density per cell. The line represents the mean. Nested one‐way ANOVA with Turkey's multiple comparison test. N = 3 organoids. c) Representative image of H3K9me3‐methylated nucleosome analysis on HBL‐1 cells in clusters with T cells from expanded organoids samples quantified as d) average cluster size and total cluster count across z‐stacks. Mean ± SD. Two‐tailed unpaired nested t‐test. N = 3 organoids. e) IF imaging analysis evaluating the effect of T cell conditioned‐media on H3K9me3 expression in HBL‐1 organoids quantified as integrated density per cell. The line represents the mean. Two‐tailed unpaired nested t‐test. N = 3 organoids. f) Representative images of tri‐methylation of lysine 27 (H3K27me3) (green), CD20 (purple), CD3 (orange), and DAPI (blue) staining in HBL‐1 organoids cultured alone or with Jurkat T cells for 48 h quantified as g) integrated density per cell. The line represents the mean. Nested one‐way ANOVA with Turkey's multiple comparison test. N = 3 organoids. h) Representative images of H3K9me3 IF‐labeling before and after expansion in OCI‐LY10 ABC‐DLBCL organoids cultured alone or with Jurkat T cells for 48 h quantified as i) integrated density per cell. The line represents the mean. Nested one‐way ANOVA with Turkey's multiple comparison test. N = 3 organoids. j) H3K9me3‐methylated nucleosome analysis on expanded samples repeated with OCI‐LY10 cells to quantify cluster count and average cluster size. Mean ± SD. Two‐tailed unpaired nested t‐test. N = 3 organoids. k) IF imaging analysis of H3K9me3 quantified as l) integrated density per cell was repeated with OCI‐LY3 ABC‐DLBCL organoids cultured alone or with Jurkat T cells for 48 h. The line represents the mean. Nested one‐way ANOVA with Turkey's multiple comparison test. N = 3 organoids. m) IF imaging analysis of H3K9me3 in OCI‐LY7 organoids cultured alone or with Jurkat T cells for 48 h was used as a germinal center B cell‐like diffuse large B‐cell lymphoma (GCB‐DLBCL) comparison for n) integrated density quantification per cell. The line represents the mean. Nested one‐way ANOVA with Turkey's multiple comparison test. N = 3 organoids. Spatial analyses in (b), (g), (i), (l), and (n) were performed on defined aggregates (Singlet, Doublet, Cluster) in B cell‐only organoids and isolated B cell clusters (Cluster), clusters with T cells (Cluster + T Cell), and B cells contacting T cells (B Cell–T Cell) in co‐culture organoids. Each dot represents a single cell.
Figure 5
Figure 5
ABC‐DLBCL cell‐T cell interactions engage the lamina‐associated cytoskeleton. a) IF staining of CD20 (purple), CD3 (yellow), and DAPI (blue) demonstrating B‐T cell interface formation in HBL‐1 lymphoma organoids. b) RNA sequencing analysis of cytoskeleton‐ and nuclearskeleton‐associated proteins in ABC‐DLBCL patient tissue biopsies from the HMRC cohort. N = 246 patients, each dot represents a patient. c) Hypothetical cooperation between chromatin at the nuclear membrane with nuclear cytoskeleton components, microtubules (MTs), F‐actin, and intermediate filaments involved in the formation of the B‐T cell interface. d) Representative images of Nesprin1 (green), CD20 (purple), CD3 (orange), and DAPI (blue) staining quantified as e) integrated density per cell in HBL‐1‐only organoids cultured alone or with Jurkat T cells for 48 h. The line represents the mean. Nested one‐way ANOVA with Turkey's multiple comparison test. N = 3 organoids. f) IF imaging analysis of alpha‐tubulin (yellow), IgM (purple) and DAPI (blue) staining expression quantified as g) integrated density per cell in in HBL‐1‐only organoids cultured alone or with Jurkat T cells for 48 h. The line represents the mean. Nested one‐way ANOVA with Turkey's multiple comparison test. N = 3 organoids. h) Alpha‐tubulin IF staining was repeated in OCI‐Ly10 organoids cultured alone or with Jurkat T cells for 48 h quantified as i) integrated density per cell. The line represents the mean. Nested one‐way ANOVA with Turkey's multiple comparison test. N = 3 organoids. j) Schematic of H3K9me3 polarization analysis in ABC‐DLBCLs in contact with T cells. k) Quantified distance in µm between “H3K9me3‐positive” and “H3K9me3‐negative” nuclear membrane IF expression to the plasma membrane in HBL‐1 and OCI‐Ly10 organoids cultured with T cells. Mean ± SD. Two‐tailed unpaired nested t‐test. N = 3 organoids. l) Representative IF images demonstrating the effect of BRD4770 on alpha‐tubulin expression quantified as m) integrated density per cell in HBL‐1‐only organoids and B cell‐T cell niches in co‐culture organoids after 48 h, with and without subsequent 48‐h incubation with 20 µM BRD4770. The line represents the mean. Nested one‐way ANOVA with Turkey's multiple comparison test. N = 3 organoids. n) Alpha‐tubulin expression in T cells before and after treatment with 20 µm BRD4770 quantified as integrated density. Mean ± SD. Two‐tailed unpaired nested t‐test. N = 3 organoids. Spatial analysis in (e), (g), and (i) was performed on defined aggregates (Singlet, Doublet, Cluster) in B cell‐only organoids and isolated B cell clusters (Cluster), clusters with T cells (Cluster + T Cell), and B cells contacting T cells (B Cell–T Cell) in co‐culture organoids. Each dot in (e), (g), (i), (k), (m), and (n) represents a single cell.
Figure 6
Figure 6
Increasing hydrogel stiffness impacts higher‐order H3K9me3 organization. a) The effect of organoid, modulated by indicated PEG‐4MAL weight percents, on nuclear circularity, hypothesized to be due to mechanical cues propagating the nucleus. The line represents the mean. Nested one‐way ANOVA with Turkey's multiple comparison test. N = 3 organoids. b) Representative images of H3K9me3 (green), CD20 (purple), and DAPI (blue) staining before and after expansion in HBL‐1 cells cultured in hydrogels for 48 h with indicated PEG‐4MAL weight percents quantified as c) integrated density per cell. The line represents the mean. Nested one‐way ANOVA with Turkey's multiple comparison test. N = 3 organoids. d) H3K9me3‐methylated nucleosome analysis from PEG‐4MAL‐modulated, expanded organoid samples quantified as average cluster size. The line represents the mean. Nested one‐way ANOVA with Turkey's multiple comparison test. N = 3 organoids. e) Comparison of H3K9me3‐methylated nucleosome analysis total cluster count across z‐stacks in HBL‐1 cells cultured in PEG‐4MAL‐modulated organoids and 7.5% PEG‐4MAL organoids co‐cultured with T cells. The line represents the mean. Nested one‐way ANOVA with Turkey's multiple comparison test. N = 3 organoids. f) Representative images of H3K27me3 (green), CD20 (purple), and DAPI (blue) staining in HBL‐1 cells cultured in hydrogels with indicated PEG‐4MAL weight percents quantified as g) integrated density per cell. The line represents the mean. Nested one‐way ANOVA with Turkey's multiple comparison test. N = 3 organoids. h) Flow cytometry gating of SSC‐A versus live/dead of HBL‐1 cells cultured in indicated PEG‐4MAL weight percents for 48 h, followed by 48 h MALT1 inhibition with 1000 nm MI‐2 quantified as i) percentage of live cells. Mean ± SD. Two‐way ANOVA with Turkey's multiple comparison test. N = 4 to 6 organoids. j) Linear regression analysis correlating average viability post‐MI‐2 treatment and average H3K9me3 expression per associated organoid condition. N = 3 organoids. Statistical significance determined by Pearson correlation coefficient. Each dot in (a), (c–e), and (g) represents a single cell. Each dot in (i) and (j) represents a hydrogel‐based organoid.
Figure 7
Figure 7
Inhibiting H3K9me3 improves the efficacy of MALT1 inhibition. a) Representative images demonstrating T cell‐mediated maintenance of H3K9me3 expression (green), CD20 (purple), and DAPI (blue) after sensitization with MI‐2 quantified as b) integrated density per cell in HBL‐1 organoids cultured alone or with Jurkat T cells for 48 h and subsequent 48 h incubation with 250 nm MI‐2. Quantification was performed on clusters in HBL‐1‐only organoids and in isolated B cell clusters (Cluster), clusters with T cells (Cluster + T Cell), and B cells contacting T cells (B Cell–T Cell) in co‐culture organoids. The line represents the mean. Nested one‐way ANOVA with Turkey's multiple comparison test. N = 3 organoids. c,d) Confirmation of H3K9me3 inhibition via IF imaging analysis quantified as integrated density per cell in HBL‐1‐only organoids cultured alone or with Jurkat T cells for 48 h and subsequent 48 h incubation with 10 or 20 µm BRD4770. The line represents the mean. Nested one‐way ANOVA with Turkey's multiple comparison test. N = 3 organoids. d) Representative images showing inhibition with BRD4770 reverses T cell‐mediated increase of H3K9me3 (green) in HBL‐1 cells. CD20 (purple), DAPI (blue). e) Imaging analysis of H3K9me3 integrated density per cell in Jurkat T cells in HBL‐1 co‐culture organoids after 48 h incubation with 20 µm BRD4770. Mean ± S.D. Two‐tailed unpaired nested t‐test. N = 3 organoids. f) Flow cytometry histograms and MFI quantification of Ki67, g) pBTK, h) MALT1 in HBL‐1 cells co‐cultured with Jurkat T cells for 48 h, with and without subsequent 48 h incubation with 20 µm BRD4770. Mean ± SD. Ki67 and pBTK, two‐tailed unpaired t‐test. MALT1, Two‐tailed Mann–Whitney test. N = 6 organoids. i) Proposed timeline of BRD4770 sensitization to improve the killing effects of MALT1 inhibition. j) Flow cytometry gating of SSC‐A versus live/dead of HBL‐1 cells cultured for 6 days with or without Jurkat T cells treated for 48 h with 1000 nm MI‐2 (left panel), 48 h co‐incubation with 1000 nm MI‐2 and 20 µm BRD4770 (middle panel), or 48 h sensitization with 20 µm BRD4770 with subsequent co‐administration of 1000 nm MI‐2 and 20 µm BRD4770 (right panel). k) Normalized survival comparing combination therapy in HBL‐1 only organoids and in l) HBL‐1 co‐cultured organoids. Controls include no treatment, 96 h treatment with BRD4770 only, and 48 h treatment with MI‐2 only. Mean ± SD. Ordinary one‐way ANOVA with Turkey's multiple comparison test. N = 5 to 8 organoids. Each dot in (b), (c), and (e) represents a single cell. Each dot in (f), (g), (h), (k), and (l) represents a hydrogel‐based organoid.

Similar articles

Cited by

References

    1. Sehn L. H., Gascoyne R. D., Blood 2015, 125, 22. - PubMed
    1. Schmitz R., Wright G. W., Huang D. W., Johnson C. A., Phelan J. D., Wang J. Q., Roulland S., Kasbekar M., Young R. M., Shaffer A. L., Hodson D. J., Xiao W., Yu X., Yang Y., Zhao H., Xu W., Liu X., Zhou B., Du W., Chan W. C., Jaffe E. S., Gascoyne R. D., Connors J. M., Campo E., Lopez‐Guillermo A., Rosenwald A., Ott G., Delabie J., Rimsza L. M., Tay Kuang Wei K., et al., N. Engl. J. Med. 2018, 378, 1396. - PMC - PubMed
    1. Phelan J. D., Young R. M., Webster D. E., Roulland S., Wright G. W., Kasbekar M., Shaffer A. L., Ceribelli M., Wang J. Q., Schmitz R., Nakagawa M., Bachy E., Huang D. W., Ji Y., Chen L., Yang Y., Zhao H., Yu X., Xu W., Palisoc M. M., Valadez R. R., Davies‐Hill T., Wilson W. H., Chan W. C., Jaffe E. S., Gascoyne R. D., Campo E., Rosenwald A., Ott G., Delabie J., et al., Nature 2018, 560, 387. - PMC - PubMed
    1. Davis R. E., Brown K. D., Siebenlist U., Staudt L. M., J. Exp. Med. 2001, 194, 1861. - PMC - PubMed
    1. Burger J. A., Wiestner A., Nat. Rev. Cancer 2018, 18, 148. - PubMed

MeSH terms

Substances

LinkOut - more resources