. 2024 Jun 5;20(6):e1012103.
doi: 10.1371/journal.pcbi.1012103. eCollection 2024 Jun.

Quantitative estimates of the regulatory influence of long non-coding RNAs on global gene expression variation using TCGA breast cancer transcriptomic data

Affiliations

Quantitative estimates of the regulatory influence of long non-coding RNAs on global gene expression variation using TCGA breast cancer transcriptomic data

Xiaoman Xie et al. PLoS Comput Biol. .

Abstract

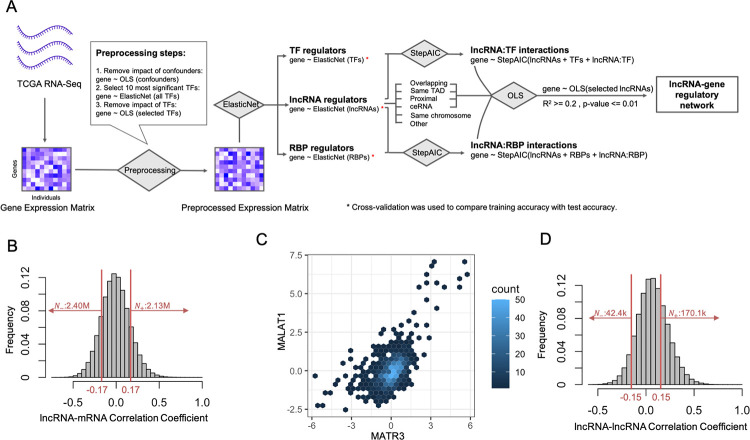
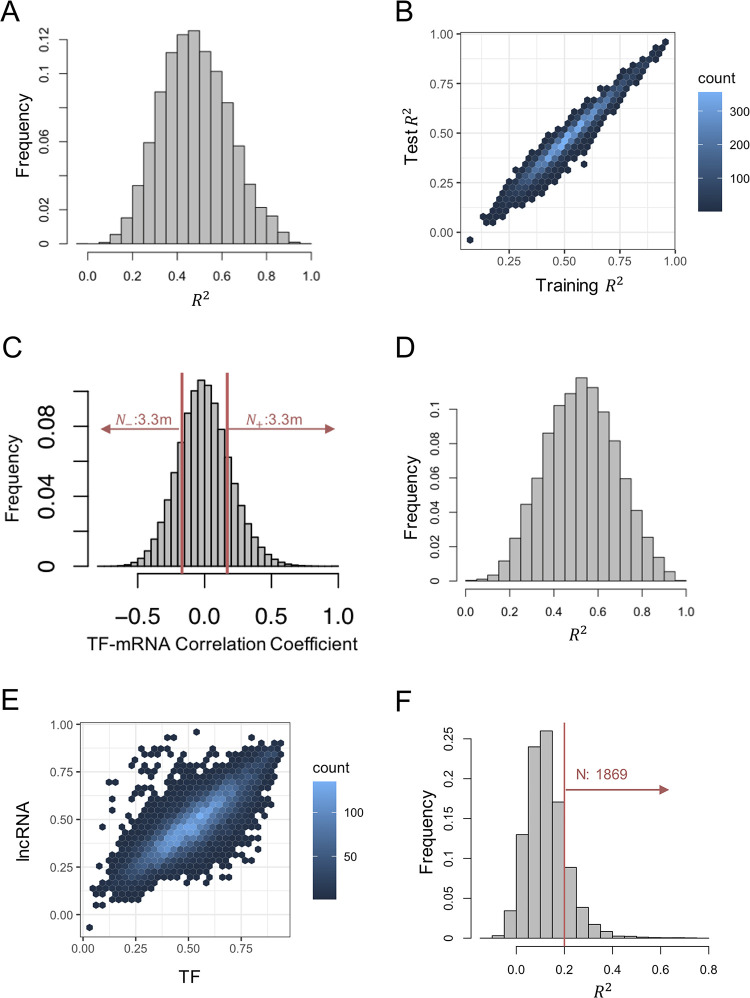
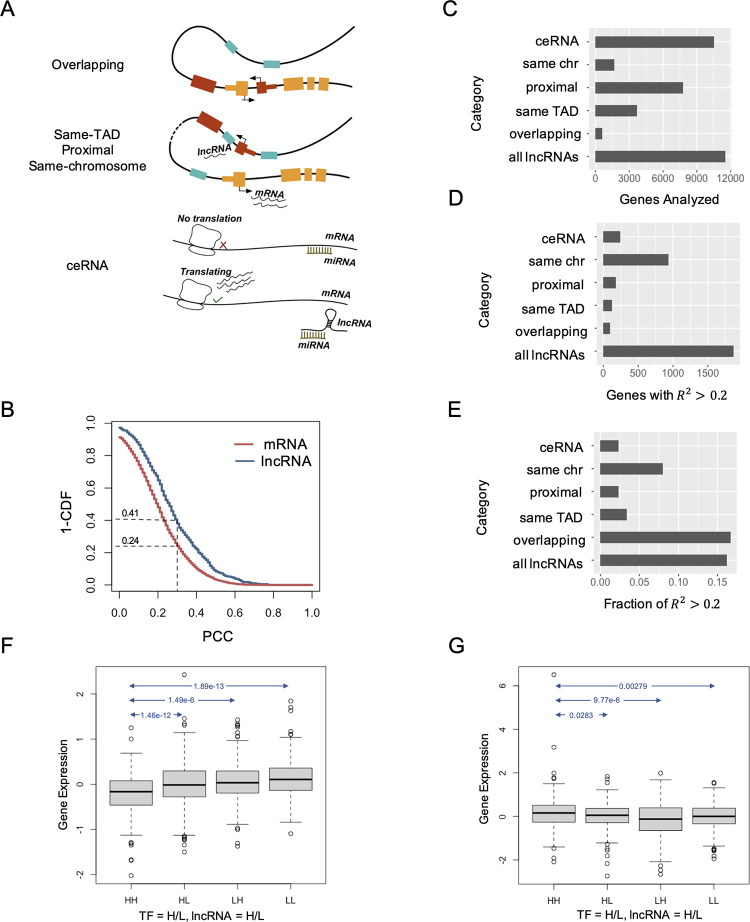
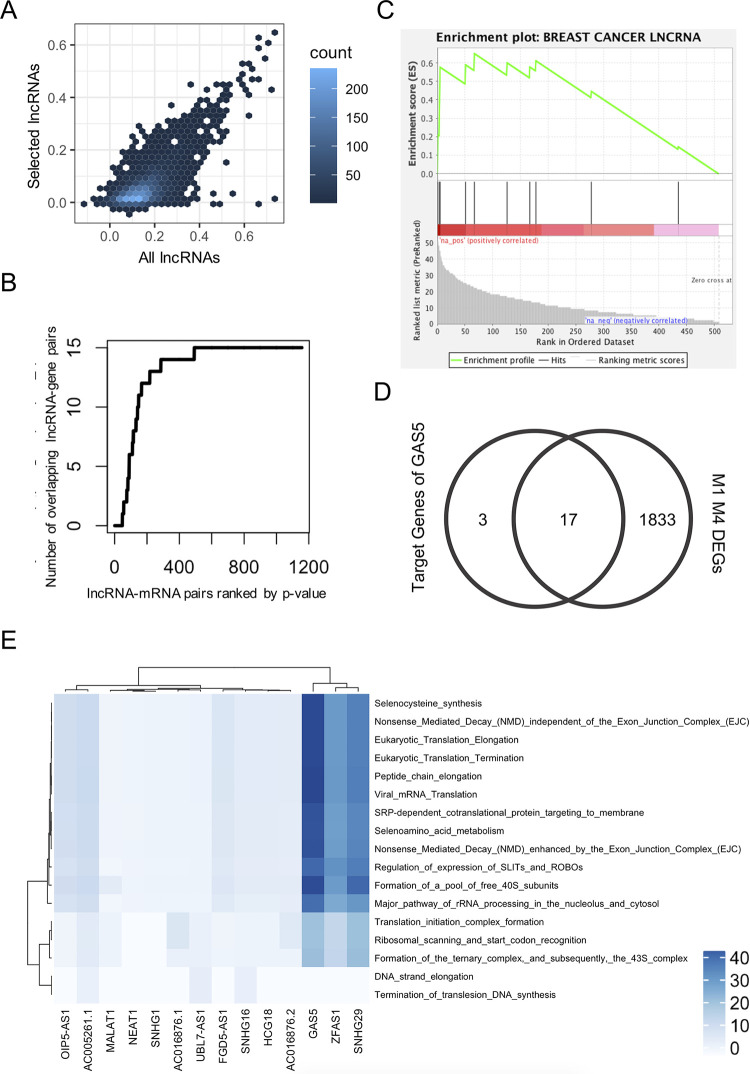
Long non-coding RNAs (lncRNAs) have received attention in recent years for their regulatory roles in diverse biological contexts including cancer, yet large gaps remain in our understanding of their mechanisms and global maps of their targets. In this work, we investigated a basic unanswered question of lncRNA systems biology: to what extent can gene expression variation across individuals be attributed to lncRNA-driven regulation? To answer this, we analyzed RNA-seq data from a cohort of breast cancer patients, explaining each gene's expression variation using a small set of automatically selected lncRNA regulators. A key aspect of this analysis is that it accounts for confounding effects of transcription factors (TFs) as common regulators of a lncRNA-mRNA pair, to enrich the explained gene expression for lncRNA-mediated regulation. We found that for 16% of analyzed genes, lncRNAs can explain more than 20% of expression variation. We observed 25-50% of the putative regulator lncRNAs to be in 'cis' to, i.e., overlapping or located proximally to the target gene. This led us to quantify the global regulatory impact of such cis-located lncRNAs, which was found to be substantially greater than that of trans-located lncRNAs. Additionally, by including statistical interaction terms involving lncRNA-protein pairs as predictors in our regression models, we identified cases where a lncRNA's regulatory effect depends on the presence of a TF or RNA-binding protein. Finally, we created a high-confidence lncRNA-gene regulatory network whose edges are supported by co-expression as well as a plausible mechanism such as cis-action, protein scaffolding or competing endogenous RNAs. Our work is a first attempt to quantify the extent of gene expression control exerted globally by lncRNAs, especially those located proximally to their regulatory targets, in a specific biological (breast cancer) context. It also marks a first step towards systematic reconstruction of lncRNA regulatory networks, going beyond the current paradigm of co-expression networks, and motivates future analyses assessing the generalizability of our findings to additional biological contexts.


Conflict of interest statement

The authors have declared that no competing interests exist.

Figures

Fig 1
Fig 1. Co-expression among mRNAs and lncRNAs.
(A) Graphical Abstract of Workflow. RNA-Seq data for 1,217 primary tumor samples from 1,092 breast cancer patients were obtained from TCGA-BRCA cohort. The processed transcriptomic data (see Methods) include expression profiles for 1,079 lncRNAs and 13,963 mRNAs. Using ElasticNet regression, significant lncRNA, TF, and RBP regulators were identified. These significant lncRNAs with their supporting mechanisms or involved in interaction terms were then used in an Ordinary Least Squares (OLS) regression model to construct the final lncRNA-regulatory network. (B) Histogram of Pearson correlation coefficients of lncRNA-mRNA pairs. Among ~15M pairs analyzed, ~4.5M pairs had absolute value of Pearson correlation above 0.17, which corresponds to Bonferroni corrected p-value of 0.05. (C) Density scatter plot of expression of lncRNA MALAT1 and mRNA MATR3. MALAT1 and MATR3 are highly correlated with Pearson correlation of 0.58 (Bonferroni corrected p-value of 1.45e-109). (D) Histogram of pairwise Pearson correlations between lncRNA-lncRNA pairs. There are ~170K pairs positively correlated with correlation greater than 0.15 and 42K negatively correlated pairs with correlation lower than -0.15 (Bonferroni corrected p-value of 0.05).
Fig 2
Fig 2. LncRNA-mRNA co-expression network.
(A) Histogram of test R2 when mRNA expression values were modeled using lncRNA. For each mRNA, Elastic Net algorithm was used to select ~10 most significant lncRNAs as predictors, which were then used to predict the mRNA’s expression using ordinary least squares (OLS) regression. Average test R2 in a 5-fold cross-validation was calculated for each mRNA. (Each “fold” involved selecting predictor lncRNAs and training the model on 80% of samples and testing on the remaining 20%.) (B) Density scatter plot of test R2 and overall (“training”) R2 for the models. Overall R2 is calculated by training the model on all samples and calculating its R2 on all samples. Average test R2 values were generally similar to the corresponding overall R2 values of the same gene, indicating that overfitting is not a major concern. (C) Histogram of pairwise Pearson correlations for TF-mRNA pairs. About 6.6M of the pairs (37.57% of all pairs) have a PCC with absolute value greater than 0.17 (Bonferroni corrected p-value of 0.05). (D) Histogram of test R2 when mRNA expression values were modeled using TFs selected using Elastic Net, in a five-fold cross validation. (E) Scatter plot of test R2 values for models utilizing TFs or lncRNAs (x and y axes respectively) as predictors. Each point represents an mRNA whose expression is predicted by the models. PCC between two axes is 0.82 (p-value < 2.2e-16). (F) Histogram of test R2 values (average over five folds of cross-validation) when lncRNAs were used to model mRNA expression values from which TF-based predictions have been subtracted away.
Fig 3
Fig 3. Contribution of lncRNAs from different “mechanistic” categories.
(A) Schematic of lncRNA regulation mechanisms. The figure shows the four classes of lncRNAs acting in cis with the target gene and one type of trans-acting lncRNAs (ceRNA). (B) Overlapping lncRNA-mRNA pairs (blue) are more correlated than overlapping pairs of mRNAs (red). X-axis shows the Pearson Correlation Coefficient (PCC) and the Y-axis shows for any value of PCC what fraction of lncRNA-gene pairs have correlation above that value. (CDF refers to cumulative distribution function.) (C) Number of genes whose expression was modeled using lncRNAs from each category. For instance, only 588 genes had an overlapping lncRNA to use as predictor, thus only these genes could be modeled. (D,E) Number of genes (D) and fraction of genes (E) that were modeled well (test R2 > 0.2, on average across five folds of cross-validation) using lncRNAs from different categories. The fraction (E) is calculated as the ratio of respective numbers from C and D. (F) Normalized expression of gene LRP1 in four groups of samples where lncRNA TMPO-AS1 and the TF EBF1 are expressed at above (high) or below (low) their respective median level. In each category label, the first ‘H/L’ indicates high/low expression of TF and the second ‘H/L’ corresponds to the lncRNA. LRP1 expression is significantly lower in samples where both the TF and the lncRNA are highly expressed (HH) compared with the other three groups where either the TF or the lncRNA or both are lowly expressed (t-test p-values are shown for each between group comparison). The interaction term representing EBF1 and TMPO-AS1 has a p-value of 3.23E-10 in modeling gene LRP1. (G) Gene MYL12A expression is significantly higher in samples with high levels of RBP FXR1 and lncRNA OIP5-AS1 (HH) compared to the three other groups (HL, LH or LL) where either regulator has low expression. The interaction term representing FXR1 and OIP5-AS1 has a p-value of 7.8E-17 in modeling gene MYL12A.
Fig 4
Fig 4. Expression modeling and regulatory network using selected lncRNAs with location- or mechanism-based supporting evidence.
(A) R2 values using selected lncRNAs (on average ~2 lncRNAs per target gene) were comparable to those obtained when utilizing all lncRNAs as candidates. (B) Network edges (lncRNA-gene pairs) in the “overlapping” category are strongly enriched among the edges with the strongest p-values from expression modeling. X-axis represents the network edges sorted by p-value from expression modeling, and Y-axis shows the number of “overlapping” lncRNA-gene pairs among the top x network edges, for each value of x. (C) Breast cancer related lncRNAs are enriched among lncRNAs with high degrees in the regulation network. Shown is the standard graphical output from the GSEA tool. X-axis represents lncRNAs sorted by the number of putative gene targets (edges in the network). Breast cancer-related lncRNAs from the literature are marked by vertical bars in the middle panel, and the top panel (green curve0 shows the “enrichment score” statistic calculated by GSEA as a function of the rank order. This analysis shows that breast cancer-related lncRNAs tend to have significantly more targets compared to other lncRNAs, in our network. (D) Venn diagram of predicted GAS5 targets that are also differentially expressed genes (DEGs) between M1 and M4 cell lines. (E) Target genes of four high-degree lncRNAs (more than 25 targets each) were enriched in REACTOME pathways related to translation processes.

Similar articles

References

    1. Yin X, Jing Y, Xu H. Mining for missed sORF-encoded peptides. Expert Rev Proteomics. 2019;16(3):257–66. Epub 2019/01/24. doi: 10.1080/14789450.2019.1571919 . - DOI - PubMed
    1. Gao F, Cai Y, Kapranov P, Xu D. Reverse-genetics studies of lncRNAs-what we have learnt and paths forward. Genome Biol. 2020;21(1):93. Epub 2020/04/16. doi: 10.1186/s13059-020-01994-5 ; PubMed Central PMCID: PMC7155256. - DOI - PMC - PubMed
    1. St Laurent G, Wahlestedt C, Kapranov P. The Landscape of long noncoding RNA classification. Trends Genet. 2015;31(5):239–51. Epub 2015/04/15. doi: 10.1016/j.tig.2015.03.007 ; PubMed Central PMCID: PMC4417002. - DOI - PMC - PubMed
    1. Vance KW, Ponting CP. Transcriptional regulatory functions of nuclear long noncoding RNAs. Trends Genet. 2014;30(8):348–55. Epub 2014/06/30. doi: 10.1016/j.tig.2014.06.001 ; PubMed Central PMCID: PMC4115187. - DOI - PMC - PubMed
    1. Cao H, Xu D, Cai Y, Han X, Tang L, Gao F, et al.. Very long intergenic non-coding (vlinc) RNAs directly regulate multiple genes in cis and trans. BMC Biol. 2021;19(1):108. Epub 2021/05/22. doi: 10.1186/s12915-021-01044-x ; PubMed Central PMCID: PMC8139166. - DOI - PMC - PubMed

MeSH terms