. 2024 Jun 11;121(24):e2403054121.
doi: 10.1073/pnas.2403054121. Epub 2024 Jun 5.

Protective function and differentiation cues of brain-resident CD8+ T cells during surveillance of latent Toxoplasma gondii infection

Affiliations

Protective function and differentiation cues of brain-resident CD8+ T cells during surveillance of latent Toxoplasma gondii infection

Rémi Porte et al. Proc Natl Acad Sci U S A. .

Abstract

Chronic Toxoplasma gondii infection induces brain-resident CD8+ T cells (bTr), but the protective functions and differentiation cues of these cells remain undefined. Here, we used a mouse model of latent infection by T. gondii leading to effective CD8+ T cell-mediated parasite control. Thanks to antibody depletion approaches, we found that peripheral circulating CD8+ T cells are dispensable for brain parasite control during chronic stage, indicating that CD8+ bTr are able to prevent brain parasite reactivation. We observed that the retention markers CD69, CD49a, and CD103 are sequentially acquired by brain parasite-specific CD8+ T cells throughout infection and that a majority of CD69/CD49a/CD103 triple-positive (TP) CD8+ T cells also express Hobit, a transcription factor associated with tissue residency. This TP subset develops in a CD4+ T cell-dependent manner and is associated with effective parasite control during chronic stage. Conditional invalidation of Transporter associated with Antigen Processing (TAP)-mediated major histocompatibility complex (MHC) class I presentation showed that presentation of parasite antigens by glutamatergic neurons and microglia regulates the differentiation of CD8+ bTr into TP cells. Single-cell transcriptomic analyses revealed that resistance to encephalitis is associated with the expansion of stem-like subsets of CD8+ bTr. In summary, parasite-specific brain-resident CD8+ T cells are a functionally heterogeneous compartment which autonomously ensure parasite control during T. gondii latent infection and which differentiation is shaped by neuronal and microglial MHC I presentation. A more detailed understanding of local T cell-mediated immune surveillance of this common parasite is needed for harnessing brain-resident CD8+ T cells in order to enhance control of chronic brain infections.

Keywords: Toxoplasma gondii; apicomplexan parasite; brain; chronic infection; tissue-resident T cells.


Conflict of interest statement

Competing interests statement:The authors declare no competing interest.

Figures

Fig. 1.
Fig. 1.
Peripheral CD8+ T cell depletion during latent T. gondii infection leads to recrudescence of parasite in the spleen but not in the brain. (A) Schematics of experimental workflow: C57BL/6 mice were infected with 200 tachyzoites of GRA6-OVA-expressing T. gondii Pru. At chronic phase (d34pi), mice were administered with an anti-CD8β antibody or an isotype control, twice at d34pi and d36pi, and then once a week for 2 wk until d50pi. (B) Representative Facs plots showing effects of anti-CD8β treatment in the spleen and brain. Numbers on plots show the percentage ±SD of CD8+ T cells out of single, live, CD3+ T cells. (C and D) Bar graphs showing absolute number of CD8+ T cells in the spleen (C) and brain (D) at d50pi. (E) Bar graph showing the proportion of CD69/CD49a/CD103 triple-negative subset (circulating) among brain CD8+ T cells at d50pi. (F) Bar graph showing total number of spleen cells at d50pi, reflecting the splenomegaly associated with anti-CD8 depletion. (CF) Each dot represents one mouse. Bars show the mean ± SD of N = 15 (isotype) vs. 16 (anti-CD8β) mice per group, pooled from three independent experiments. Mann-Whitney tests between isotype-treated and anti-CD8-treated groups. (G) Spleen parasite burden measured by qPCR on genomic DNA extracted from the spleen. Each dot represents one mouse with N = 15 (isotype) vs. 16 (anti-CD8β) mice per group, pooled from three independent experiments. The dotted line indicates the limit of quantification. Parasite DNA was detectable in 6 out of 16 anti-CD8β-treated mice, vs. 0 out of 15 isotype-treated control mice (P = 0.0177, Fisher exact test). (H) Brain parasite burden measured by qPCR on genomic DNA extracted from the brain. Each dot represents one mouse with N = 15 (isotype) vs. 16 (anti-CD8β) mice per group, pooled from three independent experiments. (C and F) Mann-Whitney test between isotype-treated and anti-CD8β-treated groups. (D, E, and H) Unpaired t test between isotype-treated and anti-CD8β-treated groups.
Fig. 2.
Fig. 2.
Kinetics of CD69, CD49a, and CD103 surface expression on brain-isolated CD8α+ T cells during T. gondii infection. (A) Schematics of experimental workflow: C57BL/6 mice were infected intraperitoneally with 200 tachyzoites of GRA6-OVA-expressing T. gondii Pru. Brain-isolated cells were analyzed by flow cytometry at acute (d13pi) and chronic (d32pi and d76pi) stages. (B and C) Gating strategy to analyze surface expression of CD69, CD49a, and CD103 on total CD8+ vs. T. gondii–specific (dex Kb-OVA+) CD8+ T cells from the brain by flow cytometry. Numbers on Facs plots show the percentage ±SD of each subset (TN: CD69− CD49a− CD103−, SP: CD69+ CD49a− CD103−, DP: CD69+ CD49a+ CD103−, TP: CD69+ CD49a+ CD103+) out of Kb-OVA-specific CD8+ T cells or out of total CD8+ T cells, as indicated. (D and E) Graphs represent the percentage of each subset out of parasite (OVA)-specific CD8+ T cells (D) or out of total CD8+ T cells (E). Bars show mean ± SD of N = 17 mice at d13pi (pooled from three experiments), N = 12 mice at d32pi (pooled from three experiments), N = 10 mice at d76pi (from one experiment). Two-way ANOVA with Tukey’s multiple comparison test applied on the three groups, for every subset.
Fig. 3.
Fig. 3.
CD4+ T cells drive the differentiation of TP and cytotoxic parasite-specific brain-resident CD8+ T cells, thereby optimizing brain parasite control upon chronic stage. (A) Schematics of experimental workflow: C57BL/6 mice were administered with an anti-CD4 depleting antibody at day −3 and −1 before infection with 200 tachyzoites of GRA6-OVA-expressing T. gondii Pru. Injection of anti-CD4 antibody was repeated at d5pi and maintained once per week onward, until chronic stage. (B and C) Representative contour plots of CD4/CD8 staining after gating on single, live, CD3+ T cells from the spleen (B) or brain (C). Numbers on Facs plots show the percentage ±SD of CD4+ T cells out of CD3+ T cells. (D and E) Bar graph showing absolute number of CD4+ T cells in the spleen (D) and brain (E) at d33pi. (F and G) Representative contour plots of Kb-OVA dextramer staining after gating on single, live, CD3+ CD8+ T cells from the spleen (F) or brain (G). Numbers on dot plots show the percentage ±SD of Kb-OVA dextramer+ T cells out of CD8+ T cells. (H and I) Bar graph showing absolute number of parasite (OVA)-specific CD8+ T cells in the spleen (H) and brain (I) at d33pi. (D, E, H, and I) Each dot represents one mouse. Bars represent the mean ± SD of N = 9 vs. 10 mice per group, pooled from two independent experiments with between 4 and 5 mice per group in each experiment. (D and E) Mann-Whitney test between isotype-treated and anti-CD4-treated groups. (H and I) Unpaired t test between isotype-treated and anti-CD4-treated groups. (J) Representative contour plots showing surface expression of CD69, CD49a, and CD103 on OVA-specific (Kb-OVA dextramer+) CD8+ T cells isolated from the brain. Numbers on Facs plots show the percentage ±SD of each subset (TN: CD69− CD49a− CD103−, SP: CD69+ CD49a− CD103−, DP: CD69+ CD49a+ CD103−, TP: CD69+ CD49a+ CD103+) out of Kb-OVA-specific CD8+ T cells. (K) Graph showing the percentage of each subset out of parasite (OVA)-specific CD8+ T cells. Bars show mean ± SD of N = 9 vs. 10 mice per group, pooled from two independent experiments with between 4 and 5 mice per group in each experiment. Mann-Whitney test performed for SP and unpaired t tests performed for TN, DP, and TP between isotype-treated and anti-CD4-treated groups. (L) Bar graph showing the percentage of granzyme B+ cells out of Tcirc (TN, Left) or bTr (DP plus TP, Right) parasite (OVA)-specific CD8+ T cells. Bars show the mean ± SD of N = 9 vs. 10 mice per group, pooled from two independent experiments with between 4 and 5 mice per group in each experiment. Mann-Whitney test performed for the TN subset and unpaired t test performed for the DP+TP subsets, between isotype-treated and anti-CD4-treated groups. (M) Brain parasite burden measured by qPCR on genomic DNA extracted from the brain. The dotted line indicates the limit of quantification. The line shows mean of N = 9 vs. 10 mice per group, pooled from two independent experiments with between 4 and 5 mice per group in each experiment. The Mann–Whitney test was performed to compare isotype-treated and anti-CD4-treated groups.
Fig. 4.
Fig. 4.
TAP-mediated MHC I antigen presentation by excitatory neurons and CX3CR1+ brain macrophages fine-tune the differentiation of parasite-specific brain-resident CD8+ T cells. (A) Schematics of experimental workflow: Tap1fl/fl X Camk2aCreER- (TAPneuronWT) and Camk2aCreER+ (TAPneuronKO) mice were treated with tamoxifen, infected 1 wk later with 200 tachyzoites of GRA6-OVA-expressing T. gondii Pru, and treated from d10pi to d14pi with an antiparasitic drug (pyrimethamine) to avoid excessive parasite burden in TAPneuronKO mice due to defective MHCI neuronal presentation (43). (B) Brain parasite burden measured by qPCR on genomic DNA extracted from the brain at d33pi. Mann–Whitney test between TAPneuronWT and TAPneuronKO groups. (C) Graph showing the percentage of each subset (TN: CD69− CD49a− CD103−, SP: CD69+ CD49a− CD103−, DP: CD69+ CD49a+ CD103−, TP: CD69+ CD49a+ CD103+) out of parasite (OVA)-specific CD8+ T cells. Unpaired t tests performed for each subset between TAPneuronWT and TAPneuronKO groups. (D) Graph showing the absolute number of parasite (OVA)-specific CD8+ bTr cells in each subset. Unpaired t tests performed for each subset between TAPneuronWT and TAPneuronKO groups. (E) Graph showing the absolute number of parasite (OVA)-specific CD8+ bTr cells (i.e., DP & TP) coexpressing IFN-γ and granzyme B following PMA/ionomycin stimulation, i.e., bifunctional cells. Unpaired t test performed between TAPneuronWT and TAPneuronKO groups. (BE) Outliers were removed with the ROUT method with max desired FDR (Q) set at 2% before applying the statistical tests. Bars show mean ± SD of N = 19 vs. 15 mice per group, pooled from three independent experiments. (F) Schematics of experimental workflow: Tap1fl/fl X Cx3cr1CreER- (TAPmicrogliaWT) and Cx3cr1CreER+ (TAPmicrogliaKO) mice were treated with tamoxifen, infected 1 mo later with 200 tachyzoites of GRA6-OVA-expressing T. gondii Pru, and treated from d10pi to d14pi with an antiparasitic drug (pyrimethamine) to avoid differential parasite burden between the two genotypes. (G) Brain parasite burden measured by qPCR on genomic DNA extracted from the brain at d33pi. Bars show the mean of N = 23 vs. 15 mice per group, pooled from three independent experiments. Mann-Whitney test between TAPmicrogliaWT and TAPmicrogliaKO groups. (H) Graph showing the percentage of each subset out of parasite (OVA)-specific CD8+ T cells. (I) Graph showing the absolute number of parasite (OVA)-specific CD8+ bTr cells in each subset. (J) Graph showing the absolute number of parasite (OVA)-specific CD8+ bTr cells (i.e., DP & TP) coexpressing IFN-γ and granzyme B following PMA/ionomycin stimulation, i.e., bifunctional cells. (GJ) Outliers removed with the ROUT method with max desired FDR (Q) set at 2%. Bars show mean ± SD of N = 23 vs. 15 mice per group, pooled from three independent experiments. For all datasets, normality was assessed with the D’Agostino–Pearson test. If normal, a two-tailed unpaired t test was applied, if not, a Mann-Whitney test was chosen.
Fig. 5.
Fig. 5.
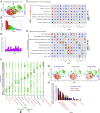
Longitudinal single-cell RNA-seq analysis of brain-isolated T. gondii–specific CD8+ T cells in encephalitis and latency infection models. (A) UMAP plot of 6182 brain-isolated OVA-specific CD8+ T cells pooled from three conditions: early encephalitis (d52pi, 4 mice pooled), early latency (d52pi, 6 mice pooled), and late latency (d160pi, 10 mice pooled), partitioned in 13 clusters using Seurat-embedded Louvain clustering algorithm. (B) Bar graph showing the proportion of each cluster within the entire dataset. (C) GSEA using tissue-resident T cell gene signatures (from refs. , , , , and 56) vs. circulating T cell gene signatures (from refs. and 17). Each cluster is colored and tagged as “resident” (bTr, orange) or “circulating” (bTcirc, green), based on the enrichment scores of resident vs. circulating T cell signatures. Clusters showing positive enrichment with both types of signatures (hybrid profile) were designated as “bTmixed” (black-colored text). (D) Bar graph showing the proportion of CD103-positive cells (based on Facs-sorting) among each cluster. (E) GSEA using previously published and/or public “functional” gene signatures including recent TCR activation (17), imprinting of tissue dissociation procedure (57), stem-like CD4+ T cells (58), SLEC (59), mitochondrial translation [Reactome pathway knowledgebase (60)], oxidative phosphorylation [KEGG pathway database (61)], type I and type II IFN responses (62), proliferation (63). (F) Dot plot showing average expression (color intensity) and percentage of gene-expressing cells (dot size) per cluster for a panel of individual genes. Boxes around the dots and annotations below the cluster number highlight up-regulated genes of interest of every cluster. (G) UMAP separately showing cells from the three experimental conditions. (H) Bar graph showing the proportion of each cluster per condition, normalized with respect to the total number of cells analyzed per condition. Annotations below the cluster number indicate the inferred cell “identity.”

References

    1. Belz G. T., Kallies A., Effector and memory CD8+ T cell differentiation: Toward a molecular understanding of fate determination. Curr. Opin. Immunol. 22, 279–285 (2010). - PubMed
    1. Gebhardt T., et al. , Memory T cells in nonlymphoid tissue that provide enhanced local immunity during infection with herpes simplex virus. Nat. Immunol. 10, 524–530 (2009). - PubMed
    1. Heeg M., Goldrath A. W., Insights into phenotypic and functional CD8(+) T(RM) heterogeneity. Immunol. Rev. 316, 8–22 (2023). - PMC - PubMed
    1. van Gisbergen K., Zens K. D., Munz C., T-cell memory in tissues. Eur. J. Immunol. 51, 1310–1324 (2021). - PubMed
    1. Day C. L., et al. , PD-1 expression on HIV-specific T cells is associated with T-cell exhaustion and disease progression. Nature 443, 350–354 (2006). - PubMed