. 2024 Aug;11(29):e2308505.
doi: 10.1002/advs.202308505. Epub 2024 Jun 5.

Single-Cell Spatial Transcriptomics Unveils Platelet-Fueled Cycling Macrophages for Kidney Fibrosis

Affiliations

Single-Cell Spatial Transcriptomics Unveils Platelet-Fueled Cycling Macrophages for Kidney Fibrosis

Jun Liu et al. Adv Sci (Weinh). 2024 Aug.

Abstract

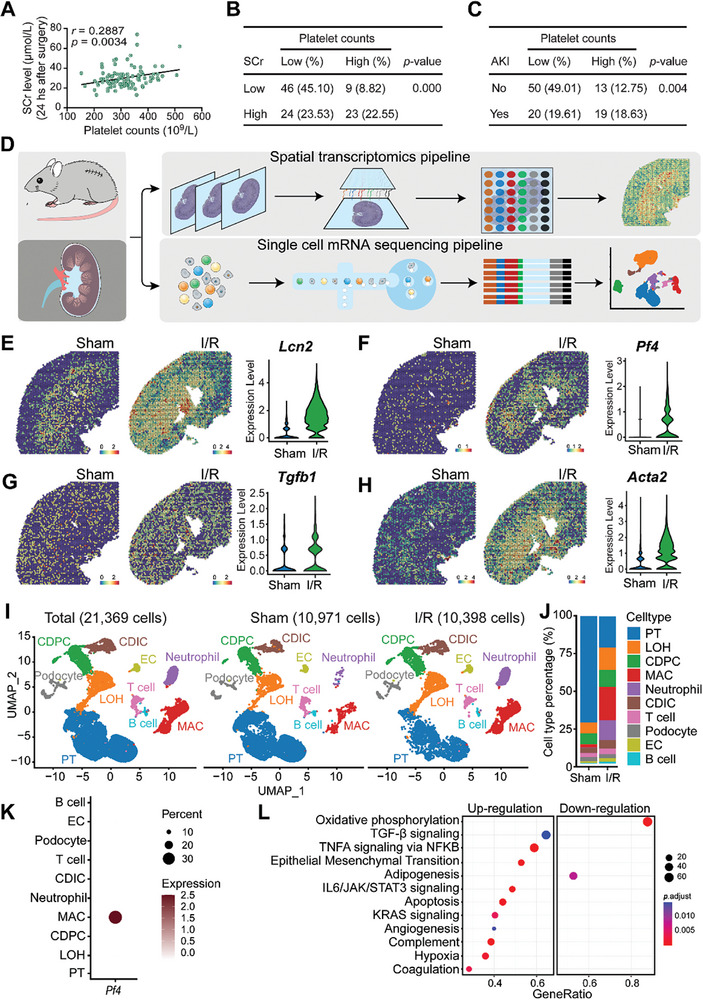
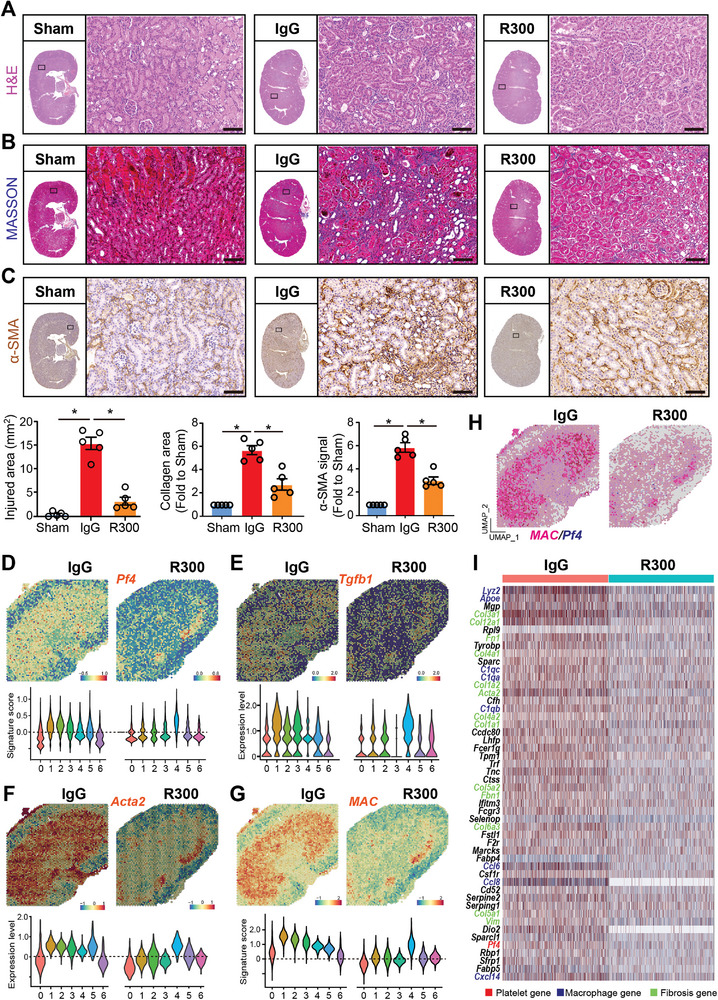
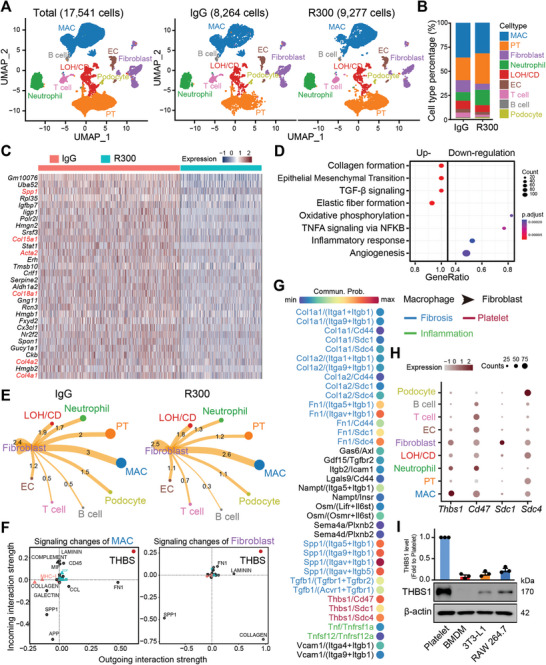
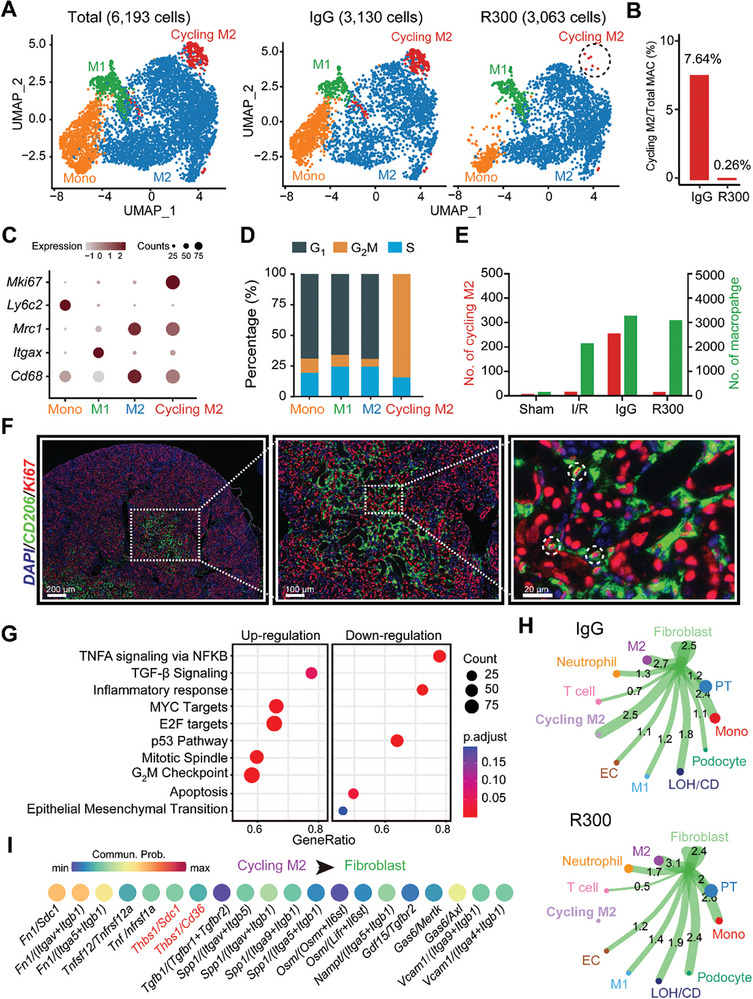
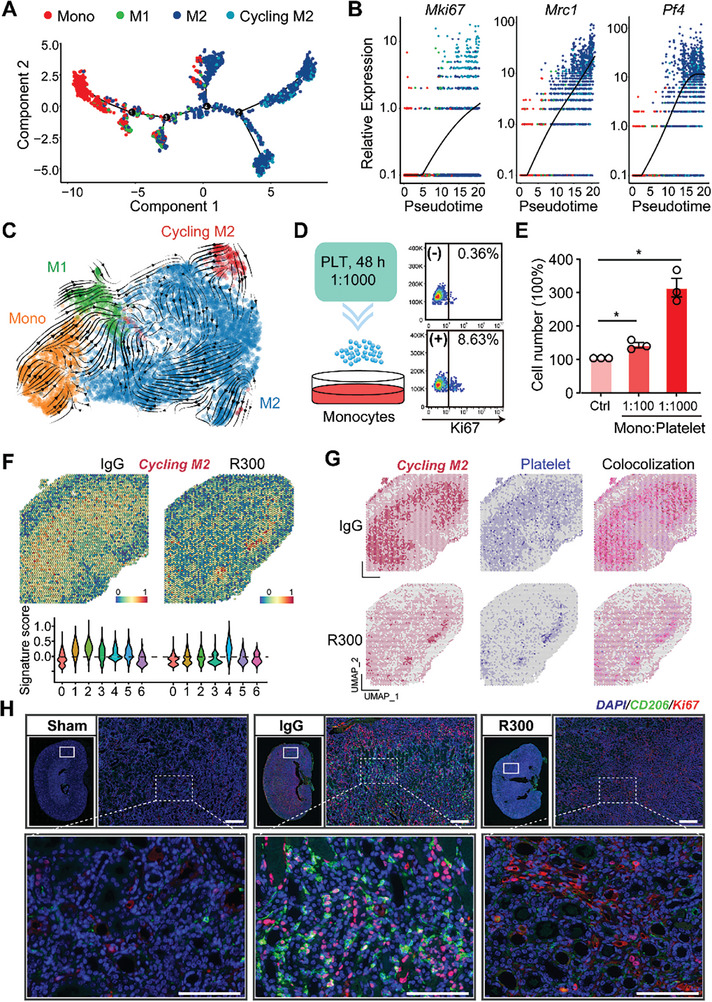
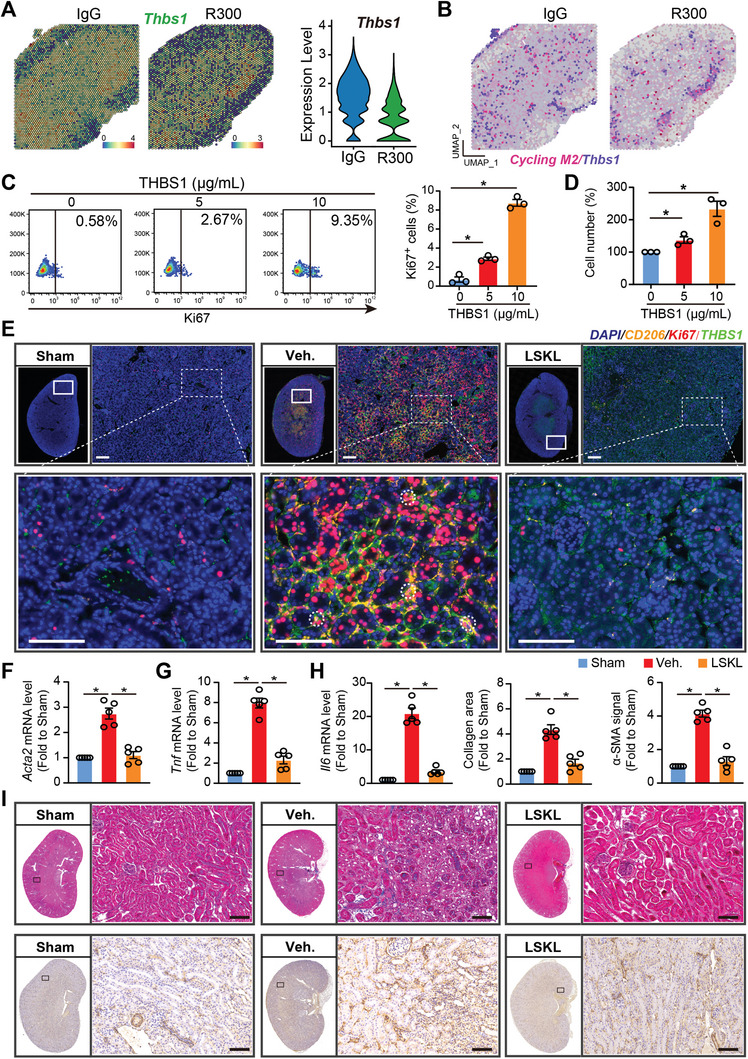
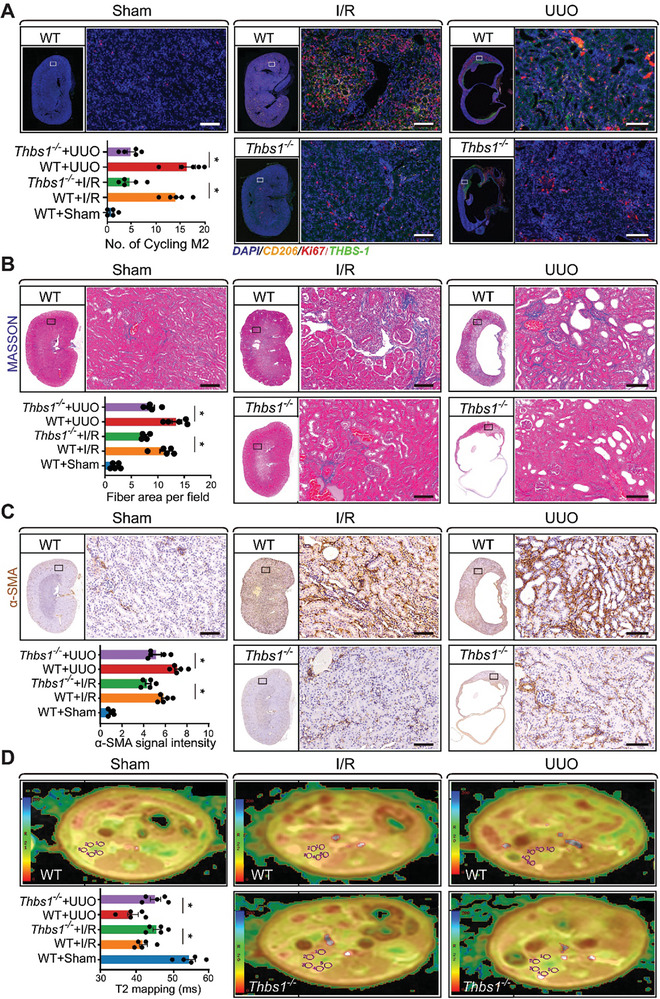
With the increasing incidence of kidney diseases, there is an urgent need to develop therapeutic strategies to combat post-injury fibrosis. Immune cells, including platelets, play a pivotal role in this repair process, primarily through their released cytokines. However, the specific role of platelets in kidney injury and subsequent repair remains underexplored. Here, the detrimental role of platelets in renal recovery following ischemia/reperfusion injury and its contribution to acute kidney injury to chronic kidney disease transition is aimed to investigated. In this study, it is shown that depleting platelets accelerates injury resolution and significantly reduces fibrosis. Employing advanced single-cell and spatial transcriptomic techniques, macrophages as the primary mediators modulated by platelet signals is identified. A novel subset of macrophages, termed "cycling M2", which exhibit an M2 phenotype combined with enhanced proliferative activity is uncovered. This subset emerges in the injured kidney during the resolution phase and is modulated by platelet-derived thrombospondin 1 (THBS1) signaling, acquiring profibrotic characteristics. Conversely, targeted inhibition of THBS1 markedly downregulates the cycling M2 macrophage, thereby mitigating fibrotic progression. Overall, this findings highlight the adverse role of platelet THBS1-boosted cycling M2 macrophages in renal injury repair and suggest platelet THBS1 as a promising therapeutic target for alleviating inflammation and kidney fibrosis.

Keywords: kidney fibrosis; macrophage proliferation; platelet; thrombospondin 1.


Conflict of interest statement

The authors declare no conflict of interest.

Figures

Figure 1
Figure 1
Platelets link to AKI severity and play a role in ischemia/reperfusion‐induced injury A total of 102 patients with diverse cardiovascular diseases who underwent the operation of extracorporeal circulation during cardiovascular surgery were recruited. All the patients were at risk for ischemia/reperfusion (I/R) AKI. A) The correlation of basal platelet counts and serum creatinine (SCr) level in the 102 patients were calculated; the 95% confidence interval (CI) was: 0.0988 to 0.4566. B) Correlation of patients with high‐ or low‐level of Scr and high‐ or low‐level of platelet counts in the cohort of 102 patients; a two‐tailed Fisher exact probability test was performed. C) Correlation of patients with or without AKI and high‐ or low‐level of platelet counts in the cohort of 102 patients; a two‐tailed Fisher exact probability test was performed. Wild‐type C57BL/6J mice were subjected to bilateral I/R injury surgery, or a sham operation, and were sacrificed 48 h after the surgery. Injured and normal sham kidneys were harvested for single‐cell mRNA‐sequencing and spatial transcriptomics. D) The single‐cell spatial transcriptomics experimental scheme on mouse kidney with or without I/R injury. E‐H) Spatial feature plots of Lcn2, Pf4, Tgfb1, and Acta2 in ST spots and violin plots showing its relative expression level in sham or I/R‐treated mouse kidneys. I) UMAP projection of a total of 21 369 cells including 10 971 cells from the sham kidney, and 10 398 cells from the injured kidney; cell identity was annotated based on cell type‐specific markers. J) The barplot shows the percentage of each cell type out of the total cells in each group. K) Dotplot shows the expression pattern of platelet activation marker Pf4 in each cell type of the two groups. L) Dotplot shows the enriched GSEA hallmark terms in macrophages from I/R‐treated kidneys compared to sham kidneys based on the scRNA‐seq data. PT, proximal tubular; LOH, Loop of Henle; CDPC, collecting duct principal cell; MAC, macrophage; CDIC, collecting duct intercalated cell; EC, endothelial cell.
Figure 2
Figure 2
Depletion of platelets attenuates I/R‐induced kidney damage and fibrosis. Wild‐type C57BL/6J mice were subjected to bilateral I/R surgery on the kidney for 48 h followed by intravenous tail vein injection of 4 µg kg−1 mouse platelet depleting antibody R300 or the isotope IgG (for 4 days. Mice which received the sham operation were labeled as Sham (n = 5 mice per group). On the 7th day after the surgery, all the mice were sacrificed and kidney tissues were harvested for histopathology, single‐cell‐RNA‐sequencing, and spatial transcriptomics experiments. The paraffin‐embedded kidney sections were prepared and then stained to evaluate kidney injury and fibrosis progression. A–C) Representative images and quantification of H&E, MASSON staining (blue signal), and α‐SMA immunohistochemistry (IHC) signal in the kidney. The whole slide images of the serial sections of the stained kidney were also displayed, and differences between the indicated groups were analyzed using an unpaired two‐tailed Student's t‐test, and the statistical significance was labeled with an asterisk; Scale bar: 50 µm, n = 5 for each group. D–G) Spatial feature plots of Pf4, Tgfb1, Acta2, and macrophage signature (MAC) in spatial transcriptomics (ST) spots of the indicated groups and Violin plots showing its relative expression in each cell cluster. H) Feature plot showing the mRNA colocalization of Pf4 and macrophage (MAC) signature genes, including Adgre1, Itgax, Lyz2, Apoe, C1qb, and C1qa in ST spots of the indicated two groups. I) The spatial expression matrix data of macrophage‐enriched clusters 1, 2, and 3 in the IgG‐treated kidney and the matched clusters 1 and 2 in the R300‐treated kidney were compared to define the differentially expressed genes (DEGs). Heatmap showing the expression of the top 50 genes upregulated in the IgG‐treated kidney. Platelet, macrophage, and fibrosis‐related genes are highlighted in red, blue, and green font respectively.
Figure 3
Figure 3
Platelet‐derived THBS1 signaling mediates macrophage‐fibroblast communication in I/R‐induced kidney fibrosis. Wild‐type C57BL/6J mice were subjected to surgery of bilateral I/R kidney injury for 48 h followed by intravenous injection of 4 µg kg−1 mouse platelet depleting antibody R300 or the isotope IgG for 4 days. On the 7th day after the surgery, mice were sacrificed, and kidney tissues were harvested for single‐cell‐RNA‐sequencing experiments. A) UMAP projection of a total of 17 541 cells including 8264 cells from the IgG‐treated injured kidney, and 9277 cells from the R300‐treated injured kidney; cell identity was annotated based on cell type‐specific markers. B) Bar plot of different cell type populations displayed as percentage of total cells. C) Heatmap showing the top 30 genes upregulated in fibroblast of the IgG‐treated injured kidney as compared to the R300‐treated kidneys. D) The dot plot shows the signaling pathways enriched in fibroblast of the IgG‐treated injured kidney as compared to the R300‐treated kidney based on the scRNA‐seq data in (C). E) The potential intercellular cell‐cell communications were predicted based on the interactive ligand‐receptor numbers by using the R package “Cellchat”. F) The possible outgoing and incoming signaling enriched in macrophage (left panel) and fibroblast (right panel) of the IgG‐treated injured kidney as compared to the R300‐treated kidney. G) The total pairs of signaling (ligand/receptor) potentially arising from macrophage outgoing to the fibroblast. H) The dot plot shows the expression pattern of Thbs1 and its receptor genes in all identified cell types. I) The relative protein expression of THBS1 in platelet, bone marrow‐derived macrophage (BMDM), fibroblast cell line 3T3‐L1, and mouse monocyte/macrophage cell line RAW 264.7. Quantification of THBS1 is normalized to β‐actin with respect to the platelet group (n = 3; mean ± s.e.m.).
Figure 4
Figure 4
A novel platelet‐dependent subset cycling M2 macrophages exhibits profibrotic characteristics. A) UMAP projection of a total of 6193 monocyte/macrophages including 3130 cells from the IgG‐treated injured kidney, and 3063 cells from the R300‐treated injured kidney. B) The bar plot shows the percentage of cycling M2 out of the total macrophages separated by sample. C) Expression pattern of the indicated genes in all monocyte/macrophage cell types in the two samples. D) Percentage of cell cycle phases in each cell type. E) Quantification of the number of cycling M2 and M2 in mouse kidneys of the four indicated groups. F) Representative fluorescence images of cycling M2 (CD206/Ki67) in the injured kidneys in 7th day after I/R injury. G) Signaling pathways enriched in cycling M2 as compared to M2 macrophages. H) Predicted potential intercellular cell‐cell communications between fibroblasts and other cell types. I) The top 20 ligand/receptor (LR) pairs arising from cycling M2 macrophages outgoing into fibroblasts.
Figure 5
Figure 5
Platelet engagement drives the proliferation and presence of cycling M2 macrophages. A) Pesedoutime projection of the potential cell differentiation trajectory of the four cell types by using the R package “monocle2”. B) The relative expressions of Mki67, Mrc1, and Pf4 in each cell type along pseudotime. Each dot represents an individual cell under the pesedoutime projection. C) RNA velocity shows the potential differentiation direction of the four cell types. D,E) RAW 264.7 cells were treated with different numbers of platelets for 48 h and subjected to flow cytometry for Ki67 expression D) or cell counting E), n = 3 for each group, the statistics were analyzed using an unpaired two‐tailed Student's t‐test, * p < 0.05. F) Spatial feature and violin plot of cycling M2 macrophage signature in ST spots and its relative expressions in each cluster of the IgG‐treated injured kidney as compared to the R300‐treated ones. G) The distribution of cycling M2, platelet's signature, and their colocalization in ST spots of the indicated two groups. H) Representative fluorescence images and quantification of cycling M2 in the kidneys from the IgG‐treated injured kidney and R300‐treated ones (n = 5 for each group). Scale bar: 50 µm.
Figure 6
Figure 6
Platelet THBS1 antagonism diminishes cycling M2 proliferation and alleviates kidney fibrosis. A) Spatial feature plot of Thbs1 in ST spots of the IgG‐treated injured kidney as compared to the R300‐treated ones and Violin plot showing its relative expression. B) Feature plot showing the colocalization of Thbs1 and cycling M2 in ST spots of the IgG‐treated injured kidney and the R300‐treated ones. Mice received the kidney I/R injury treatment with or without THBS1 inhibitor LSKL. 7 or 21 days after the I/R injury, mice were sacrificed and kidney tissues were harvested for immunofluorescence (Day 7) or histopathology (Day 21), respectively. C,D) RAW 264.7 cells were treated with different doses of THBS1 and subjected to flow cytometry for Ki67 expression (C), or cell counting (D). E) Representative fluorescence images of CD206, Ki67, and THBS1 in the kidneys of the indicated three groups (n = 5 mice per group), Scale bar: 50 µm. F–H) The relative mRNA expression of Tnf, Il6, and Acta2 were analyzed in the kidneys of the indicated three groups (n = 5 mice per group). I) Representative whole kidney staining images of MASSON, and IHC for α‐SMA from each group were displayed (n = 5 for each group), Scale bar = 50 µm. All values are presented as mean ± s.e.m. The statistics were analyzed using an unpaired two‐tailed Student's t‐test, * p < 0.05.
Figure 7
Figure 7
Deletion of platelet Thbs1 in mice shields kidneys from fibrotic changes post‐I/R injury. Wild‐type or Thbs1 knockout mice were subjected to the surgery for bilateral I/R kidney injury or unilateral ureteral obstruction (UUO) and housed for 7 days. After that, mice were sacrificed, and kidney tissues were harvested for immunofluorescence. A) Representative images and the quantifications of THBS1/CD206/Ki67 immunofluorescence (IF) signal in the kidney (n = 5 for each group). Wild‐type or Thbs1 knockout mice were subjected to the surgery for bilateral I/R kidney injury or UUO and housed for 21 days and 14 days (n = 5 for each group), respectively. After that, all the mice first received Nuclear Magnetic Resonance Imaging (NMRI), followed by sacrificing, and kidney tissues were harvested for histopathology, Scale bar: 50 µm. B) Representative MASSON staining images and the quantifications of interstitial collagen accumulation (blue signal), Scale bar: 50 µm. C) Representative images and the quantifications of α‐SMA IHC signal in the kidney (n = 5 for each group). The whole pictures of the serial sections of the stained kidney were also displayed, and statistics between the indicated groups were analyzed using an unpaired two‐tailed Student's t‐test, and the significance was labeled with an asterisk; Scale bar: 50 µm. D) Representative NMRI images of the mouse kidney and the quantifications of T2 mapping for the kinetic motion of water molecules in the renal cortex; All values are presented as mean ± s.e.m.; n = 5 for each group, the statistics were analyzed using an unpaired two‐tailed Student's t‐test, * p < 0.05.

References

    1. Kellum J. A., Romagnani P., Ashuntantang G., Ronco C., Zarbock A., Anders H. J., Nat. Rev. Dis. Primers. 2020, 7, 52. - PubMed
    1. Hoste E. A. J., Kellum J. A., Selby N. M., Zarbock A., Palevsky P. M., Bagshaw S. M., Goldstein S. L., Cerdá J., Chawla L. S., Nat. Rev. Nephrol. 2018, 14, 607. - PubMed
    1. Eltzschig H. K., Eckle T., Nat. Med. 2011, 17, 1391. - PMC - PubMed
    1. Bonventre J. V., Yang L., J. Clin. Invest. 2011, 121, 4210. - PMC - PubMed
    1. Meng X. M., Nikolic‐Paterson D. J., Lan H. Y., Nat. Rev. Nephrol. 2016, 12, 325. - PubMed